Project Snapshot
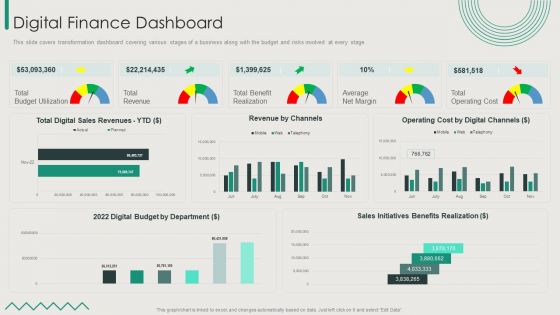
Organization Transition Digital Finance Dashboard Ppt PowerPoint Presentation File Good PDF
This slide covers transformation dashboard covering various stages of a business along with the budget and risks involved at every stage. Deliver and pitch your topic in the best possible manner with this Organization Transition Digital Finance Dashboard Ppt PowerPoint Presentation File Good PDF. Use them to share invaluable insights on Total Budget Utilization, Total Revenue, Total Benefit Realization and impress your audience. This template can be altered and modified as per your expectations. So, grab it now.
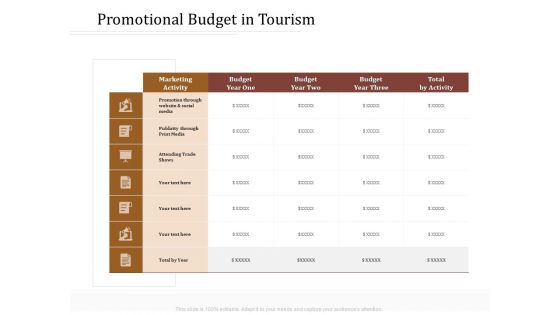
Key Metrics Hotel Administration Management Promotional Budget In Tourism Demonstration PDF
Presenting this set of slides with name key metrics hotel administration management promotional budget in tourism demonstration pdf. The topics discussed in these slides are marketing, budget, print media, website. This is a completely editable PowerPoint presentation and is available for immediate download. Download now and impress your audience.
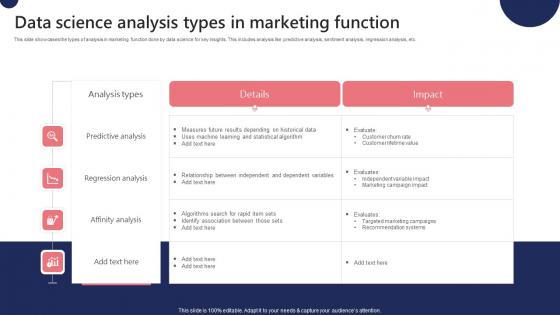
Data Science Analysis Types In Marketing Function Ppt Ideas Designs Download Pdf
This slide showcases the types of analysis in marketing function done by data science for key insights. This includes analysis like predictive analysis, sentiment analysis, regression analysis, etc. Pitch your topic with ease and precision using this Data Science Analysis Types In Marketing Function Ppt Ideas Designs Download Pdf. This layout presents information on Predictive Analysis, Sentiment Analysis, Regression Analysis. It is also available for immediate download and adjustment. So, changes can be made in the color, design, graphics or any other component to create a unique layout. This slide showcases the types of analysis in marketing function done by data science for key insights. This includes analysis like predictive analysis, sentiment analysis, regression analysis, etc.
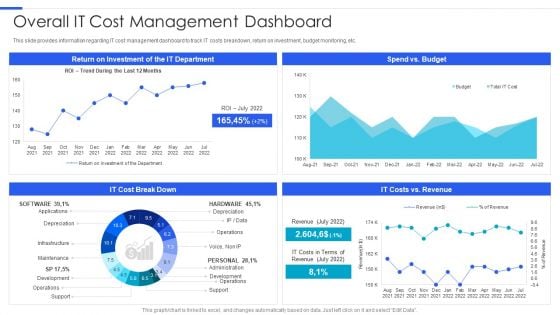
Playbook For Managing Information Overall IT Cost Management Dashboard Inspiration PDF
This slide provides information regarding IT cost management dashboard to track IT costs breakdown, return on investment, budget monitoring, etc. Deliver an awe inspiring pitch with this creative Playbook For Managing Information Overall IT Cost Management Dashboard Inspiration PDF bundle. Topics like Return Investment, IT Department, Spend Vs Budget can be discussed with this completely editable template. It is available for immediate download depending on the needs and requirements of the user.

Data Evaluation And Processing Toolkit Value Stream Information Data Analytics Structure Themes PDF
The slides shows the stages of data analytics with reactive and proactive approach. In includes four steps collection, analysis, predictive and actions. This modern and well-arranged Data Evaluation And Processing Toolkit Value Stream Information Data Analytics Structure Themes PDF provides lots of creative possibilities. It is very simple to customize and edit with the Powerpoint Software. Just drag and drop your pictures into the shapes. All facets of this template can be edited with Powerpoint, no extra software is necessary. Add your own material, put your images in the places assigned for them, adjust the colors, and then you can show your slides to the world, with an animated slide included.
Customer Relationship Strategy For Building Loyalty Business Revenue Dashboard Icons PDF
This slide highlights business dashboard with multiple statistics to estimate the revenue and profitability of company as a result of new customer intimacy strategy. Deliver an awe inspiring pitch with this creative customer relationship strategy for building loyalty business revenue dashboard icons pdf bundle. Topics like average revenue per customer, compared to previous year, customer acquisition cost, cac vs customer lifetime value, revenue can be discussed with this completely editable template. It is available for immediate download depending on the needs and requirements of the user.
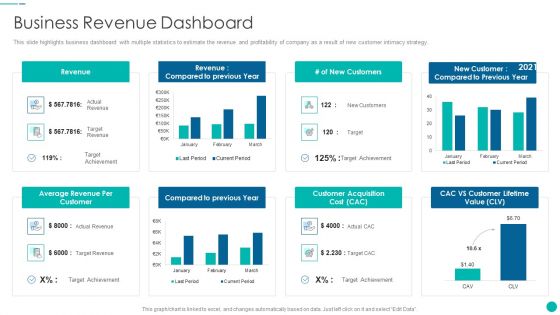
Tactical Procedure For Increasing Customer Intimacy Business Revenue Dashboard Diagrams PDF
This slide highlights business dashboard with multiple statistics to estimate the revenue and profitability of company as a result of new customer intimacy strategy. Deliver an awe inspiring pitch with this creative tactical procedure for increasing customer intimacy business revenue dashboard diagrams pdf bundle. Topics like average revenue per customer, compared to previous year, customer acquisition cost, cac vs customer lifetime value, revenue can be discussed with this completely editable template. It is available for immediate download depending on the needs and requirements of the user.
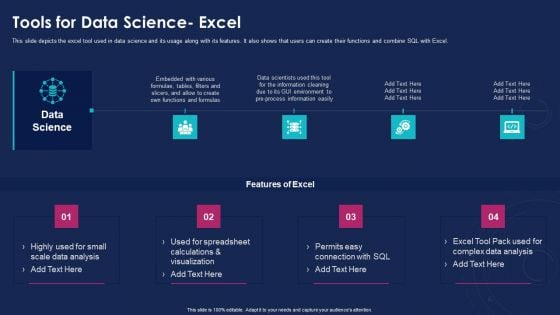
Data Analytics IT Tools For Data Science Excel Ppt Professional Templates PDF
This slide depicts the excel tool used in data science and its usage along with its features. It also shows that users can create their functions and combine SQL with Excel. This is a data analytics it tools for data science excel ppt professional templates pdf template with various stages. Focus and dispense information on eight stages using this creative set, that comes with editable features. It contains large content boxes to add your information on topics like data analysis, calculations and visualization, data scientists, process. You can also showcase facts, figures, and other relevant content using this PPT layout. Grab it now.
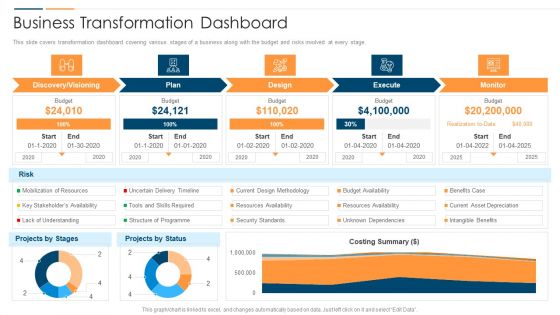
Revolution In Online Business Business Transformation Dashboard Ppt PowerPoint Presentation Gallery Structure PDF
This slide covers transformation dashboard covering various stages of a business along with the budget and risks involved at every stage. Deliver an awe inspiring pitch with this creative Revolution In Online Business Business Transformation Dashboard Ppt PowerPoint Presentation Gallery Structure PDF bundle. Topics like Discovery Visioning Plan, Design Execute Monitor can be discussed with this completely editable template. It is available for immediate download depending on the needs and requirements of the user.
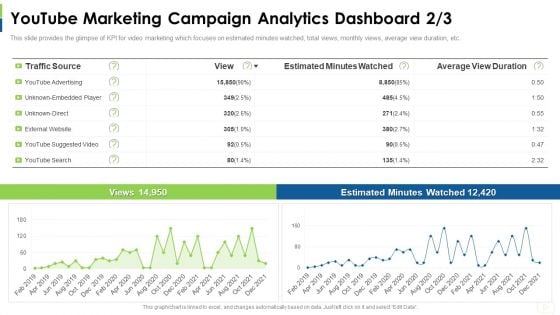
Social Platform As Profession Youtube Marketing Campaign Analytics Dashboard Direct Rules PDF
This slide provides the glimpse of KPI for video marketing which focuses on estimated minutes watched, total views, monthly views, average view duration, etc. Deliver and pitch your topic in the best possible manner with this social platform as profession youtube marketing campaign analytics dashboard direct rules pdf. Use them to share invaluable insights on youtube marketing campaign analytics dashboard and impress your audience. This template can be altered and modified as per your expectations. So, grab it now.
Sales Funnel Management For Revenue Generation Tracking Sales Pipeline And Lead Activity Dashboard Background PDF
This slide covers information regarding dashboard associated to tracking lead activity across sales pipeline. Deliver and pitch your topic in the best possible manner with this sales funnel management for revenue generation tracking sales pipeline and lead activity dashboard background pdf. Use them to share invaluable insights on team matterhorn, expansion opportunity, estimated value and impress your audience. This template can be altered and modified as per your expectations. So, grab it now.
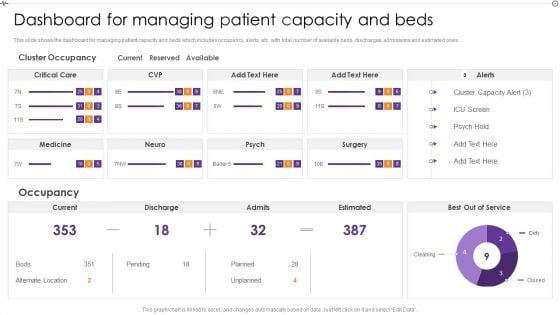
Advances In Healthcare Management System Dashboard For Managing Patient Capacity And Beds Mockup PDF
This slide shows the dashboard for managing patient capacity and beds which includes occupancy, alerts, etc, with total number of available beds, discharges, admissions and estimated ones. Deliver an awe inspiring pitch with this creative Advances In Healthcare Management System Dashboard For Managing Patient Capacity And Beds Mockup PDF bundle. Topics like Cluster Occupancy, Best Out Of Service, Cluster Capacity can be discussed with this completely editable template. It is available for immediate download depending on the needs and requirements of the user.
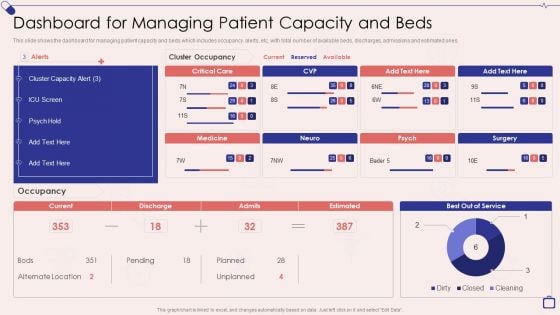
Implementing Integrated Software Dashboard For Managing Patient Capacity And Beds Download PDF
This slide shows the dashboard for managing patient capacity and beds which includes occupancy, alerts, etc, with total number of available beds, discharges, admissions and estimated ones.Deliver and pitch your topic in the best possible manner with this Implementing Integrated Software Dashboard For Managing Patient Capacity And Beds Download PDF. Use them to share invaluable insights on Alternate Location, Cluster Occupancy, Cluster Capacity and impress your audience. This template can be altered and modified as per your expectations. So, grab it now.
Integrating AI To Enhance Dashboard For Tracking Impact Of Procurement Process Slides PDF
This slide covers the dashboard for analysing procurement performance after automation. It include KPIs such as on-time delivery, percentage of returns, compliance index percentage, procurement ROI, cost-saving, budget spent on training, etc. Slidegeeks is here to make your presentations a breeze with Integrating AI To Enhance Dashboard For Tracking Impact Of Procurement Process Slides PDF With our easy-to-use and customizable templates, you can focus on delivering your ideas rather than worrying about formatting. With a variety of designs to choose from, youre sure to find one that suits your needs. And with animations and unique photos, illustrations, and fonts, you can make your presentation pop. So whether youre giving a sales pitch or presenting to the board, make sure to check out Slidegeeks first.
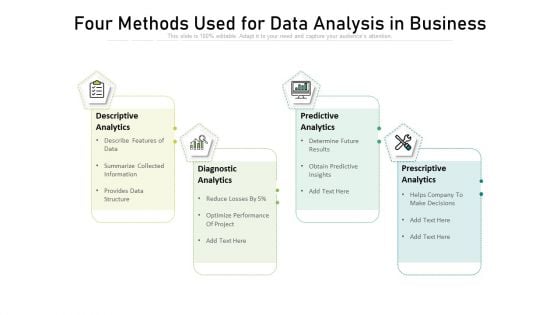
Four Methods Used For Data Analysis In Business Portrait PDF
Persuade your audience using this four methods used for data analysis in business portrait pdf.This PPT design covers four stages, thus making it a great tool to use. It also caters to a variety of topics including descriptive analytics, diagnostic analytics, predictive analytics, prescriptive analytics. Download this PPT design now to present a convincing pitch that not only emphasizes the topic but also showcases your presentation skills.
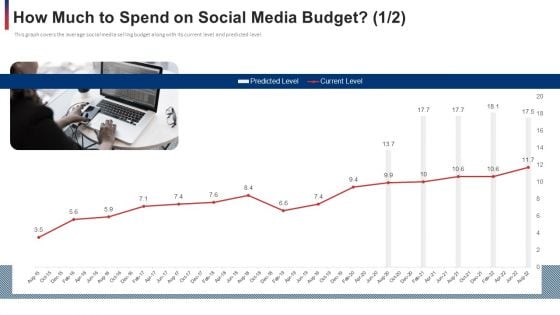
How Much To Spend On Social Media Budget Level Ppt Pictures Examples PDF
This graph covers the average social media selling budget along with its current level and predicted level. Deliver and pitch your topic in the best possible manner with this how much to spend on social media budget level ppt pictures examples pdf. Use them to share invaluable insights on how much to spend on social media budget and impress your audience. This template can be altered and modified as per your expectations. So, grab it now.
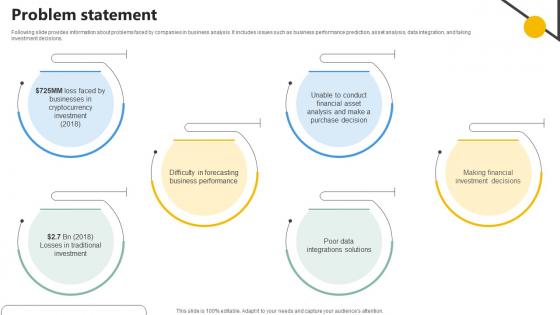
Problem Statement Analytics Company Investor Funding Elevator
Following slide provides information about problems faced by companies in business analysis. It includes issues such as business performance prediction, asset analysis, data integration, and taking investment decisions.Are you in need of a template that can accommodate all of your creative concepts This one is crafted professionally and can be altered to fit any style. Use it with Google Slides or PowerPoint. Include striking photographs, symbols, depictions, and other visuals. Fill, move around, or remove text boxes as desired. Test out color palettes and font mixtures. Edit and save your work, or work with colleagues. Download Problem Statement Analytics Company Investor Funding Elevator and observe how to make your presentation outstanding. Give an impeccable presentation to your group and make your presentation unforgettable. Following slide provides information about problems faced by companies in business analysis. It includes issues such as business performance prediction, asset analysis, data integration, and taking investment decisions.
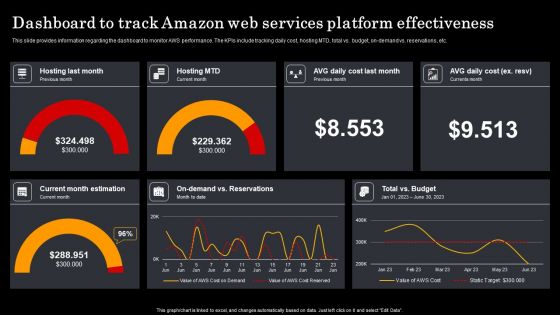
Assessment Of Amazon Brand Performance Dashboard To Track Amazon Web Guidelines PDF
This slide provides information regarding the dashboard to monitor AWS performance. The KPIs include tracking daily cost, hosting MTD, total vs. budget, on-demand vs. reservations, etc. Create an editable Assessment Of Amazon Brand Performance Dashboard To Track Amazon Web Guidelines PDF that communicates your idea and engages your audience. Whether you are presenting a business or an educational presentation, pre-designed presentation templates help save time. Assessment Of Amazon Brand Performance Dashboard To Track Amazon Web Guidelines PDF is highly customizable and very easy to edit, covering many different styles from creative to business presentations. Slidegeeks has creative team members who have crafted amazing templates. So, go and get them without any delay.
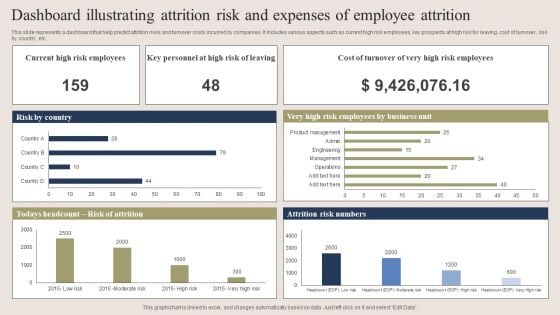
Dashboard Illustrating Attrition Risk And Expenses Of Employee Attrition Clipart PDF
This slide represents a dashboard that help predict attrition risks and turnover costs incurred by companies. It includes various aspects such as current high risk employees, key prospects at high risk for leaving, cost of turnover, risk by country, etc. Pitch your topic with ease and precision using this Dashboard Illustrating Attrition Risk And Expenses Of Employee Attrition Clipart PDF. This layout presents information on Dashboard Illustrating Attrition Risk, Expenses Of Employee Attrition . It is also available for immediate download and adjustment. So, changes can be made in the color, design, graphics or any other component to create a unique layout.
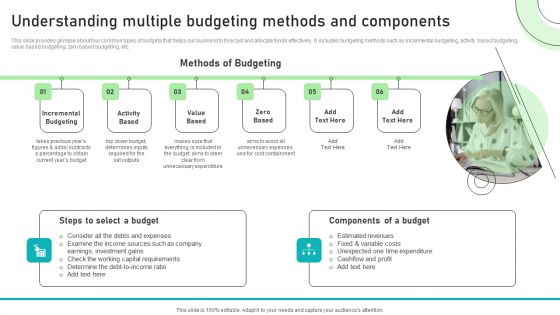
Adjusting Financial Strategies And Planning Understanding Multiple Budgeting Methods And Components Mockup PDF
This slide provides glimpse about four common types of budgets that helps our business to forecast and allocate funds effectively. It includes budgeting methods such as incremental budgeting, activity based budgeting, value based budgeting, zero based budgeting, etc. Slidegeeks is here to make your presentations a breeze with Adjusting Financial Strategies And Planning Understanding Multiple Budgeting Methods And Components Mockup PDF With our easy to use and customizable templates, you can focus on delivering your ideas rather than worrying about formatting. With a variety of designs to choose from, you are sure to find one that suits your needs. And with animations and unique photos, illustrations, and fonts, you can make your presentation pop. So whether you are giving a sales pitch or presenting to the board, make sure to check out Slidegeeks first.
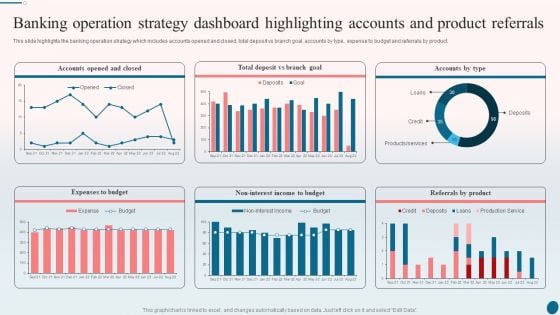
Banking Operation Strategy Dashboard Highlighting Accounts And Product Referrals Demonstration PDF
This slide highlights the banking operation strategy which includes accounts opened and closed, total deposit vs branch goal, accounts by type, expense to budget and referrals by product. Deliver an awe inspiring pitch with this creative Banking Operation Strategy Dashboard Highlighting Accounts And Product Referrals Demonstration PDF bundle. Topics like Income To Budget, Referrals By Product, Branch Goal can be discussed with this completely editable template. It is available for immediate download depending on the needs and requirements of the user.
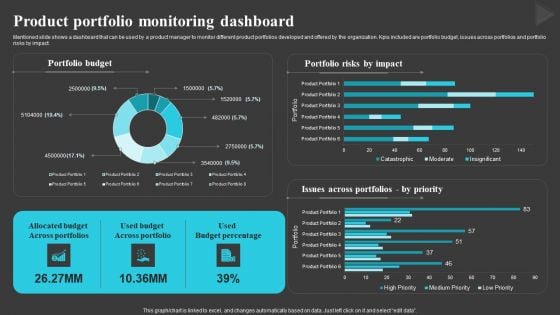
Product Portfolio Monitoring Dashboard Creating And Offering Multiple Product Ranges In New Business Diagrams PDF
Mentioned slide shows a dashboard that can be used by a product manager to monitor different product portfolios developed and offered by the organization. Kpis included are portfolio budget, issues across portfolios and portfolio risks by impact.Crafting an eye-catching presentation has never been more straightforward. Let your presentation shine with this tasteful yet straightforward Product Portfolio Monitoring Dashboard Creating And Offering Multiple Product Ranges In New Business Diagrams PDF template. It offers a minimalistic and classy look that is great for making a statement. The colors have been employed intelligently to add a bit of playfulness while still remaining professional. Construct the ideal Product Portfolio Monitoring Dashboard Creating And Offering Multiple Product Ranges In New Business Diagrams PDF that effortlessly grabs the attention of your audience Begin now and be certain to wow your customers.
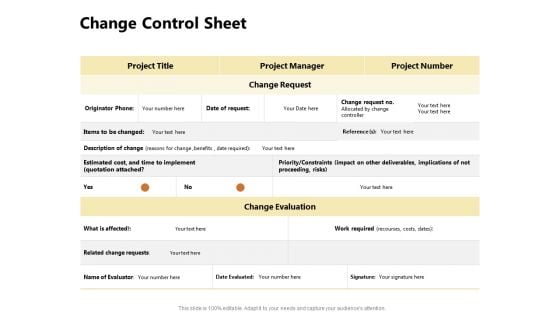
Present Future Budgeting Change Control Sheet Ppt PowerPoint Presentation Pictures Slide Portrait PDF
Presenting this set of slides with name present future budgeting change control sheet ppt powerpoint presentation pictures slide portrait pdf. The topics discussed in these slides are originator phone, estimated cost, related change requests, change evaluation, work required. This is a completely editable PowerPoint presentation and is available for immediate download. Download now and impress your audience.
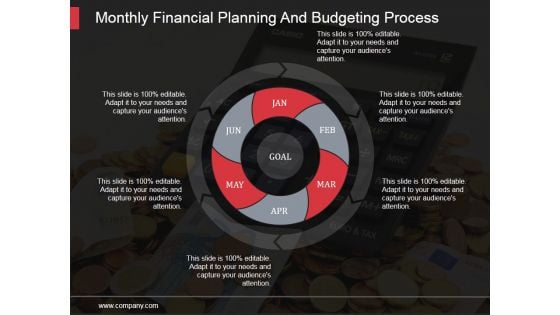
Monthly Financial Planning And Budgeting Process Ppt PowerPoint Presentation Visuals
This is a monthly financial planning and budgeting process ppt powerpoint presentation visuals. This is a six stage process. The stages in this process are growth, finance, development, financial development, economic growth, data analysis.

Best Practices For Workplace Diversity Data Collection Budget Download PDF
Following slide demonstrates best practices which can be used by businesses for data collection without interruptions. It includes best practices such as determine diversity data requirement, budget allocation and regular budget review. Persuade your audience using this Best Practices For Workplace Diversity Data Collection Budget Download PDF. This PPT design covers three stages, thus making it a great tool to use. It also caters to a variety of topics including Determine Data Requirement, Data Collection Budget, Budget Review. Download this PPT design now to present a convincing pitch that not only emphasizes the topic but also showcases your presentation skills.
Employee Turnover Dashboard With Gender Wise Attrition Rate Ppt PowerPoint Presentation Model Icons PDF
Presenting this set of slides with name employee turnover dashboard with gender wise attrition rate ppt powerpoint presentation model icons pdf. The topics discussed in these slides are estimated attrition, gender wise attrition rate, department wise attrition rate, attrition rate due salary hike, attrition rate due to distance from home, work travel causing attrition. This is a completely editable PowerPoint presentation and is available for immediate download. Download now and impress your audience.
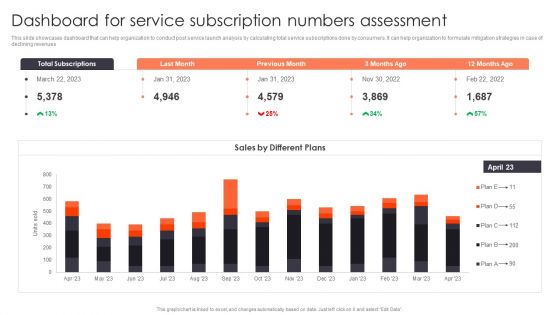
Promotion Strategies For New Service Launch Dashboard For Service Subscription Numbers Assessment Slides PDF
This slide showcases dashboard that can help organization to conduct post service launch analysis by calculating total service subscriptions done by consumers. It can help organization to formulate mitigation strategies in case of declining revenues. Presenting this PowerPoint presentation, titled Promotion Strategies For New Service Launch Dashboard For Service Subscription Numbers Assessment Slides PDF, with topics curated by our researchers after extensive research. This editable presentation is available for immediate download and provides attractive features when used. Download now and captivate your audience. Presenting this Promotion Strategies For New Service Launch Dashboard For Service Subscription Numbers Assessment Slides PDF. Our researchers have carefully researched and created these slides with all aspects taken into consideration. This is a completely customizable Promotion Strategies For New Service Launch Dashboard For Service Subscription Numbers Assessment Slides PDF that is available for immediate downloading. Download now and make an impact on your audience. Highlight the attractive features available with our PPTs.
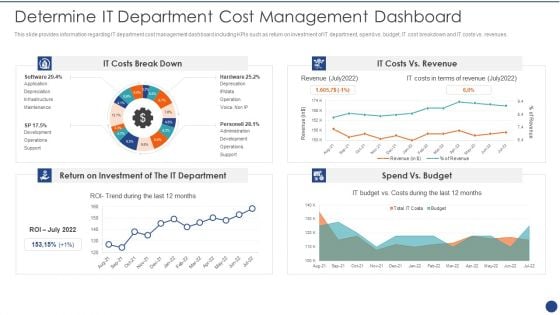
Cios Value Optimization Determine IT Department Cost Management Dashboard Microsoft PDF
This slide provides information regarding IT department cost management dashboard including KPIs such as return on investment of IT department, spend vs. budget, IT cost breakdown and IT costs vs. revenues. Deliver and pitch your topic in the best possible manner with this Cios Value Optimization Determine IT Department Cost Management Dashboard Microsoft PDF. Use them to share invaluable insights on IT Costs, Return Investment, IT Department and impress your audience. This template can be altered and modified as per your expectations. So, grab it now.
Automating Supply Chain Dashboard For Tracking Impact Of Procurement Process Automation Themes PDF
This slide covers the dashboard for analysing procurement performance after automation. It include KPIs such as on-time delivery, percentage of returns, compliance index percentage, procurement ROI, cost-saving, budget spent on training, etc. Deliver an awe inspiring pitch with this creative Automating Supply Chain Dashboard For Tracking Impact Of Procurement Process Automation Themes PDF bundle. Topics like Procurement ROI, Cost Saving, Perform Procurement can be discussed with this completely editable template. It is available for immediate download depending on the needs and requirements of the user.
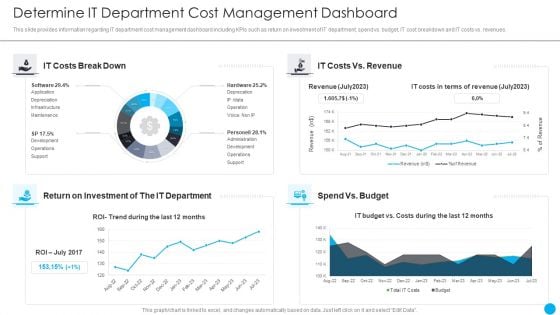
Cios Methodologies To Improve IT Spending Determine It Department Cost Management Dashboard Diagrams PDF
This slide provides information regarding IT department cost management dashboard including KPIs such as return on investment of IT department, spend vs. budget, IT cost breakdown and IT costs vs. revenues. Deliver and pitch your topic in the best possible manner with this Cios Methodologies To Improve IT Spending Determine It Department Cost Management Dashboard Diagrams PDF Use them to share invaluable insights on Extent Organizational, Reprioritization Cancellation, Investment Required and impress your audience. This template can be altered and modified as per your expectations. So, grab it now.
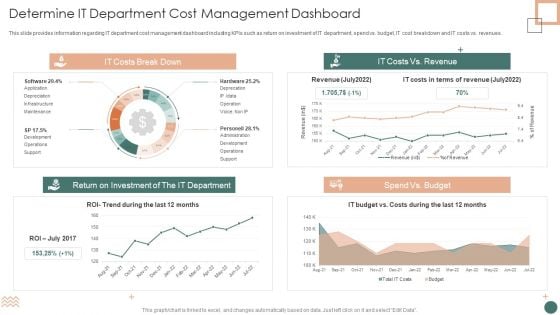
Improved Digital Expenditure Determine IT Department Cost Management Dashboard Introduction PDF
This slide provides information regarding IT department cost management dashboard including KPIs such as return on investment of IT department, spend vs. budget, IT cost breakdown and IT costs vs. revenues. Deliver and pitch your topic in the best possible manner with this Improved Digital Expenditure Determine IT Department Cost Management Dashboard Introduction PDF. Use them to share invaluable insights on Return Investment, Depreciation, Costs Break and impress your audience. This template can be altered and modified as per your expectations. So, grab it now.
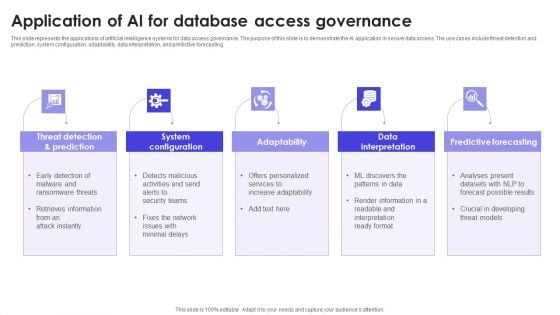
Application Of AI For Database Access Governance Summary PDF
This slide represents the applications of artificial intelligence systems for data access governance. The purpose of this slide is to demonstrate the AI application in secure data access. The use cases include threat detection and prediction, system configuration, adaptability, data interpretation, and predictive forecasting. Presenting Application Of AI For Database Access Governance Summary PDF to dispense important information. This template comprises five stages. It also presents valuable insights into the topics including Prediction, System Configuration, Adaptability. This is a completely customizable PowerPoint theme that can be put to use immediately. So, download it and address the topic impactfully.
Stock Photo Business Expansion Strategy Under Construction With Wrench And Screwdriver Icons Images
Your Capabilities Will Come To The Fore. Our stock photo business expansion strategy under construction with wrench and screwdriver icons images Give Them Extensive Coverage. Our construction Assist Accurate Forecasts. They Compel Fate To Go Your Way.
Stock Photo Business Growth Strategy How To Edit Web Page Image
Disregard Any Foreboding With Our stock photo business growth strategy how to edit web page image. They Ensure A Bright Forecast. Our construction Can Be Very Arousing. Develop On The Drive In Them To Excel.
Stock Photo Business Unit Strategy Every Sunrise Brings New Hope Images
Disregard any foreboding with our stock photo business unit strategy every sunrise brings new hope images. They ensure a bright forecast. Our nature can be very arousing. Develop on the drive in them to excel.
Stock Photo Business Plan Strategy Abstract Of Dna Structure Clipart Images
Your Capabilities Will Come To The Fore. Our stock photo business plan strategy abstract of dna structure clipart images Give Them Extensive Coverage. Our Science Assist Accurate Forecasts. They Compel Fate To Go Your Way.
Influencers Marketing Campaign Performance Tracking Dashboard Ppt PowerPoint Presentation Diagram Lists PDF
This slide covers performance monitoring dashboard of influencer based referral marketing program. It includes elements such as impressions on Instagram, likes, comments, clicks, sales generated along with value calculators and campaign breakdown based on gender and age. Formulating a presentation can take up a lot of effort and time, so the content and message should always be the primary focus. The visuals of the PowerPoint can enhance the presenters message, so our Influencers Marketing Campaign Performance Tracking Dashboard Ppt PowerPoint Presentation Diagram Lists PDF was created to help save time. Instead of worrying about the design, the presenter can concentrate on the message while our designers work on creating the ideal templates for whatever situation is needed. Slidegeeks has experts for everything from amazing designs to valuable content, we have put everything into Influencers Marketing Campaign Performance Tracking Dashboard Ppt PowerPoint Presentation Diagram Lists PDF
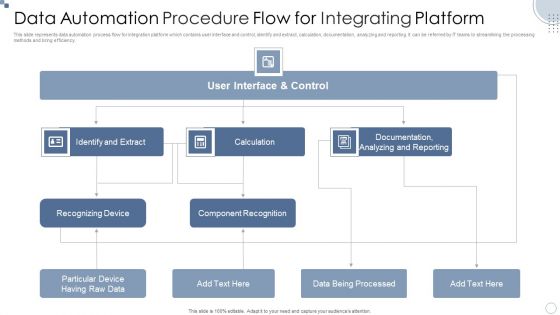
Data Automation Procedure Flow For Integrating Platform Ppt PowerPoint Presentation Infographic Template Vector PDF
This slide represents data automation process flow for integration platform which contains user interface and control, identify and extract, calculation, documentation, analyzing and reporting. It can be referred by IT teams to streamlining the processing methods and bring efficiency.Pitch your topic with ease and precision using this Data Automation Procedure Flow For Integrating Platform Ppt PowerPoint Presentation Infographic Template Vector PDF. This layout presents information on Recognizing Device, Component Recognition, Documentation Analyzing. It is also available for immediate download and adjustment. So, changes can be made in the color, design, graphics or any other component to create a unique layout.
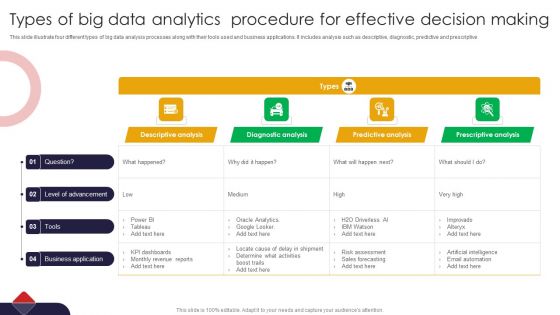
Types Of Big Data Analytics Procedure For Effective Decision Making Microsoft PDF
This slide illustrate four different types of big data analysis processes along with their tools used and business applications. It includes analysis such as descriptive, diagnostic, predictive and prescriptive Pitch your topic with ease and precision using this Types Of Big Data Analytics Procedure For Effective Decision Making Microsoft PDF. This layout presents information on Descriptive Analysis, Diagnostic Analysis, Predictive Analysis. It is also available for immediate download and adjustment. So, changes can be made in the color, design, graphics or any other component to create a unique layout.
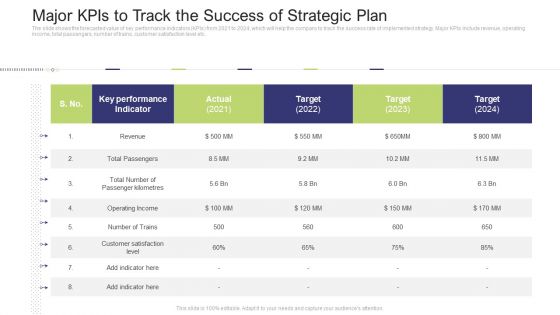
Major Kpis To Track The Success Of Strategic Plan Ideas PDF
The slide shows the forecasted value of key performance indicators KPIs from 2021 to 2024, which will help the company to track the success rate of implemented strategy. Major KPIs include revenue, operating income, total passengers, number of trains, customer satisfaction level etc.Deliver and pitch your topic in the best possible manner with this major kpis to track the success of strategic plan ideas pdf. Use them to share invaluable insights on key performance indicator, actual 2021 and impress your audience. This template can be altered and modified as per your expectations. So, grab it now.
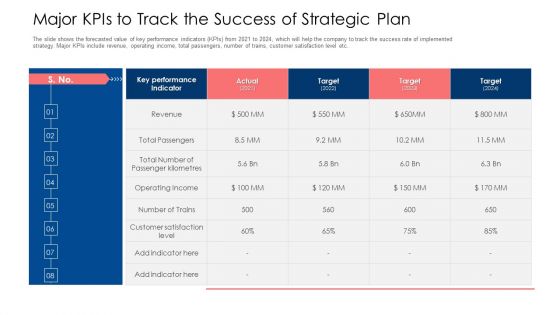
Major Kpis To Track The Success Of Strategic Plan Ppt Summary Influencers PDF
The slide shows the forecasted value of key performance indicators KPIs from 2021 to 2024, which will help the company to track the success rate of implemented strategy. Major KPIs include revenue, operating income, total passengers, number of trains, customer satisfaction level etc. Deliver an awe inspiring pitch with this creative major kpis to track the success of strategic plan ppt summary influencers pdf bundle. Topics like revenue, key performance indicator, target can be discussed with this completely editable template. It is available for immediate download depending on the needs and requirements of the user.
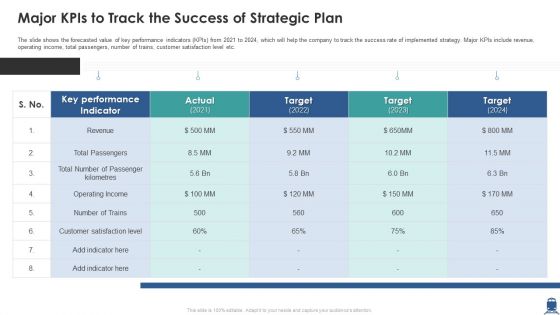
Major Kpis To Track The Success Of Strategic Plan Download PDF
The slide shows the forecasted value of key performance indicators KPIs from 2021 to 2024, which will help the company to track the success rate of implemented strategy. Major KPIs include revenue, operating income, total passengers, number of trains, customer satisfaction level etc. Deliver and pitch your topic in the best possible manner with this major kpis to track the success of strategic plan download pdf. Use them to share invaluable insights on revenue, key performance indicator, customer satisfaction level and impress your audience. This template can be altered and modified as per your expectations. So, grab it now.
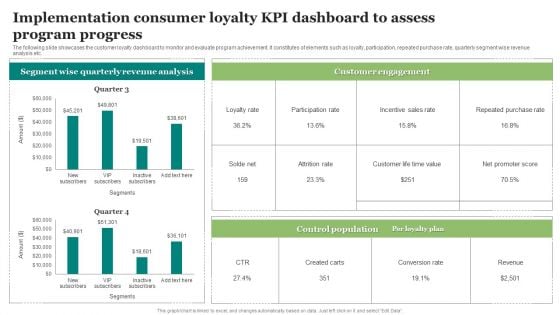
Implementation Consumer Loyalty KPI Dashboard To Assess Program Progress Guidelines PDF
The following slide illustrates the impact of executing artificial technology and machine learning in customer loyalty program. It includes elements such as predictive insights, prescriptive analytics, fraud prevention, intelligent interference etc. Showcasing this set of slides titled Implementation Consumer Loyalty KPI Dashboard To Assess Program Progress Guidelines PDF. The topics addressed in these templates are Implementation Consumer, Assess Program. All the content presented in this PPT design is completely editable. Download it and make adjustments in color, background, font etc. as per your unique business setting.
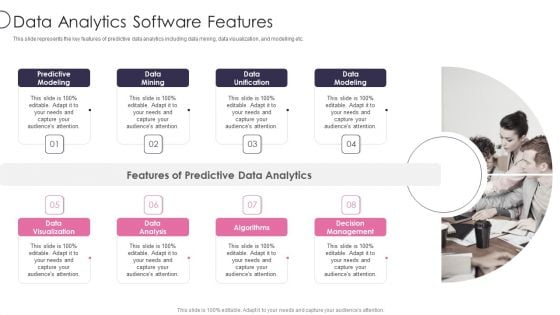
Information Transformation Process Toolkit Data Analytics Software Features Ideas PDF
This slide represents the key features of predictive data analytics including data mining, data visualization, and modelling etc. This is a Information Transformation Process Toolkit Data Analytics Software Features Ideas PDF template with various stages. Focus and dispense information on eight stages using this creative set, that comes with editable features. It contains large content boxes to add your information on topics like Algorithms, Decision Management, Data Analysis, Data Visualization. You can also showcase facts, figures, and other relevant content using this PPT layout. Grab it now.
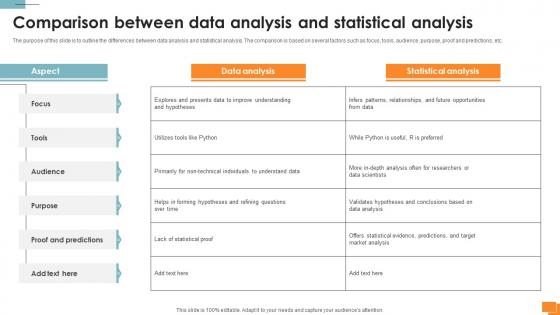
Statistical Tools For Evidence Comparison Between Data Analysis And Statistical Analysis
The purpose of this slide is to outline the differences between data analysis and statistical analysis. The comparison is based on several factors such as focus, tools, audience, purpose, proof and predictions, etc. Find highly impressive Statistical Tools For Evidence Comparison Between Data Analysis And Statistical Analysis on Slidegeeks to deliver a meaningful presentation. You can save an ample amount of time using these presentation templates. No need to worry to prepare everything from scratch because Slidegeeks experts have already done a huge research and work for you. You need to download Statistical Tools For Evidence Comparison Between Data Analysis And Statistical Analysis for your upcoming presentation. All the presentation templates are 100 percent editable and you can change the color and personalize the content accordingly. Download now The purpose of this slide is to outline the differences between data analysis and statistical analysis. The comparison is based on several factors such as focus, tools, audience, purpose, proof and predictions, etc.
Integration Of Digital Technology In Organization Business Transformation Dashboard Icons PDF
This slide covers transformation dashboard covering various stages of a business along with the budget and risks involved at every stage.Deliver and pitch your topic in the best possible manner with this Integration Of Digital Technology In Organization Business Transformation Dashboard Icons PDF Use them to share invaluable insights on Discovery Or Visioning, Resources Availability, Mobilization Of Resources and impress your audience. This template can be altered and modified as per your expectations. So, grab it now.
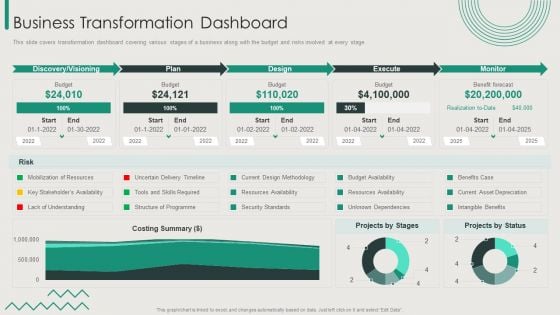
Organization Transition Business Transformation Dashboard Ppt PowerPoint Presentation Gallery Slide PDF
This slide covers transformation dashboard covering various stages of a business along with the budget and risks involved at every stage. Deliver an awe inspiring pitch with this creative Organization Transition Business Transformation Dashboard Ppt PowerPoint Presentation Gallery Slide PDF bundle. Topics like Plan, Design, Execute, Monitor can be discussed with this completely editable template. It is available for immediate download depending on the needs and requirements of the user.
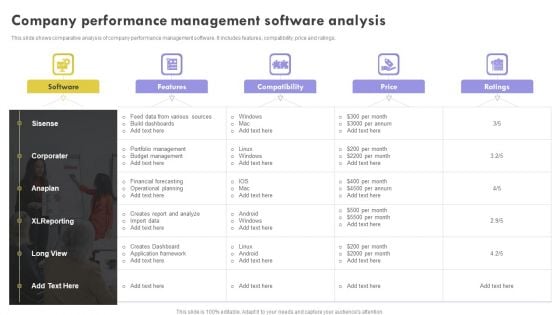
Company Performance Management Software Analysis Pictures PDF
This slide shows comparative analysis of company performance management software. It includes features, compatibility, price and ratings.Presenting Company Performance Management Software Analysis Pictures PDF to dispense important information. This template comprises one stages. It also presents valuable insights into the topics including Build dashboards, Financial forecasting, Operational planning. This is a completely customizable PowerPoint theme that can be put to use immediately. So, download it and address the topic impactfully.
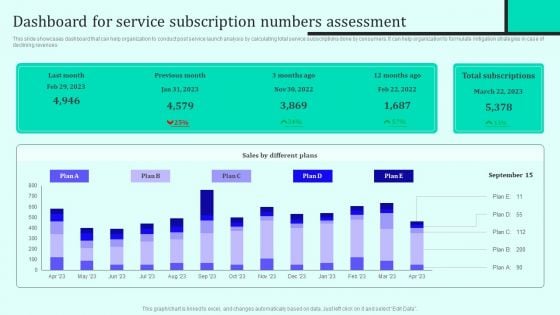
Implementing New Sales And Marketing Process For Services Dashboard For Service Subscription Diagrams PDF
This slide showcases dashboard that can help organization to conduct post service launch analysis by calculating total service subscriptions done by consumers. It can help organization to formulate mitigation strategies in case of declining revenues. Boost your pitch with our creative Implementing New Sales And Marketing Process For Services Dashboard For Service Subscription Diagrams PDF. Deliver an awe inspiring pitch that will mesmerize everyone. Using these presentation templates you will surely catch everyones attention. You can browse the ppts collection on our website. We have researchers who are experts at creating the right content for the templates. So you do not have to invest time in any additional work. Just grab the template now and use them.
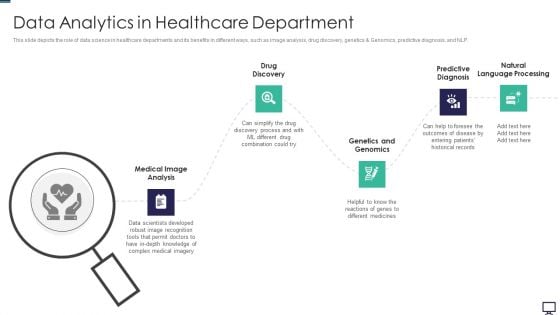
Data Analytics In Healthcare Department Ppt Outline Demonstration
This slide depicts the role of data science in healthcare departments and its benefits in different ways, such as image analysis, drug discovery, genetics and Genomics, predictive diagnosis, and NLP. Presenting data analytics in healthcare department ppt outline demonstration to provide visual cues and insights. Share and navigate important information on five stages that need your due attention. This template can be used to pitch topics like data analytics in healthcare department. In addtion, this PPT design contains high resolution images, graphics, etc, that are easily editable and available for immediate download.
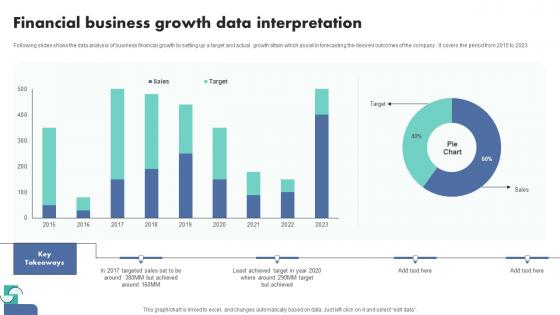
Financial Business Growth Data Interpretation Themes Pdf
Following slides shows the data analysis of business financial growth by setting up a target and actual growth attain which assist in forecasting the desired outcomes of the company . It covers the period from 2015 to 2023.Pitch your topic with ease and precision using this Financial Business Growth Data Interpretation Themes Pdf This layout presents information on Financial Business, Growth Data Interpretation It is also available for immediate download and adjustment. So, changes can be made in the color, design, graphics or any other component to create a unique layout. Following slides shows the data analysis of business financial growth by setting up a target and actual growth attain which assist in forecasting the desired outcomes of the company . It covers the period from 2015 to 2023.
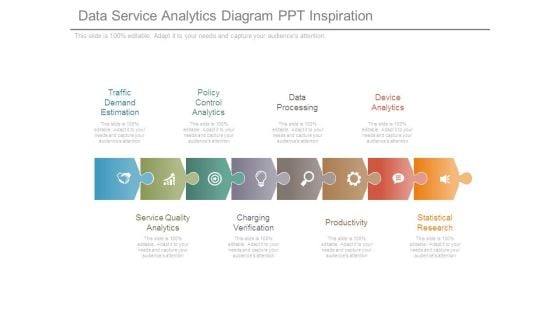
Data Service Analytics Diagram Ppt Inspiration
This is a data service analytics diagram ppt inspiration. This is a eight stage process. The stages in this process are traffic demand estimation, policy control analytics, data processing, device analytics, service quality analytics, charging verification, productivity, statistical research.
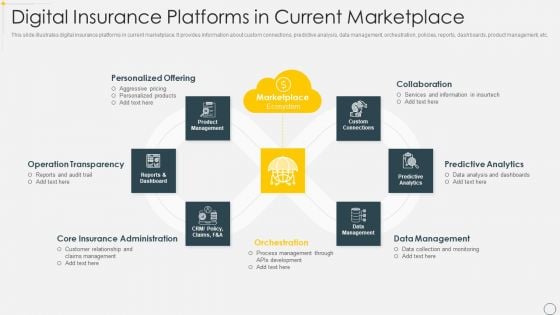
Digital Insurance Platforms In Current Marketplace Slides PDF
This slide illustrates digital insurance platforms in current marketplace. It provides information about custom connections, predictive analysis, data management, orchestration, policies, reports, dashboards, product management, etc. Persuade your audience using this Digital Insurance Platforms In Current Marketplace Slides PDF. This PPT design covers seven stages, thus making it a great tool to use. It also caters to a variety of topics including Operation Transparency, Personalized Offering, Data Management. Download this PPT design now to present a convincing pitch that not only emphasizes the topic but also showcases your presentation skills.
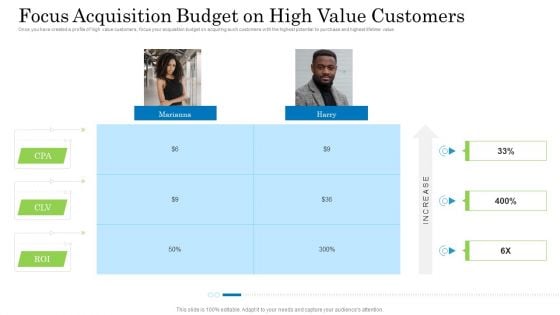
Customer Behavioral Data And Analytics Focus Acquisition Budget On High Value Customers Infographics PDF
Once you have created a profile of high value customers, focus your acquisition budget on acquiring such customers with the highest potential to purchase and highest lifetime value. Presenting customer behavioral data and analytics focus acquisition budget on high value customers infographics pdf to provide visual cues and insights. Share and navigate important information on two stages that need your due attention. This template can be used to pitch topics like focus acquisition budget on high value customers. In addtion, this PPT design contains high resolution images, graphics, etc, that are easily editable and available for immediate download.
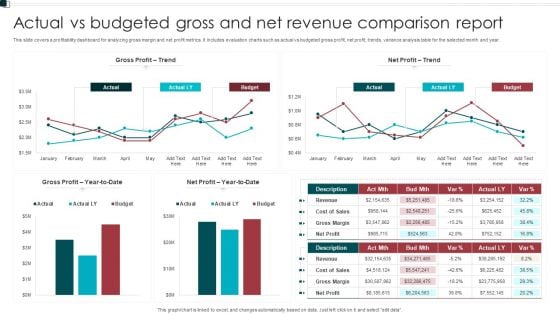
Actual Vs Budgeted Gross And Net Revenue Comparison Report Sample PDF
This slide covers a profitability dashboard for analyzing gross margin and net profit metrics. It includes evaluation charts such as actual vs budgeted gross profit, net profit, trends, variance analysis table for the selected month and year. Pitch your topic with ease and precision using this Actual Vs Budgeted Gross And Net Revenue Comparison Report Sample PDF. This layout presents information on Gross Profit, Net Profit, Budget. It is also available for immediate download and adjustment. So, changes can be made in the color, design, graphics or any other component to create a unique layout.
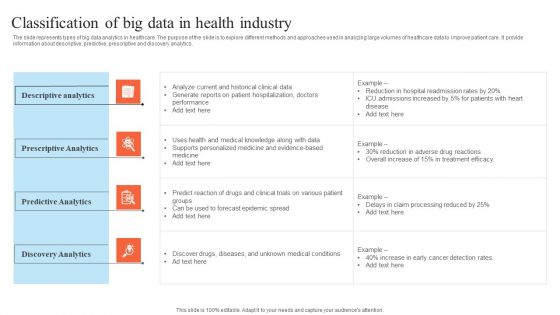
Classification Of Big Data In Health Industry Microsoft PDF
The slide represents types of big data analytics in healthcare. The purpose of the slide is to explore different methods and approaches used in analyzing large volumes of healthcare data to improve patient care. It provide information about descriptive, predictive, prescriptive and discovery analytics. Presenting Classification Of Big Data In Health Industry Microsoft PDF to dispense important information. This template comprises four stages. It also presents valuable insights into the topics including Descriptive Analytics, Prescriptive Analytics, Predictive Analytics. This is a completely customizable PowerPoint theme that can be put to use immediately. So, download it and address the topic impactfully.
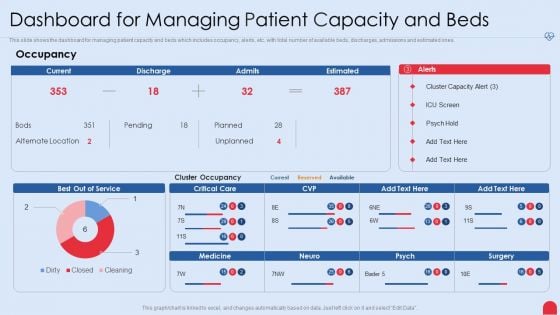
Enhancing Hospital Software System Dashboard For Managing Patient Capacity And Beds Brochure PDF
This slide shows the dashboard for managing patient capacity and beds which includes occupancy, alerts, etc, with total number of available beds, discharges, admissions and estimated ones. Deliver and pitch your topic in the best possible manner with this enhancing hospital software system dashboard for managing patient capacity and beds brochure pdf. Use them to share invaluable insights on dashboard for managing patient capacity and beds and impress your audience. This template can be altered and modified as per your expectations. So, grab it now.
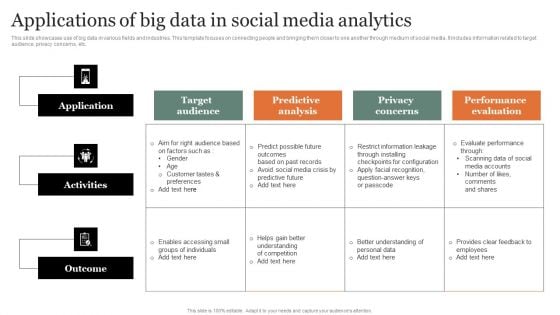
Applications Of Big Data In Social Media Analytics Graphics PDF
This slide showcases use of big data in various fields and industries. This template focuses on connecting people and bringing them closer to one another through medium of social media. It includes information related to target audience, privacy concerns, etc. Showcasing this set of slides titled Applications Of Big Data In Social Media Analytics Graphics PDF Brochure. The topics addressed in these templates are Target Audience, Predictive Analysis, Performance Evaluation. All the content presented in this PPT design is completely editable. Download it and make adjustments in color, background, font etc. as per your unique business setting.
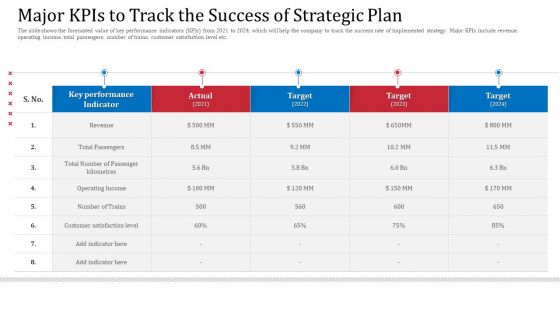
Major Kpis To Track The Success Of Strategic Plan Designs PDF
The slide shows the forecasted value of key performance indicators KPIs from 2021 to 2024, which will help the company to track the success rate of implemented strategy. Major KPIs include revenue, operating income, total passengers, number of trains, customer satisfaction level etc.Deliver an awe inspiring pitch with this creative major kpis to track the success of strategic plan designs pdf bundle. Topics like total passengers, operating income, performance indicator can be discussed with this completely editable template. It is available for immediate download depending on the needs and requirements of the user.
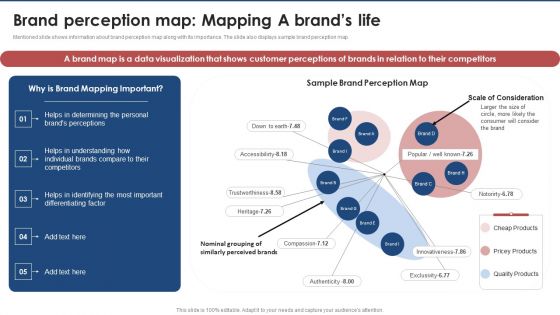
Brand Perception Map Mapping A Brands Life Brand Value Estimation Guide Formats PDF
Mentioned slide displays overview about brand health covering its definition along with key performance metrics such as net promoter score, customer satisfaction score and share of voice. Slidegeeks is here to make your presentations a breeze with Brand Perception Map Mapping A Brands Life Brand Value Estimation Guide Formats PDF With our easy-to-use and customizable templates, you can focus on delivering your ideas rather than worrying about formatting. With a variety of designs to choose from, you are sure to find one that suits your needs. And with animations and unique photos, illustrations, and fonts, you can make your presentation pop. So whether you are giving a sales pitch or presenting to the board, make sure to check out Slidegeeks first.


 Continue with Email

 Home
Home


