Purchasing Dashboard
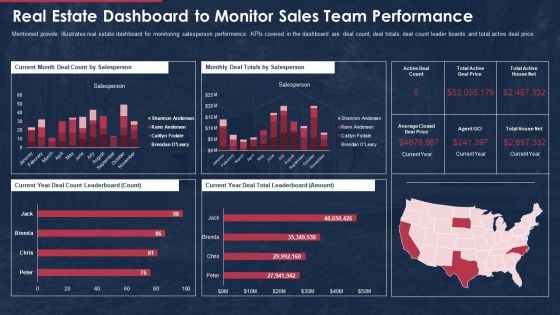
Building Promotional Campaign Real Estate Sales Real Estate Dashboard To Monitor Sales Team Performance Guidelines PDF
This slide portrays property management dashboard with KPIs namely, average days on market, properties for sale, properties for rent, sales vs. target and sales by region. Deliver and pitch your topic in the best possible manner with this building promotional campaign real estate sales real estate dashboard to monitor sales team performance guidelines pdf. Use them to share invaluable insights on property management kpi dashboard and impress your audience. This template can be altered and modified as per your expectations. So, grab it now.

New Product Sales Strategy And Marketing KPI Dashboard To Monitor Sales Performance Information PDF
This slide shows sales performance monitoring dashboard. Metrics included in the dashboard are sales revenue, sales growth, average revenue per unit, customer lifetime value and customer acquisition cost. Deliver an awe inspiring pitch with this creative New Product Sales Strategy And Marketing KPI Dashboard To Monitor Sales Performance Information PDF bundle. Topics like Sales Revenue, Monthly Sales Growth, Sales Country Performance can be discussed with this completely editable template. It is available for immediate download depending on the needs and requirements of the user.
Business To Business Sales Playbook Sales Management Activities Tracking Dashboard Icons PDF
This slide provides information regarding sales management activities tracking dashboard to measure closed business, sales pipeline, sales activity by sales rep, month over month growth, forecast by month, etc. Deliver and pitch your topic in the best possible manner with this business to business sales playbook sales management activities tracking dashboard icons pdf. Use them to share invaluable insights on sales management activities tracking dashboard and impress your audience. This template can be altered and modified as per your expectations. So, grab it now.
Key Practices To Create Sales Playbook Sales Management Activities Tracking Dashboard Mockup PDF
This slide provides information regarding sales management activities tracking dashboard to measure closed business, sales pipeline, sales activity by sales rep, month over month growth, forecast by month, etc. Deliver and pitch your topic in the best possible manner with this key practices to create sales playbook sales management activities tracking dashboard mockup pdf Use them to share invaluable insights on sales management activities tracking dashboard and impress your audience. This template can be altered and modified as per your expectations. So, grab it now.

Product Procurement Management Dashboard With Defect Rate Supplier Availability And Lead Time Pictures PDF
This slide shows a dashboard of procurement to provide real time information about various components. It includes defect rate, on time supplies , supplier availability and lead time. Showcasing this set of slides titled Product Procurement Management Dashboard With Defect Rate Supplier Availability And Lead Time Pictures PDF. The topics addressed in these templates are Supplier Defect Rate, Supplier Availability, Lead Time. All the content presented in this PPT design is completely editable. Download it and make adjustments in color, background, font etc. as per your unique business setting.
Tracking Sales Pipeline And Lead Activity Dashboard Managing Sales Pipeline Health Professional PDF
This slide covers information regarding dashboard associated to tracking lead activity across sales pipeline. Explore a selection of the finest Tracking Sales Pipeline And Lead Activity Dashboard Managing Sales Pipeline Health Professional PDF here. With a plethora of professionally designed and pre-made slide templates, you can quickly and easily find the right one for your upcoming presentation. You can use our Tracking Sales Pipeline And Lead Activity Dashboard Managing Sales Pipeline Health Professional PDF to effectively convey your message to a wider audience. Slidegeeks has done a lot of research before preparing these presentation templates. The content can be personalized and the slides are highly editable. Grab templates today from Slidegeeks.
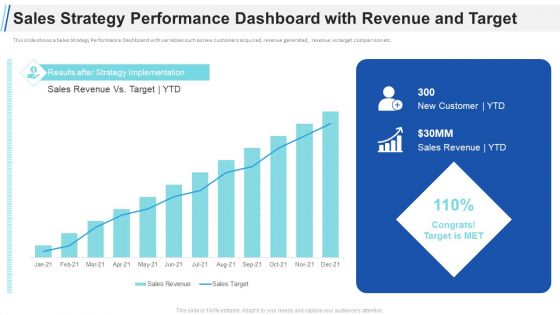
Maximizing Profitability Earning Through Sales Initiatives Sales Strategy Performance Dashboard With Revenue And Target Elements PDF
This slide shows a Sales Strategy Performance Dashboard with variables such as new customers acquired, revenue generated, revenue vs target comparison etc. Deliver and pitch your topic in the best possible manner with this maximizing profitability earning through sales initiatives sales strategy performance dashboard with revenue and target elements pdf. Use them to share invaluable insights on sales strategy performance dashboard with revenue and target and impress your audience. This template can be altered and modified as per your expectations. So, grab it now.
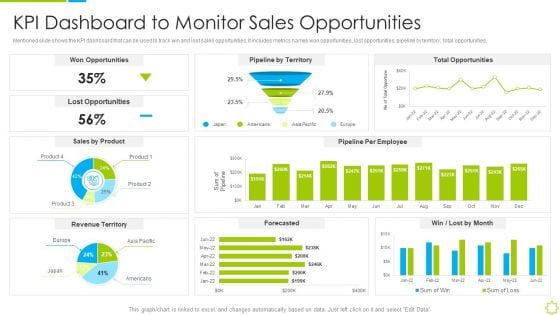
Launch New Sales Enablement Program Lead Generation KPI Dashboard To Monitor Sales Topics PDF
Mentioned slide shows the KPI dashboard that can be used to track win and lost sales opportunities. It includes metrics namely won opportunities, lost opportunities, pipeline by territory, total opportunities. Deliver and pitch your topic in the best possible manner with this launch new sales enablement program lead generation kpi dashboard to monitor sales topics pdf. Use them to share invaluable insights on kpi dashboard to monitor sales opportunities and impress your audience. This template can be altered and modified as per your expectations. So, grab it now.
Customer Deal Tracking In Sales Pipeline Dashboard Improving Distribution Channel Ideas PDF
This slide covers information regarding dashboard for tracking various customer deals in sales pipeline. This is a Customer Deal Tracking In Sales Pipeline Dashboard Improving Distribution Channel Ideas PDF template with various stages. Focus and dispense information on three stages using this creative set, that comes with editable features. It contains large content boxes to add your information on topics like Proposal Sent, Terms Accepted, Customer Conversion. You can also showcase facts, figures, and other relevant content using this PPT layout. Grab it now.
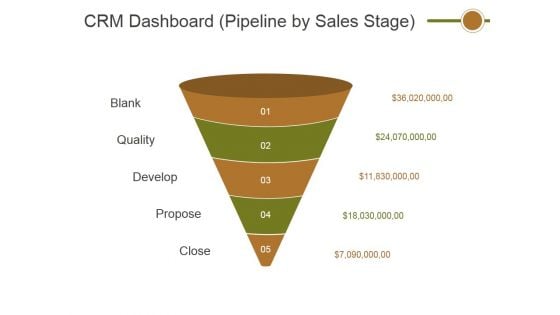
Crm Dashboard Pipeline By Sales Stage Ppt PowerPoint Presentation Outline Outfit
This is a crm dashboard pipeline by sales stage ppt powerpoint presentation outline outfit. This is a five stage process. The stages in this process are blank, quality, develop, propose, close.
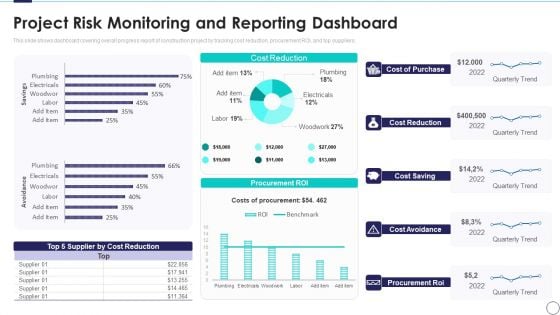
Risk Assessment And Mitigation Plan Project Risk Monitoring And Reporting Dashboard Ppt Inspiration PDF
This slide shows dashboard covering overall progress report of construction project by tracking cost reduction, procurement ROI, and top suppliers. Deliver an awe inspiring pitch with this creative risk assessment and mitigation plan project risk monitoring and reporting dashboard ppt inspiration pdf bundle. Topics like cost reduction, cost saving, cost avoidance, procurement roi can be discussed with this completely editable template. It is available for immediate download depending on the needs and requirements of the user.
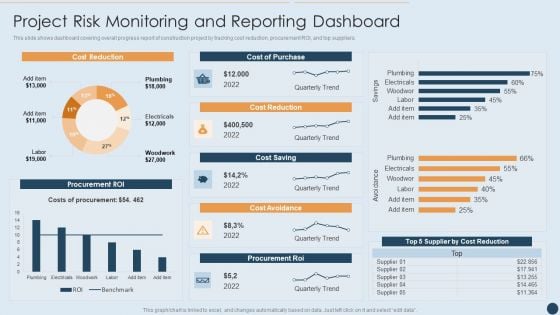
Commercial Real Estate Project Risk Management Project Risk Monitoring And Reporting Dashboard Formats PDF
This slide shows dashboard covering overall progress report of construction project by tracking cost reduction, procurement ROI, and top suppliers. Deliver an awe inspiring pitch with this creative Commercial Real Estate Project Risk Management Project Risk Monitoring And Reporting Dashboard Formats PDF bundle. Topics like Cost Reduction, Procurement Roi, Cost Avoidance can be discussed with this completely editable template. It is available for immediate download depending on the needs and requirements of the user.

Product Sales Report Dashboard For Profit Margin Analysis Ppt PowerPoint Presentation Ideas Slide Portrait
This is a product sales report dashboard for profit margin analysis ppt powerpoint presentation ideas slide portrait. This is a four stage process. The stages in this process are business analytics, ba, organizations data.
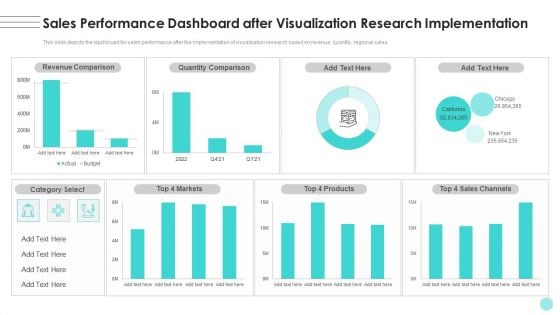
Branches For Visualization Research And Development Sales Performance Dashboard After Infographics PDF
This slide depicts the dashboard for sales performance after the implementation of visualization research based on revenue, quantity, regional sales. Crafting an eye-catching presentation has never been more straightforward. Let your presentation shine with this tasteful yet straightforward Branches For Visualization Research And Development Sales Performance Dashboard After Infographics PDF template. It offers a minimalistic and classy look that is great for making a statement. The colors have been employed intelligently to add a bit of playfulness while still remaining professional. Construct the ideal Branches For Visualization Research And Development Sales Performance Dashboard After Infographics PDF that effortlessly grabs the attention of your audience Begin now and be certain to wow your customers.
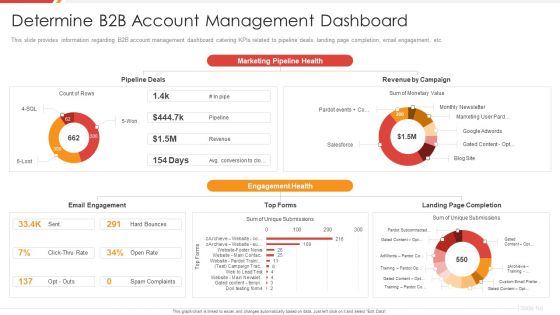
Enhancing B2B Demand Creation And Sales Growth Determine B2B Account Management Dashboard Template PDF
This slide provides information regarding B2B account management dashboard catering KPIs related to pipeline deals, landing page completion, email engagement, etc. Deliver and pitch your topic in the best possible manner with this enhancing b2b demand creation and sales growth determine b2b account management dashboard template pdf. Use them to share invaluable insights on pipeline deals, email engagement, revenue by campaign, landing page completion and impress your audience. This template can be altered and modified as per your expectations. So, grab it now.
Monthly Sales Reporting And Projections Dashboard Icon Ppt Icon Clipart Images PDF
Persuade your audience using this Monthly Sales Reporting And Projections Dashboard Icon Ppt Icon Clipart Images PDF. This PPT design covers three stages, thus making it a great tool to use. It also caters to a variety of topics including Monthly Sale,s Reporting And Projections, Dashboard Icon. Download this PPT design now to present a convincing pitch that not only emphasizes the topic but also showcases your presentation skills.
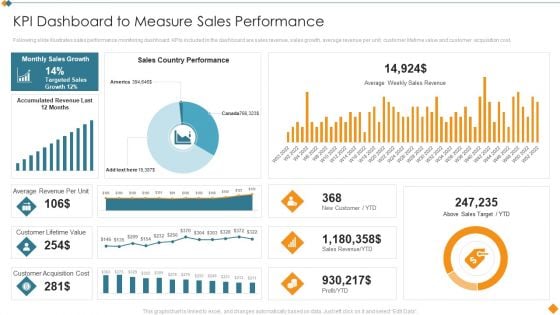
Maintaining Partner Relationships KPI Dashboard To Measure Sales Performance Rules PDF
Following slide illustrates sales performance monitoring dashboard. KPIs included in the dashboard are sales revenue, sales growth, average revenue per unit, customer lifetime value and customer acquisition cost. Deliver and pitch your topic in the best possible manner with this Maintaining Partner Relationships KPI Dashboard To Measure Sales Performance Rules PDF. Use them to share invaluable insights on Sales Country Performance, Above Sales Target, YTD, Customer Lifetime Value, Customer Acquisition Cost and impress your audience. This template can be altered and modified as per your expectations. So, grab it now.
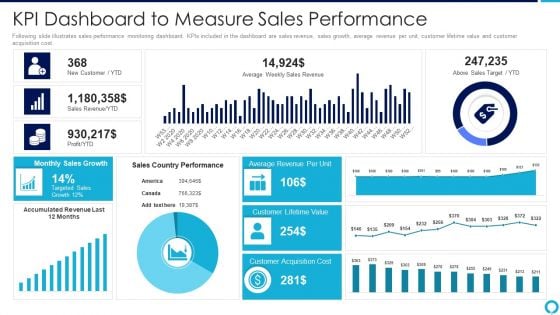
Partnership Management Strategies Kpi Dashboard To Measure Sales Performance Introduction PDF
Following slide illustrates sales performance monitoring dashboard. KPIs included in the dashboard are sales revenue, sales growth, average revenue per unit, customer lifetime value and customer acquisition cost.Deliver and pitch your topic in the best possible manner with this partnership management strategies kpi dashboard to measure sales performance introduction pdf Use them to share invaluable insights on average revenue, monthly sales growth, customer acquisition cost and impress your audience. This template can be altered and modified as per your expectations. So, grab it now.
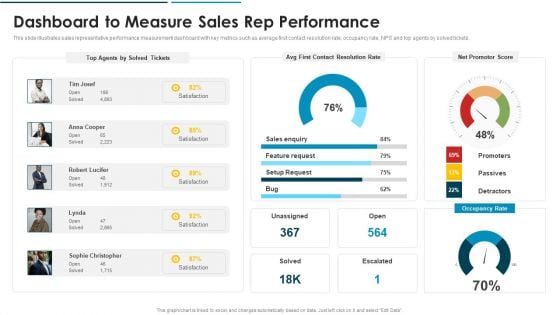
Go To Market Approach For New Product Dashboard To Measure Sales Rep Performance Formats PDF
This slide illustrates sales representative performance measurement dashboard with key metrics such as average first contact resolution rate, occupancy rate, NPS and top agents by solved tickets.Deliver and pitch your topic in the best possible manner with this Go To Market Approach For New Product Dashboard To Measure Sales Rep Performance Formats PDF Use them to share invaluable insights on Dashboard To Measure Sales Rep Performance and impress your audience. This template can be altered and modified as per your expectations. So, grab it now.
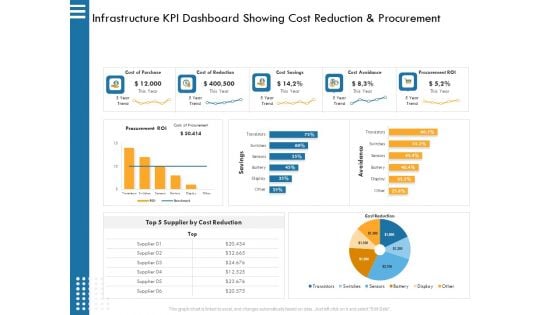
IT Infrastructure Governance Infrastructure KPI Dashboard Showing Cost Reduction And Procurement Ppt Infographics Picture PDF
Deliver an awe inspiring pitch with this creative it infrastructure governance infrastructure kpi dashboard showing cost reduction and procurement ppt infographics picture pdf. bundle. Topics like supplier, cost, reduction, procurement, avoidance. can be discussed with this completely editable template. It is available for immediate download depending on the needs and requirements of the user.
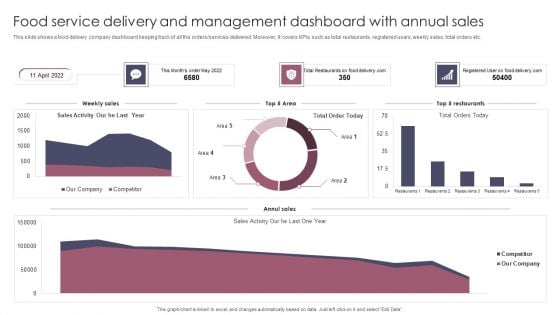
Food Service Delivery And Management Dashboard With Annual Sales Brochure PDF
This slide shows a food delivery company dashboard keeping track of all the orders or services delivered. Moreover, it covers KPIs such as total restaurants, registered users, weekly sales, total orders etc. Showcasing this set of slides titled Food Service Delivery And Management Dashboard With Annual Sales Brochure PDF. The topics addressed in these templates are Food Service Delivery, Management Dashboard, Annual Sales. All the content presented in this PPT design is completely editable. Download it and make adjustments in color, background, font etc. as per your unique business setting.

KPI Dashboard Showing Results Of Sales And Marketing Project Campaign Formats PDF
Following slide showcases performance KPI dashboard used to evaluate marketing project campaign results. The dashboard provides overview of key metrics such as total revenue, marketing spend, profit and cost per acquisition, leads etc. Showcasing this set of slides titled KPI Dashboard Showing Results Of Sales And Marketing Project Campaign Formats PDF. The topics addressed in these templates are Marketing Spend, Revenue, Profit Per Acquisition. All the content presented in this PPT design is completely editable. Download it and make adjustments in color, background, font etc. as per your unique business setting.
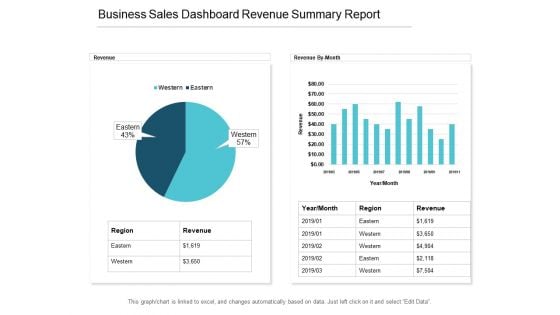
Business Sales Dashboard Revenue Summary Report Ppt PowerPoint Presentation Pictures Structure
This is a business sales dashboard revenue summary report ppt powerpoint presentation pictures structure. This is a two stage process. The stages in this process are business analytics, ba, organizations data.
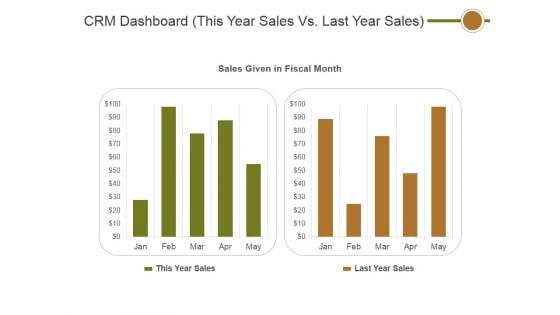
Crm Dashboard This Year Sales Vs Last Year Sales Ppt PowerPoint Presentation Layouts Outline
This is a crm dashboard this year sales vs last year sales ppt powerpoint presentation layouts outline. This is a two stage process. The stages in this process are sales given in fiscal month, this year sales, last year sales.
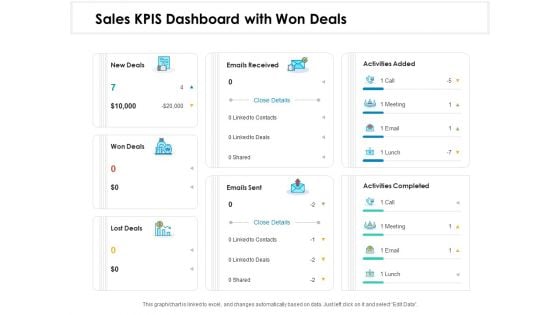
Sales KPIS Dashboard With Won Deals Ppt PowerPoint Presentation Styles Templates PDF
Presenting this set of slides with name sales kpis dashboard with won deals ppt powerpoint presentation styles templates pdf. This is a seven stage process. The stages in this process are new deals, won deals, lost deals, emails received, emails sent, activities added, activities completed. This is a completely editable PowerPoint presentation and is available for immediate download. Download now and impress your audience.
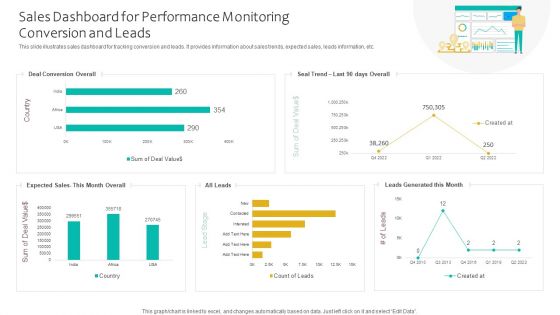
Sales Dashboard For Performance Monitoring Conversion And Leads Ppt Infographics Smartart PDF
This slide illustrates sales dashboard for tracking conversion and leads. It provides information about sales trends, expected sales, leads information, etc. Showcasing this set of slides titled Sales Dashboard For Performance Monitoring Conversion And Leads Ppt Infographics Smartart PDF. The topics addressed in these templates are Deal Conversion Overall, Expected Sales, Leads Generated. All the content presented in this PPT design is completely editable. Download it and make adjustments in color, background, font etc. as per your unique business setting.

Crm Dashboard This Year Sales Vs Last Year Sales Ppt PowerPoint Presentation Information
This is a crm dashboard this year sales vs last year sales ppt powerpoint presentation information. This is a five stage process. The stages in this process are this year sales and last year sales by given in fiscal month.
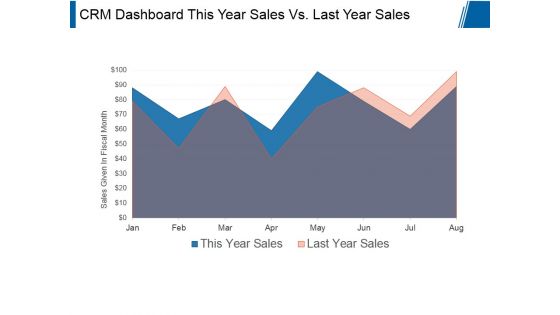
Crm Dashboard This Year Sales Vs Last Year Sales Ppt PowerPoint Presentation Styles
This is a crm dashboard this year sales vs last year sales ppt powerpoint presentation styles. This is a two stage process. The stages in this process are sales given in fiscal month, business, marketing, presentation, growth.
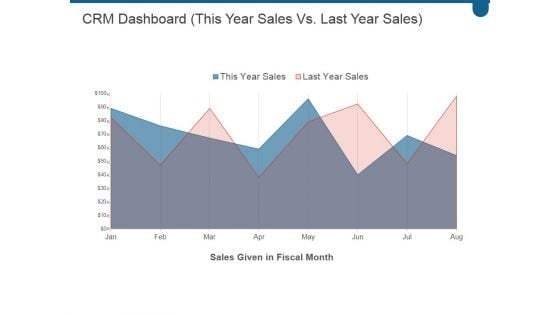
Crm Dashboard This Year Sales Vs Last Year Sales Ppt PowerPoint Presentation Deck
This is a crm dashboard this year sales vs last year sales ppt powerpoint presentation deck. This is a two stage process. The stages in this process are business, marketing, success, growth, finance.
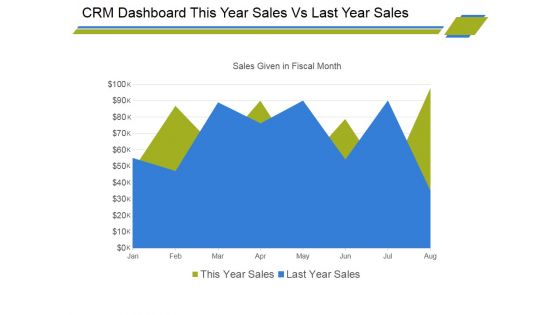
Crm Dashboard This Year Sales Vs Last Year Sales Ppt PowerPoint Presentation Professional Display
This is a crm dashboard this year sales vs last year sales ppt powerpoint presentation professional display. This is a two stage process. The stages in this process are area chart, growth, management, marketing, business, strategy.
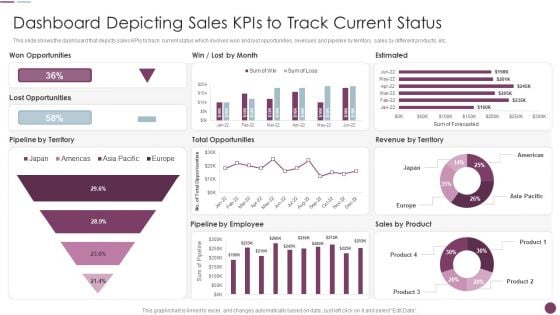
Sales Automation Procedure Dashboard Depicting Sales Kpis To Track Current Status Sample PDF
This slide shows the dashboard that depicts sales KPIs to track current status which involves won and lost opportunities, revenues and pipeline by territory, sales by different products, etc. Deliver an awe inspiring pitch with this creative Sales Automation Procedure Dashboard Depicting Sales Kpis To Track Current Status Sample PDF bundle. Topics like Estimated, Pipeline Employee, Pipeline Territory can be discussed with this completely editable template. It is available for immediate download depending on the needs and requirements of the user.
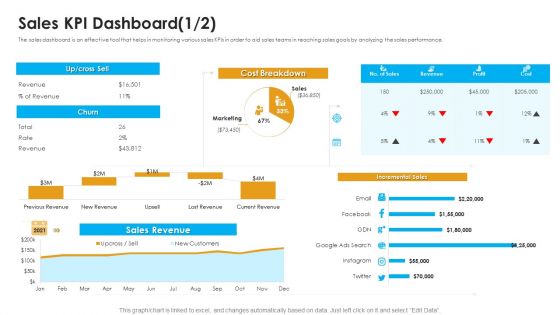
Sales Assistance Boost Overall Efficiency Sales KPI Dashboard Ppt Pictures File Formats PDF
The sales dashboard is an effective tool that helps in monitoring various sales KPIs in order to aid sales teams in reaching sales goals by analyzing the sales performance. Deliver an awe-inspiring pitch with this creative sales assistance boost overall efficiency sales kpi dashboard ppt pictures file formats pdf bundle. Topics like sales revenue, cost breakdown, incremental sales can be discussed with this completely editable template. It is available for immediate download depending on the needs and requirements of the user.
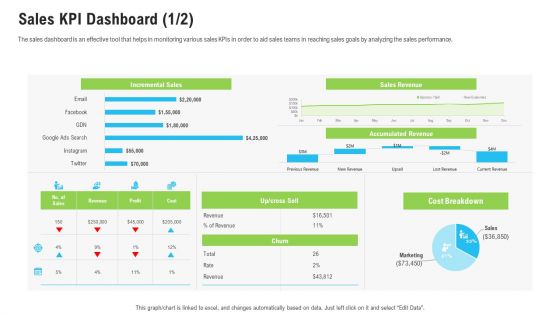
Sales Department Strategies Increase Revenues Sales KPI Dashboard Email Ppt Outline Microsoft PDF
The sales dashboard is an effective tool that helps in monitoring various sales KPIs in order to aid sales teams in reaching sales goals by analyzing the sales performance. Deliver an awe-inspiring pitch with this creative sales department strategies increase revenues sales kpi dashboard email ppt outline microsoft pdf bundle. Topics like sales revenue, cost breakdown, marketing can be discussed with this completely editable template. It is available for immediate download depending on the needs and requirements of the user.
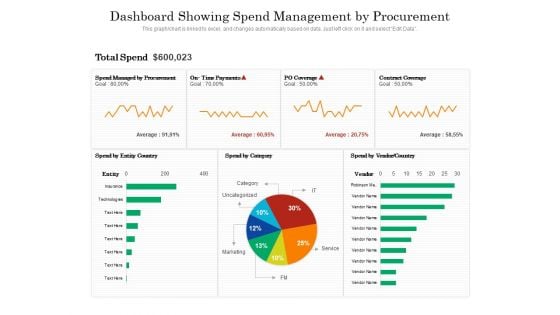
Dashboard Showing Spend Management By Procurement Ppt PowerPoint Presentation Gallery Display PDF
Presenting this set of slides with name dashboard showing spend management by procurement ppt powerpoint presentation gallery display pdf. The topics discussed in these slides are procurement, marketing, service. This is a completely editable PowerPoint presentation and is available for immediate download. Download now and impress your audience.
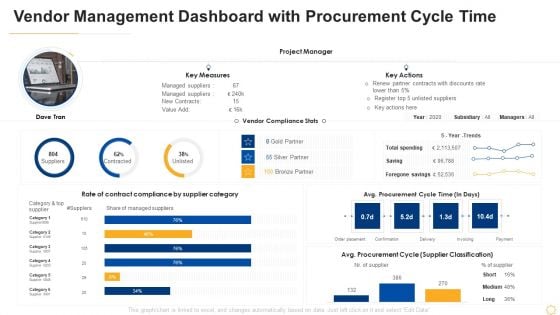
Successful Vendor Management Approaches To Boost Procurement Efficiency Vendor Management Dashboard Themes PDF
Deliver an awe inspiring pitch with this creative successful vendor management approaches to boost procurement efficiency vendor management dashboard themes pdf bundle. Topics like measures, procurement, invoicing, payment can be discussed with this completely editable template. It is available for immediate download depending on the needs and requirements of the user.
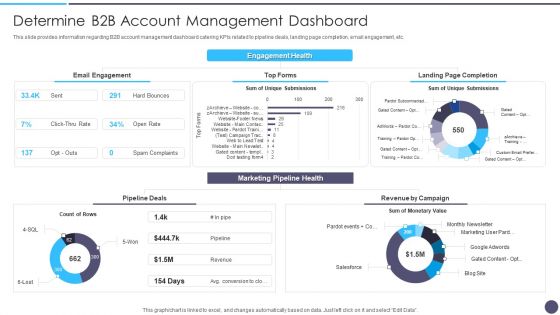
Defined Sales Assistance For Business Clients Determine B2B Account Management Dashboard Summary PDF
This slide provides information regarding B2B account management dashboard catering KPIs related to pipeline deals, landing page completion, email engagement, etc. Deliver an awe inspiring pitch with this creative Defined Sales Assistance For Business Clients Determine B2B Account Management Dashboard Summary PDF bundle. Topics like Marketing Pipeline Health, Engagement Health, Landing Page Completion can be discussed with this completely editable template. It is available for immediate download depending on the needs and requirements of the user.
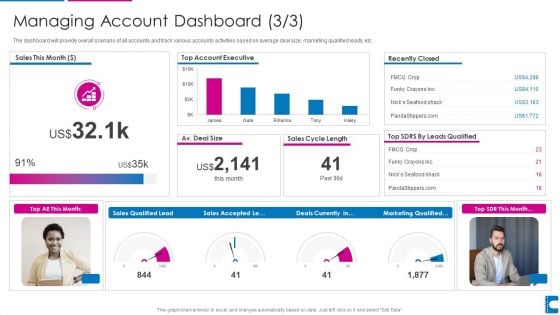
How To Administer Accounts To Increase Sales Revenue Managing Account Dashboard Executive Infographics PDF
The dashboard will provide overall scenario of all accounts and track various accounts activities based on average deal size, marketing qualified leads, etc. Deliver and pitch your topic in the best possible manner with this how to administer accounts to increase sales revenue managing account dashboard executive infographics pdf. Use them to share invaluable insights on account executive, sales, marketing and impress your audience. This template can be altered and modified as per your expectations. So, grab it now.
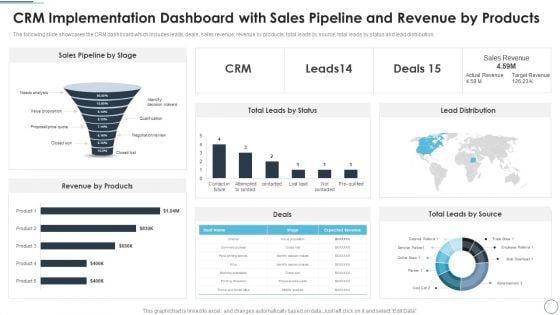
CRM Implementation Dashboard With Sales Pipeline And Revenue By Products Mockup PDF
The following slide showcases the CRM dashboard which includes leads, deals, sales revenue, revenue by products, total leads by source, total leads by status and lead distribution.Deliver an awe inspiring pitch with this creative CRM Implementation Dashboard With Sales Pipeline And Revenue By Products Mockup PDF bundle. Topics like Lead Distribution, Revenue By Products, Total Leads can be discussed with this completely editable template. It is available for immediate download depending on the needs and requirements of the user.
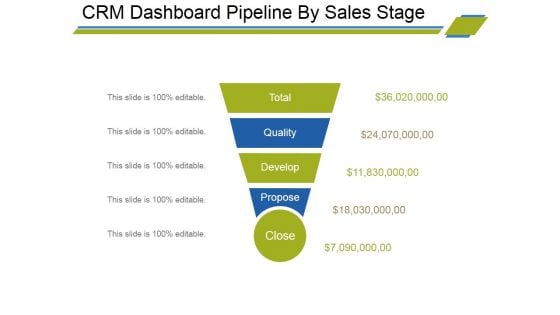
Crm Dashboard Pipeline By Sales Stage Ppt PowerPoint Presentation Infographic Template Slides
This is a crm dashboard pipeline by sales stage ppt powerpoint presentation infographic template slides. This is a five stage process. The stages in this process are total, quality, develop, propose, close.
Sales Funnel Management For Revenue Generation Tracking Customer Sales Funnel Dashboard Information PDF
This slide covers information regarding the customer sales funnel tracking with sales volume and total market. Deliver an awe inspiring pitch with this creative sales funnel management for revenue generation tracking customer sales funnel dashboard information pdf bundle. Topics like tracking customer sales funnel dashboard can be discussed with this completely editable template. It is available for immediate download depending on the needs and requirements of the user.
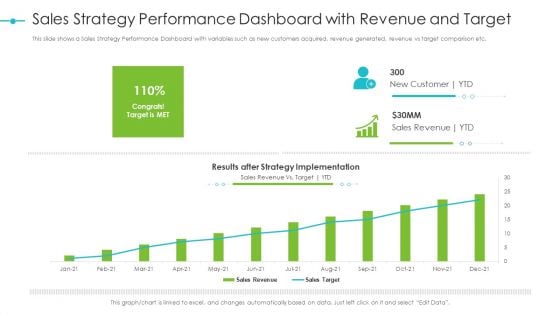
Tools For Improving Sales Plan Effectiveness Sales Strategy Performance Dashboard With Revenue And Target Professional PDF
This slide shows a Sales Strategy Performance Dashboard with variables such as new customers acquired, revenue generated, revenue vs target comparison etc. Deliver and pitch your topic in the best possible manner with this tools for improving sales plan effectiveness sales strategy performance dashboard with revenue and target professional pdf. Use them to share invaluable insights on sales, revenue, target and impress your audience. This template can be altered and modified as per your expectations. So, grab it now.
B2B Sales Techniques Playbook B2B Sales Representatives Performance Tracking Dashboard Diagrams PDF
This slide provides information regarding B2B sales representatives performance tracking dashboard to measure leads by region, revenue breakdown, top performers by leads, revenues, etc. Deliver and pitch your topic in the best possible manner with this B2B Sales Techniques Playbook B2B Sales Representatives Performance Tracking Dashboard Diagrams PDF. Use them to share invaluable insights on Combine Sales, Individual Performance, Achieved Highest and impress your audience. This template can be altered and modified as per your expectations. So, grab it now.

Procurement Dashboard With Top Savings Opportunities Ppt PowerPoint Presentation Gallery Graphics Pictures PDF
Presenting this set of slides with name procurement dashboard with top savings opportunities ppt powerpoint presentation gallery graphics pictures pdf. The topics discussed in these slides are opportunities, price, supplier. This is a completely editable PowerPoint presentation and is available for immediate download. Download now and impress your audience.
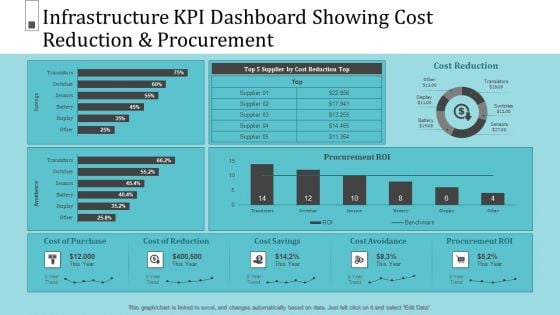
Infrastructure Project Management In Construction KPI Dashboard Showing Cost Reduction And Procurement Introduction PDF
Deliver and pitch your topic in the best possible manner with this infrastructure project management in construction kpi dashboard showing cost reduction and procurement introduction pdf. Use them to share invaluable insights on cost reduction, transistors, sensors, supplier and impress your audience. This template can be altered and modified as per your expectations. So, grab it now.
Vendor Management Dashboard With Procurement Cycle Time Ppt Icon Templates PDF
Deliver an awe-inspiring pitch with this creative vendor management dashboard with procurement cycle time ppt icon templates pdf bundle. Topics like key measures, key actions can be discussed with this completely editable template. It is available for immediate download depending on the needs and requirements of the user.
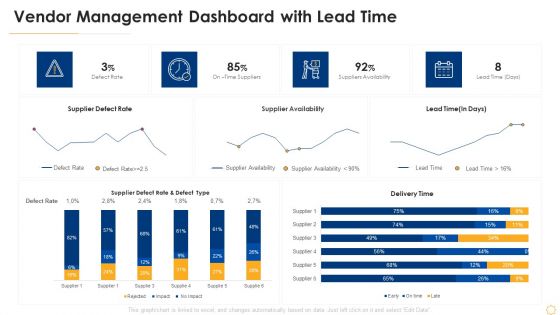
Successful Vendor Management Approaches To Boost Procurement Efficiency Vendor Management Dashboard With Lead Time Themes PDF
Deliver and pitch your topic in the best possible manner with this successful vendor management approaches to boost procurement efficiency vendor management dashboard with lead time themes pdf. Use them to share invaluable insights on supplier defect rate, supplier availability, lead time and impress your audience. This template can be altered and modified as per your expectations. So, grab it now.
Sales Funnel Management For Revenue Generation Tracking Sales Pipeline And Lead Activity Dashboard Background PDF
This slide covers information regarding dashboard associated to tracking lead activity across sales pipeline. Deliver and pitch your topic in the best possible manner with this sales funnel management for revenue generation tracking sales pipeline and lead activity dashboard background pdf. Use them to share invaluable insights on team matterhorn, expansion opportunity, estimated value and impress your audience. This template can be altered and modified as per your expectations. So, grab it now.
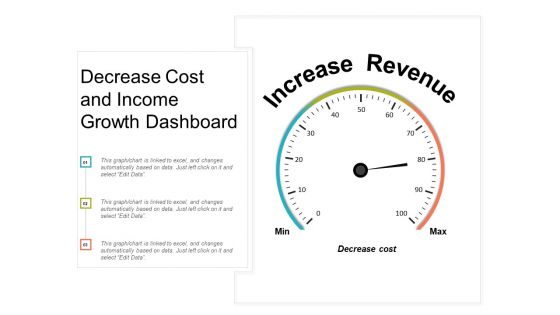
Decrease Cost And Income Growth Dashboard Ppt PowerPoint Presentation Inspiration Guide
This is a decrease cost and income growth dashboard ppt powerpoint presentation inspiration guide. This is a three stage process. The stages in this process are growth, increase sales, increase revenue.
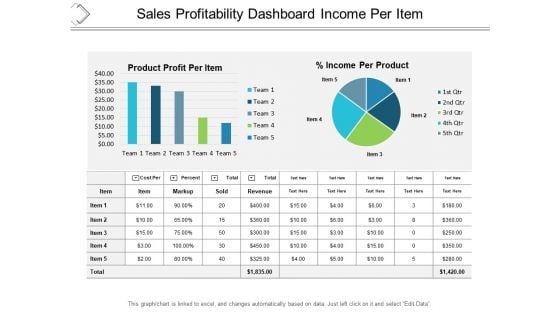
Sales Profitability Dashboard Income Per Item Ppt PowerPoint Presentation Professional Graphic Images
This is a sales profitability dashboard income per item ppt powerpoint presentation professional graphic images. This is a five stage process. The stages in this process are business analytics, ba, organizations data.
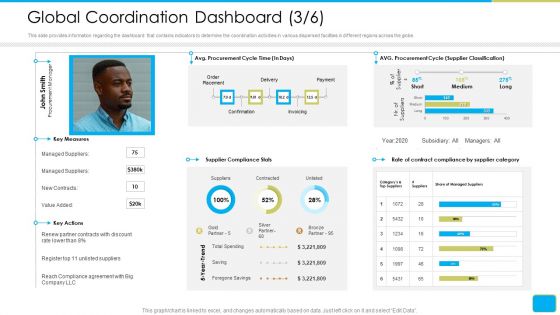
Cross Border Integration In Multinational Corporation Global Coordination Dashboard Time Rules PDF
This slide provides information regarding the dashboard that contains indicators to determine the coordination activities in various dispersed facilities in different regions across the globe. Deliver an awe-inspiring pitch with this creative cross border integration in multinational corporation global coordination dashboard time rules pdf bundle. Topics like avg procurement cycle time, supplier classification, supplier compliance stats can be discussed with this completely editable template. It is available for immediate download depending on the needs and requirements of the user.
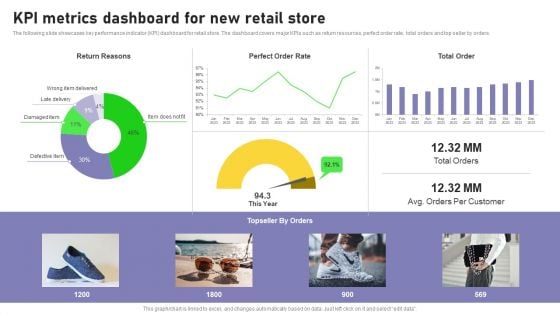
Retail Outlet Opening To Enhance Product Sale Kpi Metrics Dashboard For New Retail Store Mockup PDF
The following slide showcases key performance indicator KPI dashboard for retail store. The dashboard covers major KPIs such as return resources, perfect order rate, total orders and top seller by orders. Do you have to make sure that everyone on your team knows about any specific topic I yes, then you should give Retail Outlet Opening To Enhance Product Sale Kpi Metrics Dashboard For New Retail Store Mockup PDF a try. Our experts have put a lot of knowledge and effort into creating this impeccable Retail Outlet Opening To Enhance Product Sale Kpi Metrics Dashboard For New Retail Store Mockup PDF. You can use this template for your upcoming presentations, as the slides are perfect to represent even the tiniest detail. You can download these templates from the Slidegeeks website and these are easy to edit. So grab these today.
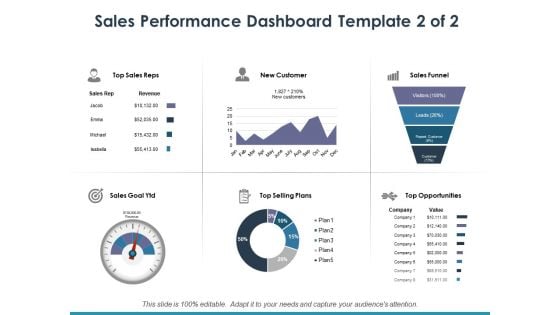
Sales Performance Dashboard Template 2 Ppt PowerPoint Presentation Infographic Template Clipart
This is a sales performance dashboard template 2 ppt powerpoint presentation infographic template clipart. This is a six stage process. The stages in this process are top sales reps, new customer, sales funnel, top selling plans, top opportunities.
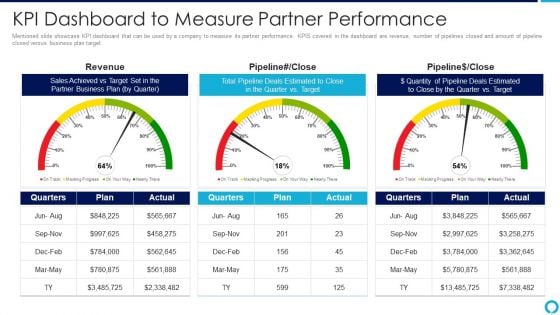
Partnership Management Strategies Kpi Dashboard To Measure Partner Performance Elements PDF
Mentioned slide showcase KPI dashboard that can be used by a company to measure its partner performance. KPIS covered in the dashboard are revenue, number of pipelines closed and amount of pipeline closed versus business plan target.Deliver an awe inspiring pitch with this creative partnership management strategies kpi dashboard to measure partner performance elements pdf bundle. Topics like sales achieved, partner business plan, total pipeline deals estimated can be discussed with this completely editable template. It is available for immediate download depending on the needs and requirements of the user.
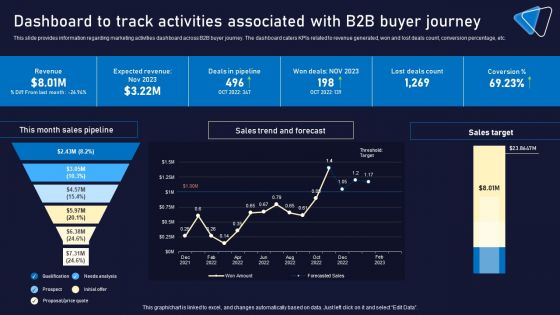
Dashboard To Track Activities Associated With B2B Buyer Journey Portrait PDF
This slide provides information regarding marketing activities dashboard across B2B buyer journey. The dashboard caters KPIs related to revenue generated, won and lost deals count, conversion percentage, etc. Make sure to capture your audiences attention in your business displays with our gratis customizable Dashboard To Track Activities Associated With B2B Buyer Journey Portrait PDF. These are great for business strategies, office conferences, capital raising or task suggestions. If you desire to acquire more customers for your tech business and ensure they stay satisfied, create your own sales presentation with these plain slides.
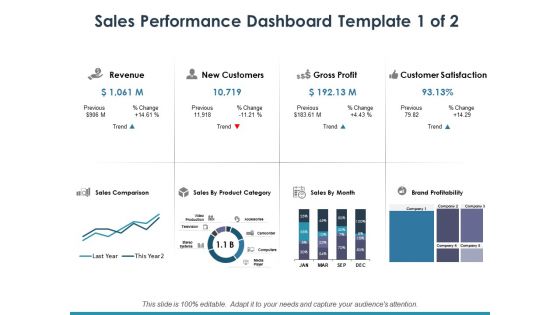
Sales Performance Dashboard Template 1 Ppt PowerPoint Presentation Infographic Template Maker
This is a sales performance dashboard template 1 ppt powerpoint presentation infographic template maker. This is a eight stage process. The stages in this process are dollar, business, finance, marketing.
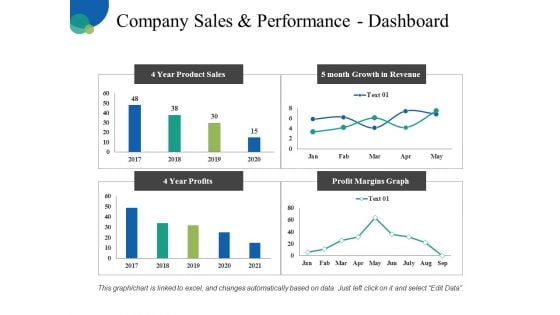
Company Sales And Performance Dashboard Ppt PowerPoint Presentation Pictures Infographic Template
This is a company sales and performance dashboard ppt powerpoint presentation pictures infographic template. This is a four stage process. The stages in this process are business, finance, analysis, management, marketing.
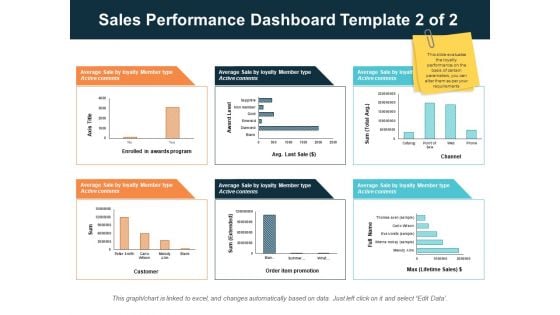
Sales Performance Dashboard Template 2 Of 2 Ppt PowerPoint Presentation Infographics Design Inspiration
This is a sales performance dashboard template 2 of 2 ppt powerpoint presentation infographics design inspiration. This is a three stage process. The stages in this process are finance, management, strategy, analysis, marketing.
Retail Trading Platform Dashboard Tracking Essential Kpis For Ecommerce Performance Diagrams PDF
This slide provides information regarding essential KPIs for ecommerce performance dashboard tracking average bounce rate, new vs. old customers, channel revenue vs. channel acquisitions costs, channel revenue vs. sales, average conversion rate, etc. Deliver an awe inspiring pitch with this creative retail trading platform dashboard tracking essential kpis for ecommerce performance diagrams pdf bundle. Topics like average bounce rate, average conversion rate, bounce rate, channel revenue sales can be discussed with this completely editable template. It is available for immediate download depending on the needs and requirements of the user.

Porters Strategies For Targeted Client Segment Dashboard To Track Product Sales Performance Clipart PDF
This slide showcases dashboard that can help organization to analyse the sales of product after entering into niche market. Its key elements are sales, sales target, sales growth, sales by channel, inventory days outstanding etc. Presenting this PowerPoint presentation, titled Porters Strategies For Targeted Client Segment Dashboard To Track Product Sales Performance Clipart PDF, with topics curated by our researchers after extensive research. This editable presentation is available for immediate download and provides attractive features when used. Download now and captivate your audience. Presenting this Porters Strategies For Targeted Client Segment Dashboard To Track Product Sales Performance Clipart PDF. Our researchers have carefully researched and created these slides with all aspects taken into consideration. This is a completely customizable Porters Strategies For Targeted Client Segment Dashboard To Track Product Sales Performance Clipart PDF that is available for immediate downloading. Download now and make an impact on your audience. Highlight the attractive features available with our PPTs.
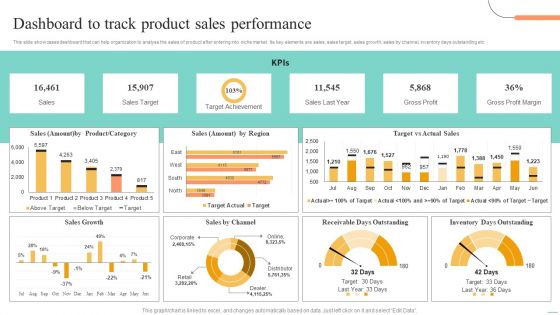
Price Leadership Technique Dashboard To Track Product Sales Performance Professional PDF
This slide showcases dashboard that can help organization to analyse the sales of product after entering into niche market. Its key elements are sales, sales target, sales growth, sales by channel, inventory days outstanding etc. Presenting this PowerPoint presentation, titled Price Leadership Technique Dashboard To Track Product Sales Performance Professional PDF, with topics curated by our researchers after extensive research. This editable presentation is available for immediate download and provides attractive features when used. Download now and captivate your audience. Presenting this Price Leadership Technique Dashboard To Track Product Sales Performance Professional PDF. Our researchers have carefully researched and created these slides with all aspects taken into consideration. This is a completely customizable Price Leadership Technique Dashboard To Track Product Sales Performance Professional PDF that is available for immediate downloading. Download now and make an impact on your audience. Highlight the attractive features available with our PPTs.


 Continue with Email

 Home
Home


