Purchasing Dashboard
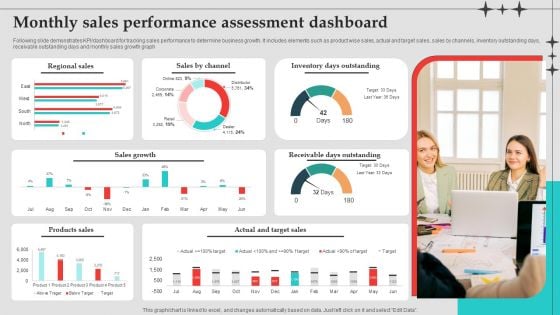
Monthly Sales Performance Assessment Dashboard Download PDF
Following slide demonstrates KPI or dashboard for tracking sales performance to determine business growth. It includes elements such as product wise sales, actual and target sales, sales by channels, inventory outstanding days, receivable outstanding days and monthly sales growth graph. Showcasing this set of slides titled Monthly Sales Performance Assessment Dashboard Download PDF. The topics addressed in these templates are Sales Growth, Inventory Days Outstanding, Target Sales. All the content presented in this PPT design is completely editable. Download it and make adjustments in color, background, font etc. as per your unique business setting.
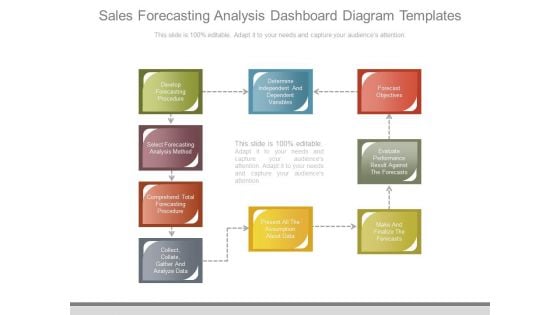
Sales Forecasting Analysis Dashboard Diagram Templates
This is a sales forecasting analysis dashboard diagram templates. This is a nine stage process. The stages in this process are develop forecasting procedure, select forecasting analysis method, comprehend total forecasting procedure, collect collate gather and analyze data, determine independent and dependent variables, present all the assumption about data, forecast objectives, evaluate performance result against the forecasts, make and finalize the forecasts.
Tracking Customer Sales Funnel Dashboard Professional PDF
This slide covers information regarding the customer sales funnel tracking with sales volume and total market. Deliver an awe inspiring pitch with this creative Tracking Customer Sales Funnel Dashboard Professional PDF bundle. Topics like Total Market, Sales Volume, Product can be discussed with this completely editable template. It is available for immediate download depending on the needs and requirements of the user.
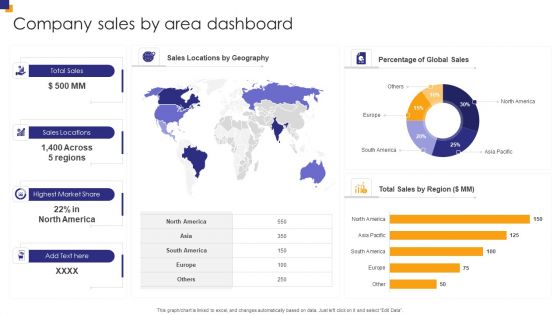
Company Sales By Area Dashboard Infographics PDF
Pitch your topic with ease and precision using this Company Sales By Area Dashboard Infographics PDF. This layout presents information on Total Sales, Sales Locations, Highest Market. It is also available for immediate download and adjustment. So, changes can be made in the color, design, graphics or any other component to create a unique layout.
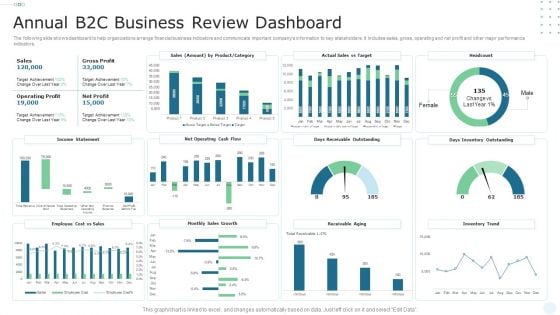
Annual B2C Business Review Dashboard Microsoft PDF
The following slide shows dashboard to help organizations arrange financial business indicators and communicate important companys information to key stakeholders. It includes sales, gross, operating and net profit and other major performance indicators. Showcasing this set of slides titled Annual B2C Business Review Dashboard Microsoft PDF. The topics addressed in these templates are Gross Profit, Sales, Operating Profit. All the content presented in this PPT design is completely editable. Download it and make adjustments in color, background, font etc. as per your unique business setting.
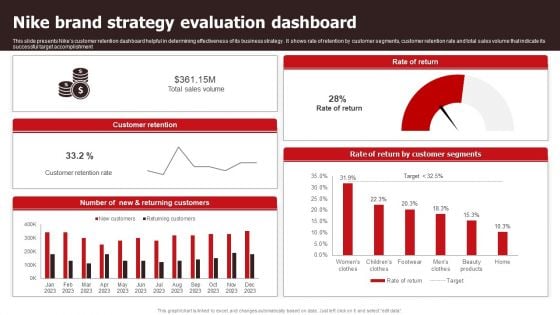
Nike Brand Strategy Evaluation Dashboard Sample PDF
This slide presents Nikes customer retention dashboard helpful in determining effectiveness of its business strategy . It shows rate of retention by customer segments, customer retention rate and total sales volume that indicate its successful target accomplishment. Showcasing this set of slides titled Nike Brand Strategy Evaluation Dashboard Sample PDF. The topics addressed in these templates are Sales Volume, Customer Retention Rate . All the content presented in this PPT design is completely editable. Download it and make adjustments in color, background, font etc. as per your unique business setting.
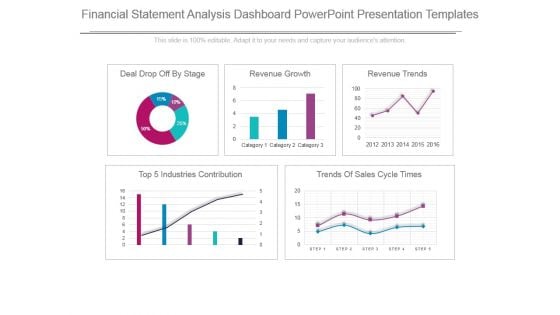
Financial Statement Analysis Dashboard Powerpoint Presentation Templates
This is a financial statement analysis dashboard powerpoint presentation templates. This is a five stage process. The stages in this process are deal drop off by stage, revenue growth, revenue trends, top 5 industries contribution, trends of sales cycle times, category.
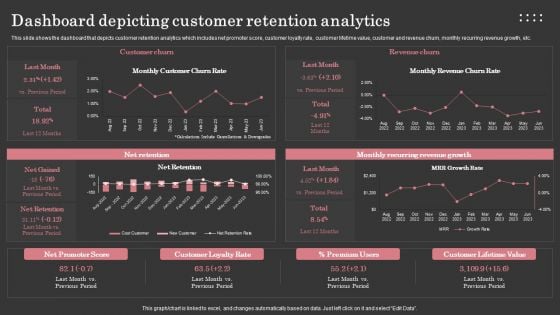
Dashboard Depicting Customer Retention Analytics Background PDF
This slide shows the dashboard that depicts customer retention analytics which includes net promoter score, customer loyalty rate, customer lifetime value, customer and revenue churn, monthly recurring revenue growth, etc. Make sure to capture your audiences attention in your business displays with our gratis customizable Dashboard Depicting Customer Retention Analytics Background PDF. These are great for business strategies, office conferences, capital raising or task suggestions. If you desire to acquire more customers for your tech business and ensure they stay satisfied, create your own sales presentation with these plain slides.

Dashboard Ppt PowerPoint Presentation Ideas Graphics Pictures
Presenting this set of slides with name dashboard ppt powerpoint presentation ideas graphics pictures. The topics discussed in these slides are ytd sales vs yr sm, net sales vs last yr sm, net sales vs last yr sm. This is a completely editable PowerPoint presentation and is available for immediate download. Download now and impress your audience.
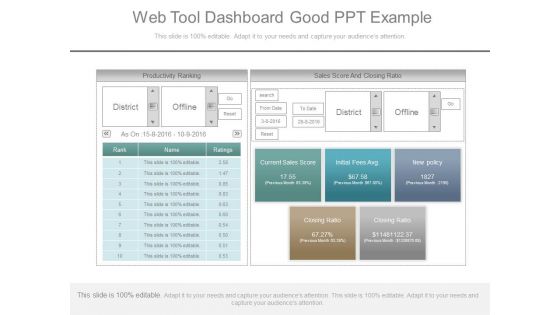
Web Tool Dashboard Good Ppt Example
This is a web tool dashboard good ppt example. This is a two stage process. The stages in this process are productivity ranking, district, offline, go, reset, rank, name, ratings, sales score and closing ratio, search, from date, to date, current sales score, initial fees avg, new policy, previous month, closing ratio, as on.
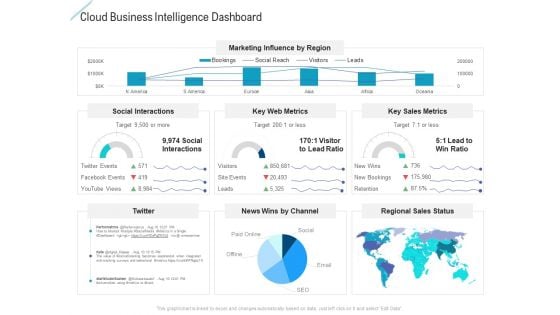
Cloud Business Intelligence Dashboard Graphics PDF
Deliver and pitch your topic in the best possible manner with this cloud business intelligence dashboard graphics pdf. Use them to share invaluable insights on social interactions, key web metrics, key sales metrics and impress your audience. This template can be altered and modified as per your expectations. So, grab it now.
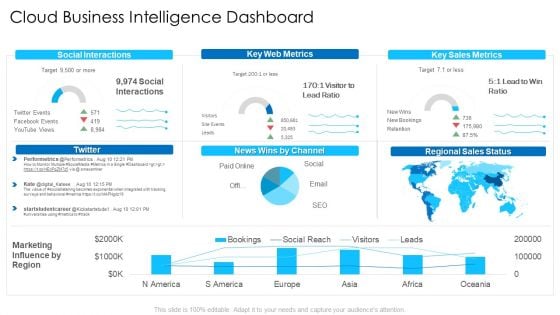
Cloud Business Intelligence Dashboard Microsoft PDF
Deliver an awe inspiring pitch with this creative cloud business intelligence dashboard microsoft pdf bundle. Topics like social interactions, key web metrics, regional sales status can be discussed with this completely editable template. It is available for immediate download depending on the needs and requirements of the user.

Balance Scorecard Index Dashboard Ppt Slides
This is a balance scorecard index dashboard ppt slides. This is a one stage process. The stages in this process are sales by month, gross revenue, customer retention, executive scorecard, measures, status, trend, financial, option, customer, internal processes, learning and growth.
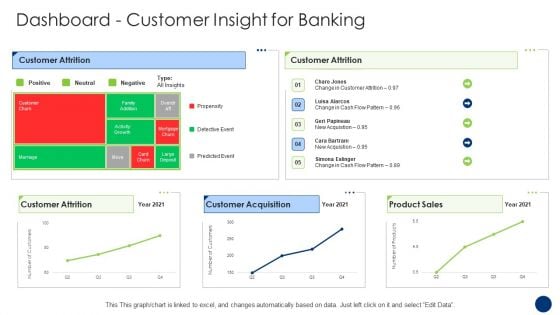
Dashboard Customer Insight For Banking Brochure PDF
Deliver and pitch your topic in the best possible manner with this dashboard customer insight for banking brochure pdf. Use them to share invaluable insights on customer attrition, customer acquisition, product sales and impress your audience. This template can be altered and modified as per your expectations. So, grab it now.
Compensation Management Operations Dashboard Icons PDF
Deliver and pitch your topic in the best possible manner with this compensation management operations dashboard icons pdf. Use them to share invaluable insights on compensation per sale, compensation per plan, compensation per plan, top 10, compensation per component with rank and impress your audience. This template can be altered and modified as per your expectations. So, grab it now.

Compensation Management Operations Dashboard Guidelines PDF
Deliver and pitch your topic in the best possible manner with this compensation management operations dashboard guidelines pdf. Use them to share invaluable insights on sale, plan and impress your audience. This template can be altered and modified as per your expectations. So, grab it now.
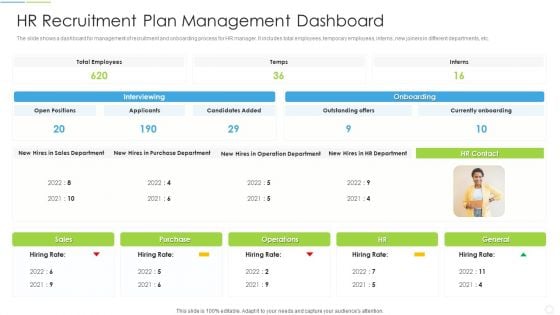
HR Recruitment Plan Management Dashboard Graphics PDF
Showcasing this set of slides titled HR Recruitment Plan Management Dashboard Graphics PDF The topics addressed in these templates are Interviewing, Currently Onboarding, Sales Department All the content presented in this PPT design is completely editable. Download it and make adjustments in color, background, font etc. as per your unique business setting.
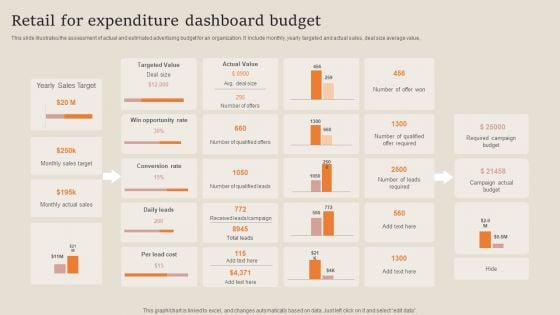
Retail For Expenditure Dashboard Budget Designs PDF
This slide illustrates the assessment of actual and estimated advertising budget for an organization. It include monthly, yearly targeted and actual sales, deal size average value, Showcasing this set of slides titled Retail For Expenditure Dashboard Budget Designs PDF. The topics addressed in these templates are Sales Target, Opportunity Rate, Required Campaign Budget. All the content presented in this PPT design is completely editable. Download it and make adjustments in color, background, font etc. as per your unique business setting.
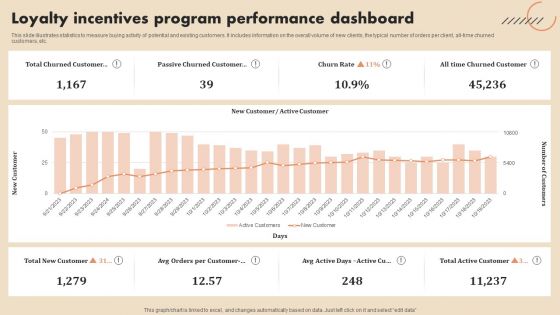
Loyalty Incentives Program Performance Dashboard Microsoft PDF
This slide illustrates statistics to measure buying activity of potential and existing customers. It includes information on the overall volume of new clients, the typical number of orders per client, all time churned customers, etc.Showcasing this set of slides titled Loyalty Incentives Program Performance Dashboard Microsoft PDF. The topics addressed in these templates are Total Churned Customer, Passive Churned Customer. All the content presented in this PPT design is completely editable. Download it and make adjustments in color, background, font etc. as per your unique business setting.
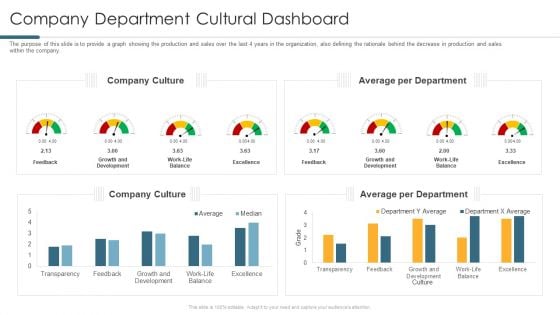
Company Department Cultural Dashboard Formats PDF
The purpose of this slide is to provide a graph showing the production and sales over the last 4 years in the organization, also defining the rationale behind the decrease in production and sales within the company. Deliver an awe inspiring pitch with this creative company department cultural dashboard formats pdf bundle. Topics like average per department, company culture can be discussed with this completely editable template. It is available for immediate download depending on the needs and requirements of the user.
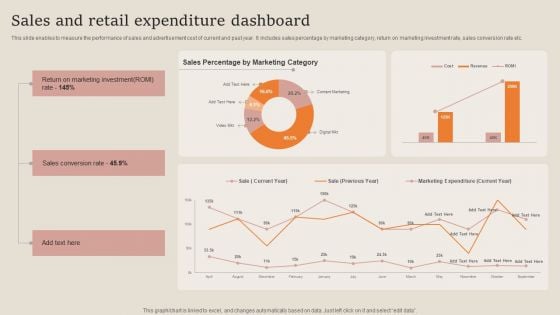
Sales And Retail Expenditure Dashboard Guidelines PDF
This slide enables to measure the performance of sales and advertisement cost of current and past year. It includes sales percentage by marketing category, return on marketing investment rate, sales conversion rate etc. Pitch your topic with ease and precision using this Sales And Retail Expenditure Dashboard Guidelines PDF. This layout presents information on Sales Conversion Rate, Marketing Investment. It is also available for immediate download and adjustment. So, changes can be made in the color, design, graphics or any other component to create a unique layout.
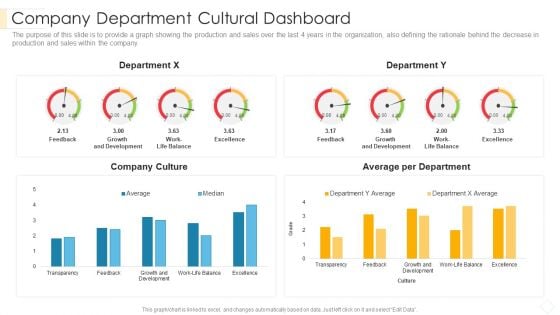
Company Department Cultural Dashboard Pictures PDF
The purpose of this slide is to provide a graph showing the production and sales over the last 4 years in the organization, also defining the rationale behind the decrease in production and sales within the company.Deliver an awe inspiring pitch with this creative company department cultural dashboard pictures pdf bundle. Topics like company culture, average per department, growth and development can be discussed with this completely editable template. It is available for immediate download depending on the needs and requirements of the user.
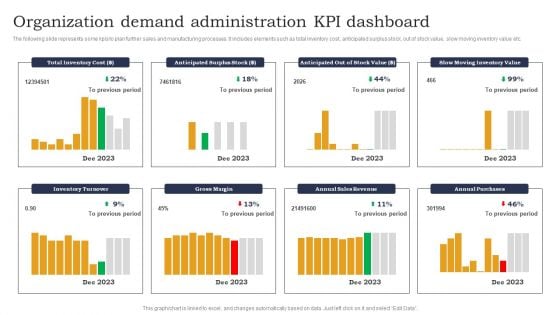
Organization Demand Administration KPI Dashboard Designs PDF
The following slide represents some kpis to plan further sales and manufacturing processes. It includes elements such as total inventory cost, anticipated surplus stock, out of stock value, slow moving inventory value etc. Pitch your topic with ease and precision using this Organization Demand Administration KPI Dashboard Designs PDF. This layout presents information on Anticipated Surplus Stock, Out Of Stock, Slow Moving Inventory. It is also available for immediate download and adjustment. So, changes can be made in the color, design, graphics or any other component to create a unique layout.
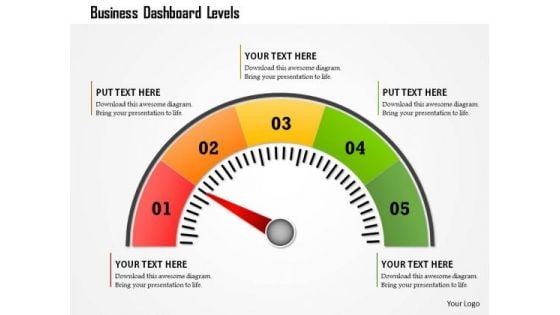
Business Framework Business Dashboard Levels PowerPoint Presentation
This business diagram displays colored meter with multiple levels. Use this diagram to display business process. This diagram can be used to indicate performance measures. This is an excellent diagram to impress your audiences.
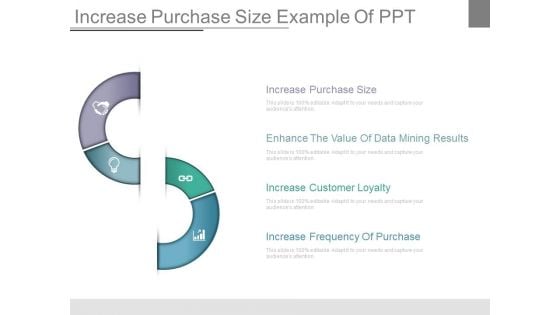
Increase Purchase Size Example Of Ppt
This is a increase purchase size example of ppt. This is a four stage process. The stages in this process are increase purchase size, enhance the value of data mining results, increase customer loyalty, increase frequency of purchase.
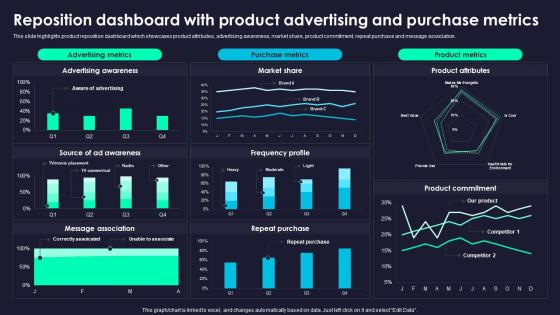
Reposition Dashboard Rebranding Marketing Strategies For Effective Clipart Pdf
This slide highlights product reposition dashboard which showcases product attributes, advertising awareness, market share, product commitment, repeat purchase and message association. Slidegeeks has constructed Reposition Dashboard Rebranding Marketing Strategies For Effective Clipart Pdf after conducting extensive research and examination. These presentation templates are constantly being generated and modified based on user preferences and critiques from editors. Here, you will find the most attractive templates for a range of purposes while taking into account ratings and remarks from users regarding the content. This is an excellent jumping off point to explore our content and will give new users an insight into our top notch PowerPoint Templates. This slide highlights product reposition dashboard which showcases product attributes, advertising awareness, market share, product commitment, repeat purchase and message association.
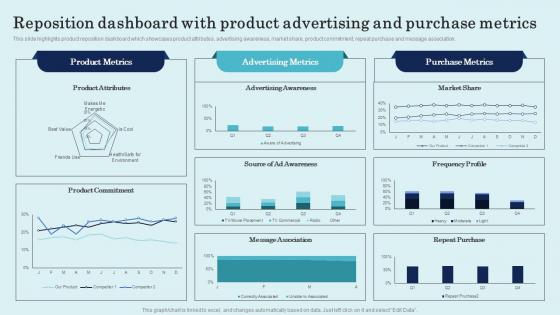
Reposition Dashboard With Product Advertising Product Repositioning Technique Mockup Pdf
This slide highlights product reposition dashboard which showcases product attributes, advertising awareness, market share, product commitment, repeat purchase and message association. Slidegeeks has constructed Reposition Dashboard With Product Advertising Product Repositioning Technique Mockup Pdf after conducting extensive research and examination. These presentation templates are constantly being generated and modified based on user preferences and critiques from editors. Here, you will find the most attractive templates for a range of purposes while taking into account ratings and remarks from users regarding the content. This is an excellent jumping-off point to explore our content and will give new users an insight into our top-notch PowerPoint Templates. This slide highlights product reposition dashboard which showcases product attributes, advertising awareness, market share, product commitment, repeat purchase and message association.
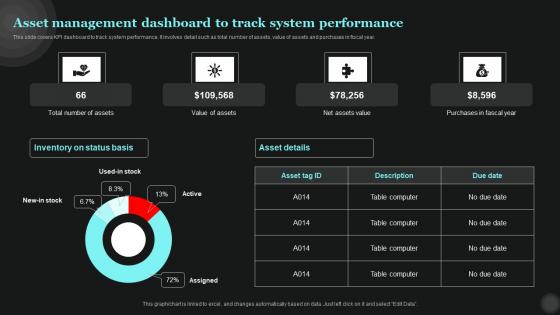
Asset Management Dashboard To Track Tech Asset Management Diagrams Pdf
This slide covers KPI dashboard to track system performance. It involves detail such as total number of assets, value of assets and purchases in fiscal year. Slidegeeks has constructed Asset Management Dashboard To Track Tech Asset Management Diagrams Pdf after conducting extensive research and examination. These presentation templates are constantly being generated and modified based on user preferences and critiques from editors. Here, you will find the most attractive templates for a range of purposes while taking into account ratings and remarks from users regarding the content. This is an excellent jumping-off point to explore our content and will give new users an insight into our top-notch PowerPoint Templates. This slide covers KPI dashboard to track system performance. It involves detail such as total number of assets, value of assets and purchases in fiscal year.
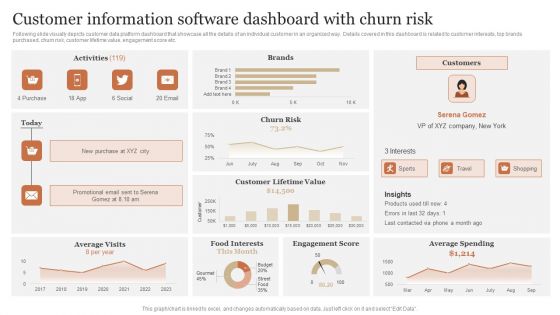
Customer Information Software Dashboard With Churn Risk Information PDF
Following slide visually depicts customer data platform dashboard that showcase all the details of an individual customer in an organized way. Details covered in this dashboard is related to customer interests, top brands purchased, churn risk, customer lifetime value, engagement score etc. Pitch your topic with ease and precision using this Customer Information Software Dashboard With Churn Risk Information PDF. This layout presents information on Customer Lifetime, Engagement Score, Average Spending. It is also available for immediate download and adjustment. So, changes can be made in the color, design, graphics or any other component to create a unique layout.
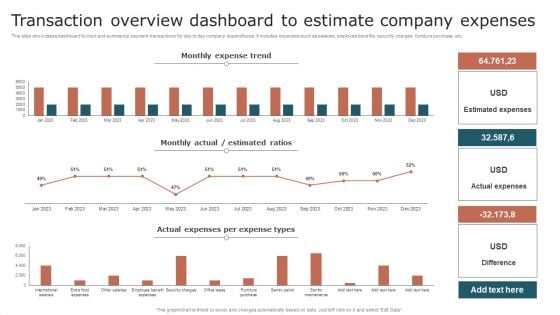
Transaction Overview Dashboard To Estimate Company Expenses Mockup PDF
This slide showcases dashboard to track and summarize payment transactions for day to day company expenditures. It includes expenses such as salaries, employee benefits, security charges, furniture purchase, etc. Showcasing this set of slides titled Transaction Overview Dashboard To Estimate Company Expenses Mockup PDF. The topics addressed in these templates are Monthly Expense Trend, Estimated Ratios, Actual Expenses. All the content presented in this PPT design is completely editable. Download it and make adjustments in color, background, font etc. as per your unique business setting.
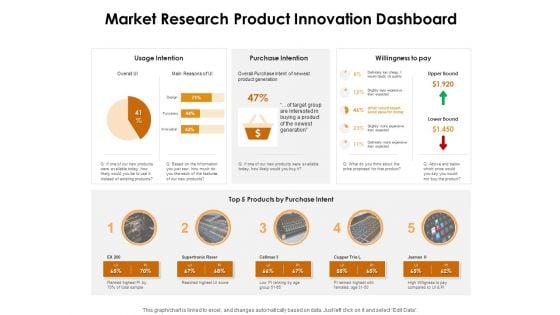
KPI Dashboards Per Industry Market Research Product Innovation Dashboard Ppt PowerPoint Presentation Portfolio Infographic Template PDF
Deliver an awe-inspiring pitch with this creative kpi dashboards per industry market research product innovation dashboard ppt powerpoint presentation portfolio infographic template pdf bundle. Topics like usage intention, purchase intention, willingness to pay, top 5 products purchase intent can be discussed with this completely editable template. It is available for immediate download depending on the needs and requirements of the user.
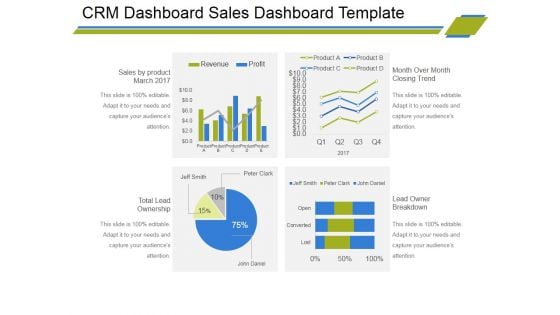
Crm Dashboard Sales Dashboard Template Ppt PowerPoint Presentation Portfolio Master Slide
This is a crm dashboard sales dashboard template ppt powerpoint presentation portfolio master slide. This is a four stage process. The stages in this process are sales by product march, total lead ownership, month over month closing trend, lead owner breakdown.
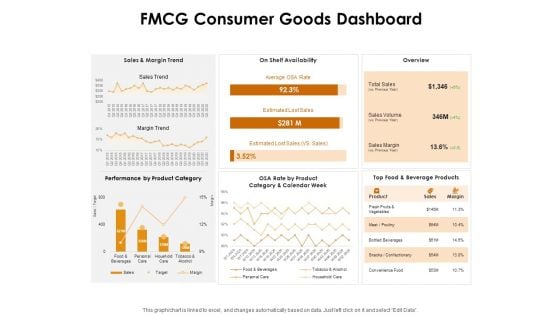
KPI Dashboards Per Industry FMCG Consumer Goods Dashboard Ppt PowerPoint Presentation Infographics Graphics Tutorials PDF
Deliver and pitch your topic in the best possible manner with this kpi dashboards per industry fmcg consumer goods dashboard ppt powerpoint presentation infographics graphics tutorials pdf. Use them to share invaluable insights on sales and margin trend, on shelf availability, overview, performance product category and impress your audience. This template can be altered and modified as per your expectations. So, grab it now.
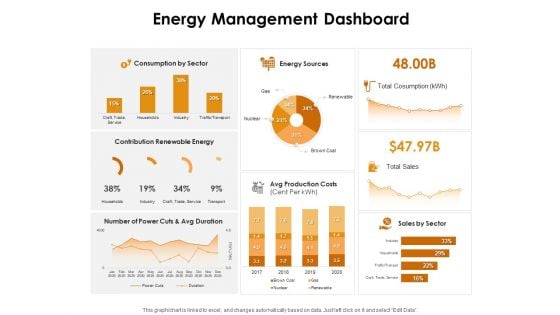
KPI Dashboards Per Industry Energy Management Dashboard Ppt PowerPoint Presentation Infographics Background PDF
Deliver an awe-inspiring pitch with this creative kpi dashboards per industry energy management dashboard ppt powerpoint presentation infographics background pdf bundle. Topics like consumption sector, energy sources, contribution renewable energy, avg production costs, sales sector can be discussed with this completely editable template. It is available for immediate download depending on the needs and requirements of the user.
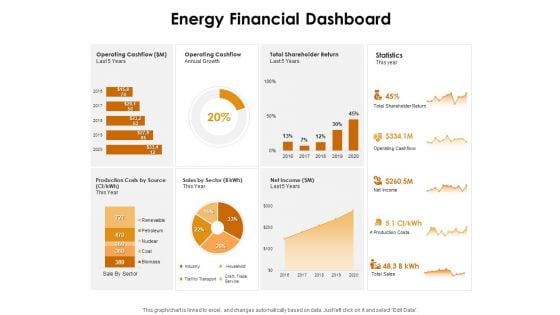
KPI Dashboards Per Industry Energy Financial Dashboard Ppt PowerPoint Presentation Professional Example File PDF
Deliver and pitch your topic in the best possible manner with this kpi dashboards per industry energy financial dashboard ppt powerpoint presentation professional example file pdf. Use them to share invaluable insights on operating cashflow, total shareholder return, production costs source, sales sector, net income and impress your audience. This template can be altered and modified as per your expectations. So, grab it now.
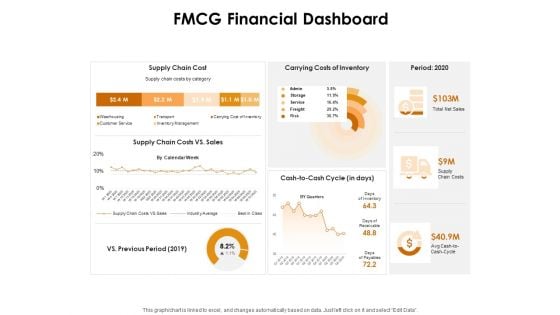
KPI Dashboards Per Industry FMCG Financial Dashboard Ppt PowerPoint Presentation Outline Information PDF
Deliver an awe-inspiring pitch with this creative kpi dashboards per industry fmcg financial dashboard ppt powerpoint presentation outline information pdf bundle. Topics like supply chain cost, carrying costs of inventory, period 2020, supply chain costs vs sales can be discussed with this completely editable template. It is available for immediate download depending on the needs and requirements of the user.

KPI Dashboards Per Industry Logistics Supply Chain Dashboard Ppt PowerPoint Presentation Slides Templates PDF
Deliver and pitch your topic in the best possible manner with this kpi dashboards per industry logistics supply chain dashboard ppt powerpoint presentation slides templates pdf. Use them to share invaluable insights on carrying costs inventory, inventory accuracy, out stock items, inventory sales year and impress your audience. This template can be altered and modified as per your expectations. So, grab it now.
KPI Dashboards Per Industry Retail Store Dashboard Ppt PowerPoint Presentation Icon Grid PDF
Deliver an awe-inspiring pitch with this creative kpi dashboards per industry retail store dashboard ppt powerpoint presentation icon grid pdf bundle. Topics like total customers and visitors, avg price and units per transaction, out stock items, sales city, top 5 articles by sold items, top 5 articles revenue can be discussed with this completely editable template. It is available for immediate download depending on the needs and requirements of the user.
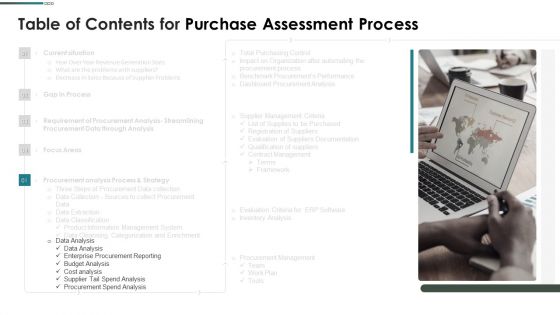
Purchase Assessment Process Table Of Contents For Purchase Assessment Process Slide Pictures PDF
This is a Purchase Assessment Process Table Of Contents For Purchase Assessment Process Slide Pictures PDF template with various stages. Focus and dispense information on one stage using this creative set, that comes with editable features. It contains large content boxes to add your information on topics like Data Analysis, Procurement Reporting, Cost Analysis You can also showcase facts, figures, and other relevant content using this PPT layout. Grab it now.
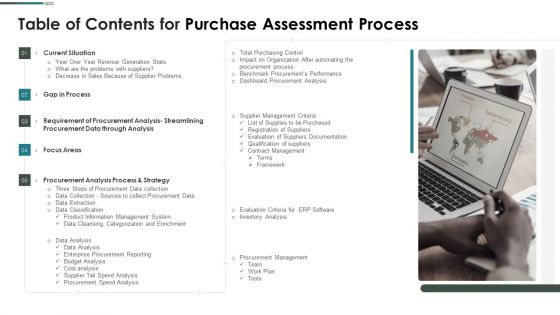
Purchase Assessment Process Table Of Contents For Purchase Assessment Process Inspiration PDF
Presenting Purchase Assessment Process Table Of Contents For Purchase Assessment Process Inspiration PDF to provide visual cues and insights. Share and navigate important information on five stages that need your due attention. This template can be used to pitch topics like Current Situation, Requirement Of Procurement, Procurement Data In addtion, this PPT design contains high resolution images, graphics, etc, that are easily editable and available for immediate download.
Fixed Asset Management Dashboard For Tracking Equipment Performance Inspiration PDF
This slide represents fixed asset management dashboard for tracking equipment performance. It includes work management, downtime, work orders etc.Deliver an awe inspiring pitch with this creative Fixed Asset Management Dashboard For Tracking Equipment Performance Inspiration PDF bundle. Topics like Asset Comparison, Labour Analysis, Purchasing Spend can be discussed with this completely editable template. It is available for immediate download depending on the needs and requirements of the user.
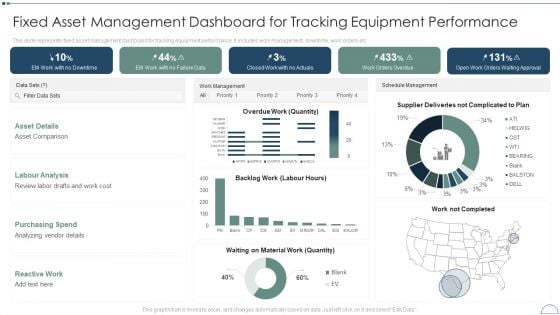
Fixed Asset Management Framework Implementation Fixed Asset Management Dashboard Demonstration PDF
This slide represents fixed asset management dashboard for tracking equipment performance. It includes work management, downtime, work orders etc.Deliver an awe inspiring pitch with this creative Fixed Asset Management Framework Implementation Fixed Asset Management Dashboard Demonstration PDF bundle. Topics like Labour Analysis, Purchasing Spend, Asset Details can be discussed with this completely editable template. It is available for immediate download depending on the needs and requirements of the user.
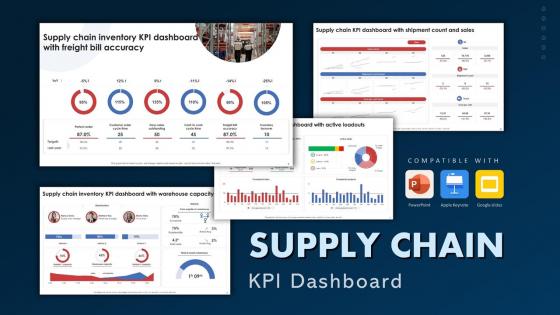
Supply Chain KPI Dashboard Powerpoint Ppt Template Bundles
Use this Supply Chain KPI Dashboard Powerpoint Ppt Template Bundles to ensure the business world gets to know you as a presentation expert with tremendous recall value. With its focus on providing the worlds best designs to highlight business ideas that have the potential to change the world, this PPT Template is sure to win you clients. The complete deck in Freight Bill KPI, Warehouse Capacity, Average Purchase Value, Supply Chain Metrics, Total Savings slides is a compendium of information, structured in a manner that provides the best framework for a presentation. Use this completely editable and customizable presentation to make an impact and improve your order book. Download now. Supply chain KPIs key performance indicators are metrics that measure the performance of a supply chain and help with decision-making. Our Supply Chain KPI Dashboard Powerpoint Ppt Template Bundles are topically designed to provide an attractive backdrop to any subject.
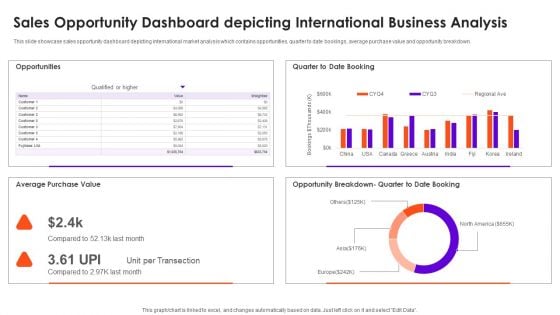
Sales Opportunity Dashboard Depicting International Business Analysis Brochure PDF
This slide showcase sales opportunity dashboard depicting international market analysis which contains opportunities, quarter to date bookings, average purchase value and opportunity breakdown. Showcasing this set of slides titled Sales Opportunity Dashboard Depicting International Business Analysis Brochure PDF. The topics addressed in these templates are Average Purchase Value, Opportunities. All the content presented in this PPT design is completely editable. Download it and make adjustments in color, background, font etc. as per your unique business setting.
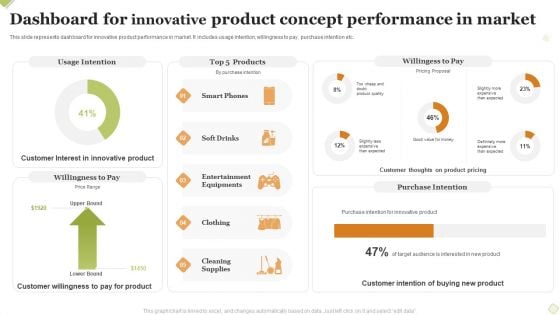
Dashboard For Innovative Product Concept Performance In Market Formats PDF
This slide represents dashboard for innovative product performance in market. It includes usage intention, willingness to pay, purchase intention etc. Pitch your topic with ease and precision using this Dashboard For Innovative Product Concept Performance In Market Formats PDF This layout presents information on Usage Intention, Willingess To Pay, Purchase Intention . It is also available for immediate download and adjustment. So, changes can be made in the color, design, graphics or any other component to create a unique layout.
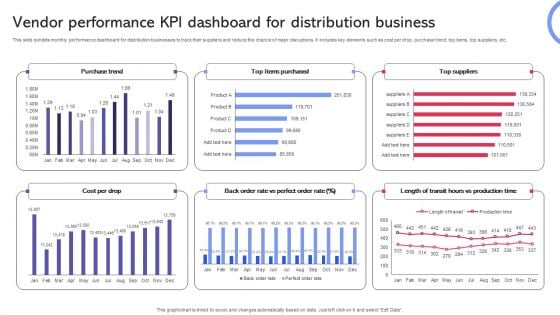
Vendor Performance KPI Dashboard For Distribution Business Formats PDF
This slide exhibits monthly performance dashboard for distribution businesses to track their suppliers and reduce the chance of major disruptions. It includes key elements such as cost per drop, purchase trend, top items, top suppliers, etc. Showcasing this set of slides titled Vendor Performance KPI Dashboard For Distribution Business Formats PDF. The topics addressed in these templates are Purchase Trend, Suppliers, Distribution Business. All the content presented in this PPT design is completely editable. Download it and make adjustments in color, background, font etc. as per your unique business setting.
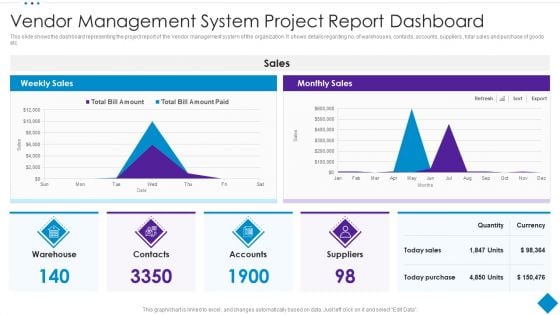
Vendor Management System Project Report Dashboard Template PDF
This slide shows the dashboard representing the project report of the Vendor management system of the organization. It shows details regarding no. of warehouses, contacts, accounts, suppliers , total sales and purchase of goods etc. Showcasing this set of slides titled Vendor Management System Project Report Dashboard Template PDF. The topics addressed in these templates are Purchase, Sales, Suppliers. All the content presented in this PPT design is completely editable. Download it and make adjustments in color, background, font etc. as per your unique business setting.
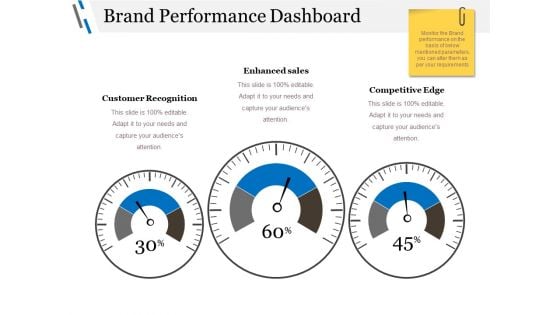
Brand Performance Dashboard Ppt PowerPoint Presentation Professional Grid
This is a brand performance dashboard ppt powerpoint presentation professional grid. This is a three stage process. The stages in this process are customer recognition, enhanced sales, competitive edge, dashboard, business.
Brand Performance Dashboard Ppt PowerPoint Presentation Layouts Summary
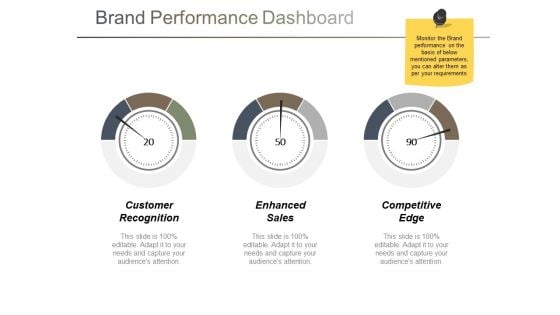
This is a brand performance dashboard ppt powerpoint presentation layouts summary. This is a three stage process. The stages in this process are customer recognition, enhanced sales, competitive edge, dashboard, business.
Brand Performance Dashboard Ppt PowerPoint Presentation Show Graphic Tips
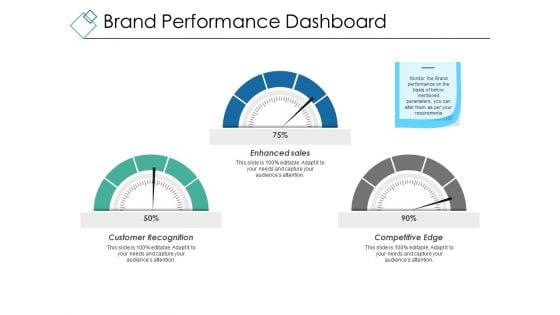
This is a brand performance dashboard ppt powerpoint presentation show graphic tips. This is a three stage process. The stages in this process are customer recognition, enhanced sales, competitive edge, dashboard, business, percentage.
Sales Diagram Dashboard Visual Iinformation Design Business Cycle Diagram
Establish The Dominance Of Your Ideas. Our Sales Diagram Dashboard Visual Information Design Business Cycle Diagram Powerpoint Templates Will Put Them On Top.
Business Framework Model Dashboard Business Meter Design Sales Diagram
Our Business Framework Model Dashboard Business Meter Design Sales Diagram Powerpoint Templates Team Are A Dogged Lot. They Keep At It Till They Get It Right.
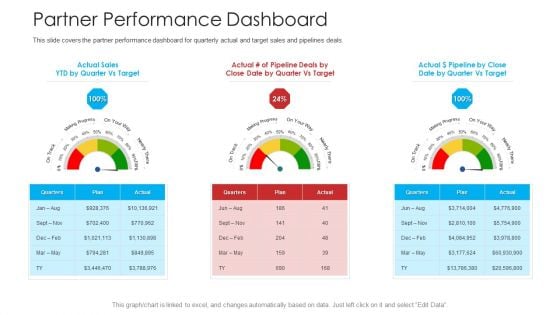
Retailer Channel Partner Boot Camp Partner Performance Dashboard Sample PDF
This slide covers the partner performance dashboard for quarterly actual and target sales and pipelines deals. Presenting retailer channel partner boot camp partner performance dashboard sample pdf to provide visual cues and insights. Share and navigate important information on three stages that need your due attention. This template can be used to pitch topics like performance dashboard, target sales, marketing progress. In addition, this PPT design contains high-resolution images, graphics, etc, that are easily editable and available for immediate download.
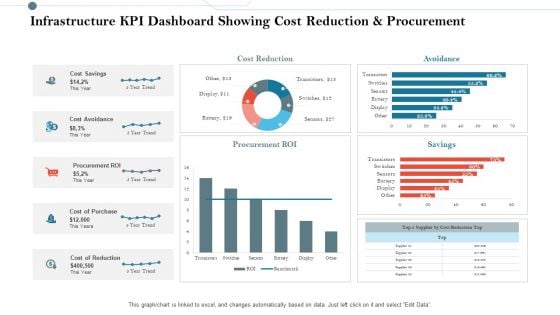
Infrastructure KPI Dashboard Showing Cost Reduction And Procurement Information PDF
Deliver an awe inspiring pitch with this creative infrastructure kpi dashboard showing cost reduction and procurement information pdf bundle. Topics like cost reduction, cost savings, cost avoidance, procurement roi, cost of purchase can be discussed with this completely editable template. It is available for immediate download depending on the needs and requirements of the user.

Infrastructure KPI Dashboard Showing Cost Reduction And Procurement Background PDF
Deliver and pitch your topic in the best possible manner with this infrastructure kpi dashboard showing cost reduction and procurement background pdf. Use them to share invaluable insights on cost reduction, cost savings, cost avoidance, cost of reduction, cost of purchase and impress your audience. This template can be altered and modified as per your expectations. So, grab it now.
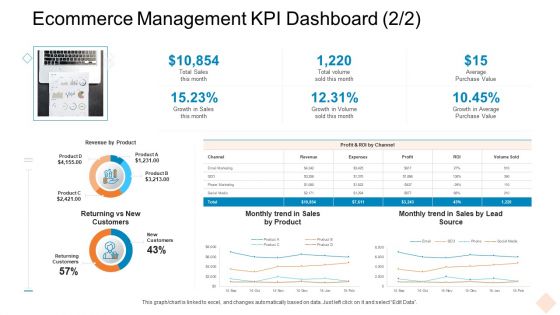
Ecommerce Management KPI Dashboard Ppt Infographics Graphics Example PDF
Deliver and pitch your topic in the best possible manner with this ecommerce management kpi dashboard ppt infographics graphics example pdf. Use them to share invaluable insights on revenue by product, sales by product, growth in average purchase value and impress your audience. This template can be altered and modified as per your expectations. So, grab it now.
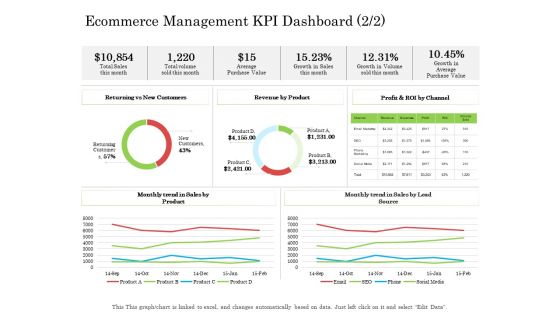
Ecommerce Management KPI Dashboard Ppt Styles Design Ideas PDF
Deliver and pitch your topic in the best possible manner with this ecommerce management kpi dashboard ppt styles design ideas pdf. Use them to share invaluable insights on average purchase value, revenue by product, sales by product and impress your audience. This template can be altered and modified as per your expectations. So, grab it now.
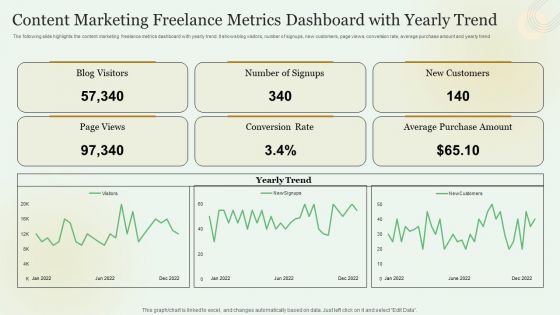
Content Marketing Freelance Metrics Dashboard With Yearly Trend Slides PDF
Showcasing this set of slides titled Content Marketing Freelance Metrics Dashboard With Yearly Trend Slides PDF. The topics addressed in these templates are New Customers, Average Purchase Amount, Conversion Rate. All the content presented in this PPT design is completely editable. Download it and make adjustments in color, background, font etc. as per your unique business setting.

Project Expenses Saving And Avoidance Dashboard Guidelines PDF
Pitch your topic with ease and precision using this Project Expenses Saving And Avoidance Dashboard Guidelines PDF. This layout presents information on Procurement Roi, Supplier By Cost Reduction, Cost Of Purchase Order. It is also available for immediate download and adjustment. So, changes can be made in the color, design, graphics or any other component to create a unique layout.
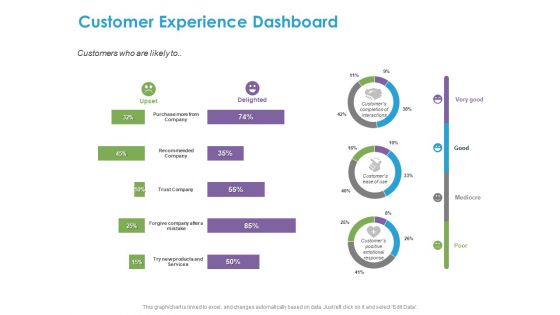
Customer Experience Process Customer Experience Dashboard Ppt Infographics Gridlines PDF
Presenting this set of slides with name customer experience process customer experience dashboard ppt infographics gridlines pdf. The topics discussed in these slides are purchase company, recommended company, trust company, forgive company mistake, try new products and services. This is a completely editable PowerPoint presentation and is available for immediate download. Download now and impress your audience.


 Continue with Email

 Home
Home


