Purchasing Dashboard
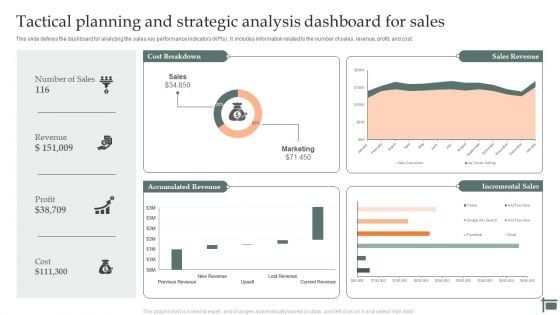
Tactical Planning And Strategic Analysis Dashboard For Sales Infographics PDF
Persuade your audience using this Tactical Planning And Strategic Analysis Dashboard For Sales Infographics PDF. This PPT design covers three stages, thus making it a great tool to use. It also caters to a variety of topics including Tactical, Planning And Analyzing, Organizational Goals, Icon. Download this PPT design now to present a convincing pitch that not only emphasizes the topic but also showcases your presentation skills.

Virtual Assets Investment Guide Cryptocurrency Portfolio Investment Dashboard Guidelines PDF
Identifying the metrics which help in analyzing the product performance play a crucial role when it comes to tracking performance. The following slide highlights such manor KPIs, these are total sell, total buy, etc. Deliver an awe inspiring pitch with this creative Virtual Assets Investment Guide Cryptocurrency Portfolio Investment Dashboard Guidelines PDF bundle. Topics like Bitcoin BTC, Total Sell, Total Buy can be discussed with this completely editable template. It is available for immediate download depending on the needs and requirements of the user.
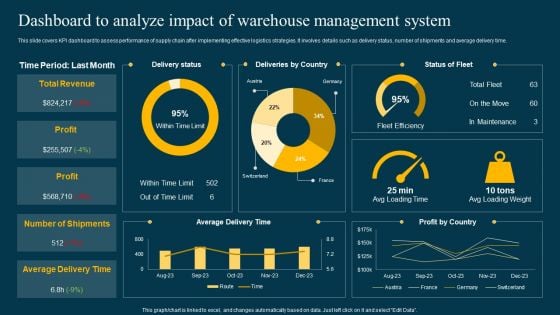
Dashboard To Analyze Impact Of Warehouse Management System Infographics PDF
This slide covers cost analysis for implementing automation procurement tools in logistics and supply chain management. It involves optimization tools, cost involved on monthly basis and its impact on operations. Get a simple yet stunning designed Dashboard To Analyze Impact Of Warehouse Management System Infographics PDF. It is the best one to establish the tone in your meetings. It is an excellent way to make your presentations highly effective. So, download this PPT today from Slidegeeks and see the positive impacts. Our easy-to-edit Dashboard To Analyze Impact Of Warehouse Management System Infographics PDF can be your go-to option for all upcoming conferences and meetings. So, what are you waiting for. Grab this template today.
Strategic Promotion Plan Implementation Analytics Dashboard Icons PDF
This slide illustrates graphical representation of implementation data of promotional strategy. It includes sales revenue, ad expenditure, profit etc. Showcasing this set of slides titled Strategic Promotion Plan Implementation Analytics Dashboard Icons PDF. The topics addressed in these templates are Profit, Sales Revenue, Expenditure. All the content presented in this PPT design is completely editable. Download it and make adjustments in color, background, font etc. as per your unique business setting.
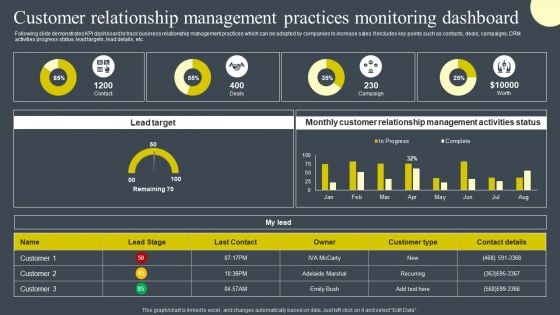
Customer Relationship Management Practices Monitoring Dashboard Designs PDF
Following slide demonstrates KPI dashboard to track business relationship management practices which can be adopted by companies to increase sales. It includes key points such as contacts, deals, campaigns, CRM activities progress status, lead targets, lead details, etc. Are you in need of a template that can accommodate all of your creative concepts This one is crafted professionally and can be altered to fit any style. Use it with Google Slides or PowerPoint. Include striking photographs, symbols, depictions, and other visuals. Fill, move around, or remove text boxes as desired. Test out color palettes and font mixtures. Edit and save your work, or work with colleagues. Download Customer Relationship Management Practices Monitoring Dashboard Designs PDF and observe how to make your presentation outstanding. Give an impeccable presentation to your group and make your presentation unforgettable.
Sales Techniques Playbook Sales Management Activities Tracking Dashboard Introduction PDF
This slide provides information regarding various metrics catered to track sales team performance in terms of average revenue per account, win rate, NPS, along with sales representative performance tracking through number of opportunities created, lead response time, etc. Deliver an awe inspiring pitch with this creative sales techniques playbook sales management activities tracking dashboard introduction pdf bundle. Topics like growth, sales can be discussed with this completely editable template. It is available for immediate download depending on the needs and requirements of the user.
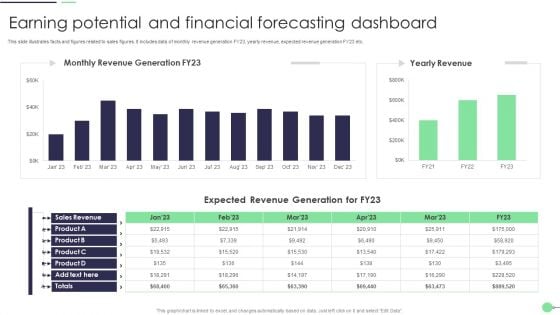
Earning Potential And Financial Forecasting Dashboard Summary PDF
This slide illustrates facts and figures related to sales figures. It includes data of monthly revenue generation FY23, yearly revenue, expected revenue generation FY23 etc. Pitch your topic with ease and precision using this Earning Potential And Financial Forecasting Dashboard Summary PDF. This layout presents information on Sales Revenue, Expected Revenue, Product. It is also available for immediate download and adjustment. So, changes can be made in the color, design, graphics or any other component to create a unique layout.
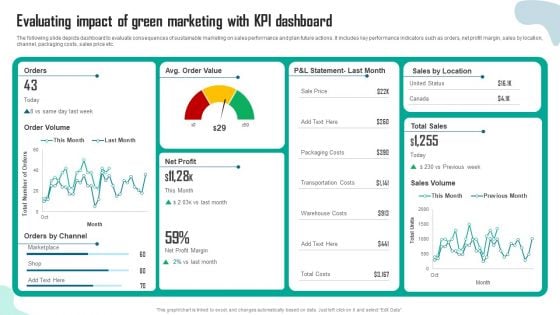
Evaluating Impact Of Green Marketing With Kpi Dashboard Inspiration PDF
The following slide depicts dashboard to evaluate consequences of sustainable marketing on sales performance and plan future actions. It includes key performance indicators such as orders, net profit margin, sales by location, channel, packaging costs, sales price etc. This Evaluating Impact Of Green Marketing With Kpi Dashboard Inspiration PDF from Slidegeeks makes it easy to present information on your topic with precision. It provides customization options, so you can make changes to the colors, design, graphics, or any other component to create a unique layout. It is also available for immediate download, so you can begin using it right away. Slidegeeks has done good research to ensure that you have everything you need to make your presentation stand out. Make a name out there for a brilliant performance.
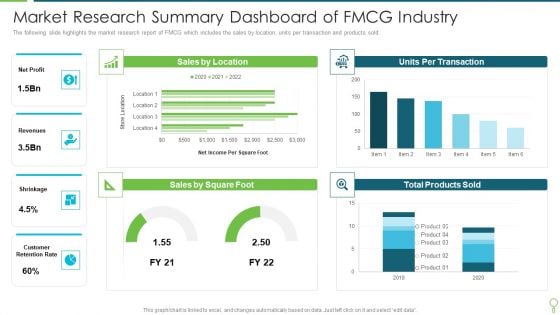
Market Research Summary Dashboard Of Fmcg Industry Pictures PDF
The following slide highlights the market research report of FMCG which includes the sales by location, units per transaction and products sold. Showcasing this set of slides titled Market Research Summary Dashboard Of Fmcg Industry Pictures PDF. The topics addressed in these templates are Revenues, Net Profit, Sales. All the content presented in this PPT design is completely editable. Download it and make adjustments in color, background, font etc. as per your unique business setting.

KPI Dashboard To Monitor Facebook Marketing Strategy Performance Demonstration PDF
The following slide outlines key performance indicator KPI dashboard which can be used to evaluate Facebook advertisement performance. The metrics mentioned in slide are total fans, page views, total actions, post likes, audience growth, fans by language, etc. Slidegeeks is here to make your presentations a breeze with KPI Dashboard To Monitor Facebook Marketing Strategy Performance Demonstration PDF With our easy to use and customizable templates, you can focus on delivering your ideas rather than worrying about formatting. With a variety of designs to choose from, you are sure to find one that suits your needs. And with animations and unique photos, illustrations, and fonts, you can make your presentation pop. So whether you are giving a sales pitch or presenting to the board, make sure to check out Slidegeeks first.
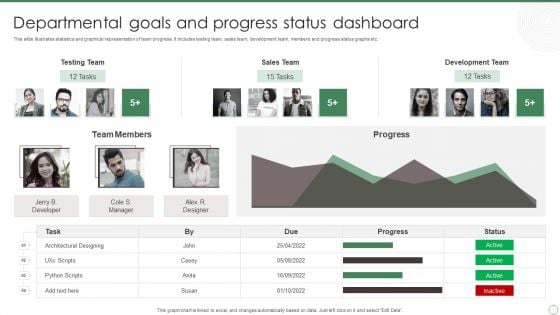
Departmental Goals And Progress Status Dashboard Ppt Portfolio Samples PDF
This slide illustrates statistics and graphical representation of team progress. It includes testing team, sales team, development team, members and progress status graphs etc. Pitch your topic with ease and precision using this Departmental Goals And Progress Status Dashboard Ppt Portfolio Samples PDF. This layout presents information on Testing Team, Sales Team, Development Team. It is also available for immediate download and adjustment. So, changes can be made in the color, design, graphics or any other component to create a unique layout.
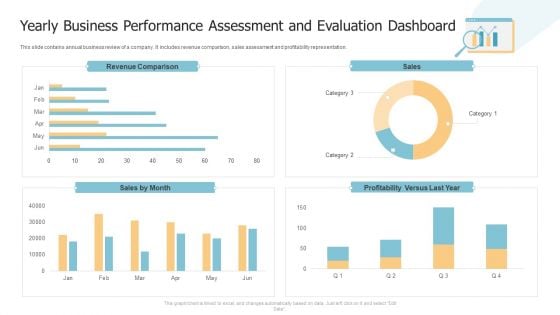
Yearly Business Performance Assessment And Evaluation Dashboard Structure PDF
This slide contains annual business review of a company. It includes revenue comparison, sales assessment and profitability representation. Showcasing this set of slides titled Yearly Business Performance Assessment And Evaluation Dashboard Structure PDF. The topics addressed in these templates are Revenue Comparison, Sales, Profitability. All the content presented in this PPT design is completely editable. Download it and make adjustments in color, background, font etc. as per your unique business setting.
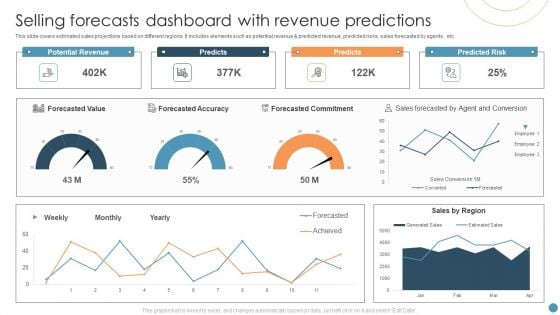
Selling Forecasts Dashboard With Revenue Predictions Elements PDF
This slide covers estimated sales projections based on different regions. It includes elements such as potential revenue and predicted revenue, predicted risks, sales forecasted by agents , etc. Showcasing this set of slides titled Selling Forecasts Dashboard With Revenue Predictions Elements PDF. The topics addressed in these templates are Forecasted Value, Potential Revenue, Predicted Risk. All the content presented in this PPT design is completely editable. Download it and make adjustments in color, background, font etc. as per your unique business setting.
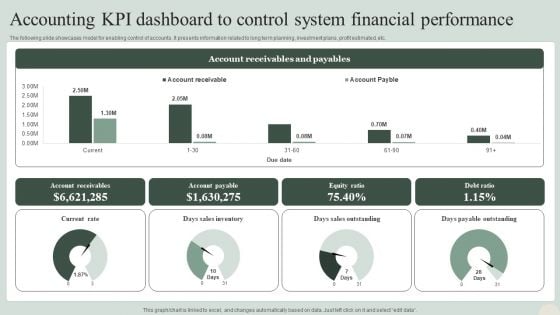
Accounting KPI Dashboard To Control System Financial Performance Formats PDF
The following slide showcases model for enabling control of accounts. It presents information related to long term planning, investment plans, profit estimated, etc. Pitch your topic with ease and precision using this Accounting KPI Dashboard To Control System Financial Performance Formats PDF. This layout presents information on Sales Outstanding, Payable Outstanding, Sales Inventory. It is also available for immediate download and adjustment. So, changes can be made in the color, design, graphics or any other component to create a unique layout.
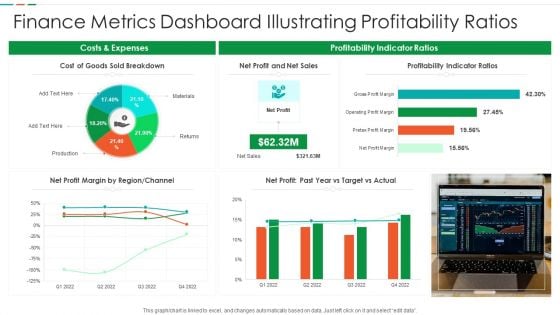
Finance Metrics Dashboard Illustrating Profitability Ratios Diagrams PDF
This graph or chart is linked to excel, and changes automatically based on data. Just left click on it and select edit data. Pitch your topic with ease and precision using this Finance Metrics Dashboard Illustrating Profitability Ratios Diagrams PDF. This layout presents information on Cost Goods Sold, Net Profit Net, Sales Profitability Indicator. It is also available for immediate download and adjustment. So, changes can be made in the color, design, graphics or any other component to create a unique layout.
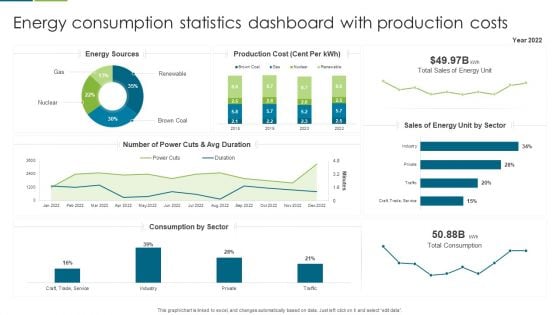
Energy Consumption Statistics Dashboard With Production Costs Slides PDF
This graph or chart is linked to excel, and changes automatically based on data. Just left click on it and select edit data. Showcasing this set of slides titled Energy Consumption Statistics Dashboard With Production Costs Slides PDF. The topics addressed in these templates are Production Cost, Sales Energy, Number Power. All the content presented in this PPT design is completely editable. Download it and make adjustments in color, background, font etc. as per your unique business setting.
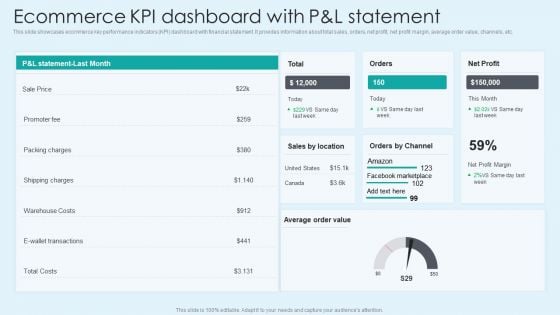
Ecommerce KPI Dashboard With Pand L Statement Download PDF
This slide showcases ecommerce key performance indicators KPI dashboard with financial statement. It provides information about total sales, orders, net profit, net profit margin, average order value, channels, etc. This Ecommerce KPI Dashboard With Pand L Statement Download PDF from Slidegeeks makes it easy to present information on your topic with precision. It provides customization options, so you can make changes to the colors, design, graphics, or any other component to create a unique layout. It is also available for immediate download, so you can begin using it right away. Slidegeeks has done good research to ensure that you have everything you need to make your presentation stand out. Make a name out there for a brilliant performance.
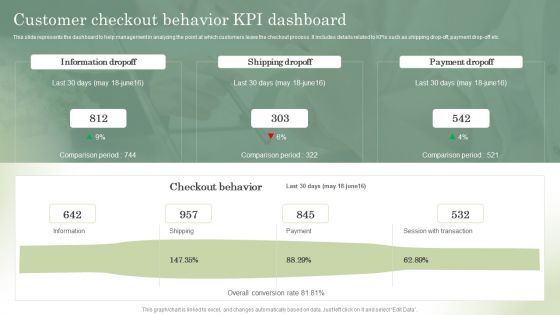
Optimizing Online Stores Customer Checkout Behavior KPI Dashboard Brochure PDF
This slide represents the dashboard to help management in analyzing the point at which customers leave the checkout process. It includes details related to KPIs such as shipping drop-off, payment drop-off etc. Slidegeeks is here to make your presentations a breeze with Optimizing Online Stores Customer Checkout Behavior KPI Dashboard Brochure PDF With our easy-to-use and customizable templates, you can focus on delivering your ideas rather than worrying about formatting. With a variety of designs to choose from, youre sure to find one that suits your needs. And with animations and unique photos, illustrations, and fonts, you can make your presentation pop. So whether youre giving a sales pitch or presenting to the board, make sure to check out Slidegeeks first.
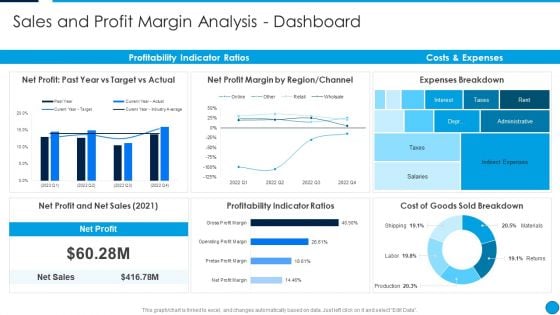
Summary Financial Sales And Profit Margin Analysis Dashboard Pictures PDF
This graph or chart is linked to excel, and changes automatically based on data. Just left click on it and select Edit Data. Deliver an awe inspiring pitch with this creative Summary Financial Sales And Profit Margin Analysis Dashboard Pictures PDF bundle. Topics like Net Profit, Past Year Vs Target Vs Actual, Net Profit Margin By Region, Channel, Expenses Breakdown, Costs And Expenses, Profitability Indicator Ratios can be discussed with this completely editable template. It is available for immediate download depending on the needs and requirements of the user.
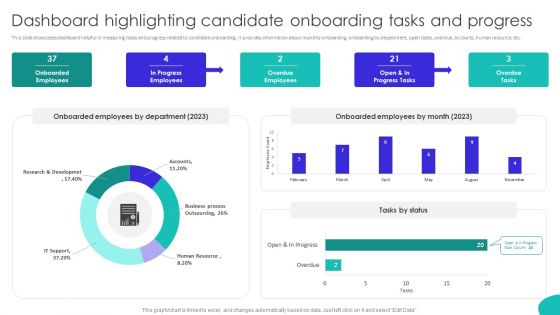
Improving Technology Based Dashboard Highlighting Candidate Onboarding Tasks Information PDF
This slide showcases dashboard helpful in measuring tasks and progress related to candidate onboarding. It provides information about monthly onboarding, onboarding by department, open tasks, overdue, accounts, human resource, etc. Slidegeeks is here to make your presentations a breeze with Improving Technology Based Dashboard Highlighting Candidate Onboarding Tasks Information PDF With our easy-to-use and customizable templates, you can focus on delivering your ideas rather than worrying about formatting. With a variety of designs to choose from, youre sure to find one that suits your needs. And with animations and unique photos, illustrations, and fonts, you can make your presentation pop. So whether youre giving a sales pitch or presenting to the board, make sure to check out Slidegeeks first.
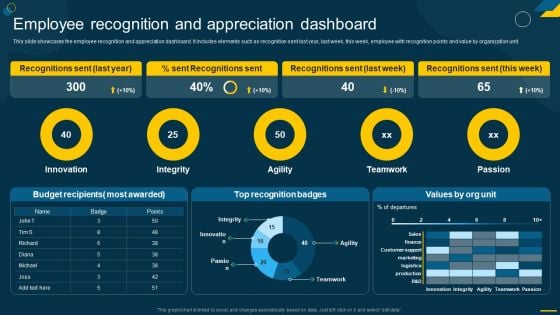
Engaging Employees Strategic Employee Recognition And Appreciation Dashboard Themes PDF
This slide showcases the employee recognition and appreciation dashboard. It includes elements such as recognition sent last year, last week, this week, employee with recognition points and value by organization unit. Slidegeeks is here to make your presentations a breeze with Engaging Employees Strategic Employee Recognition And Appreciation Dashboard Themes PDF With our easy-to-use and customizable templates, you can focus on delivering your ideas rather than worrying about formatting. With a variety of designs to choose from, youre sure to find one that suits your needs. And with animations and unique photos, illustrations, and fonts, you can make your presentation pop. So whether youre giving a sales pitch or presenting to the board, make sure to check out Slidegeeks first.
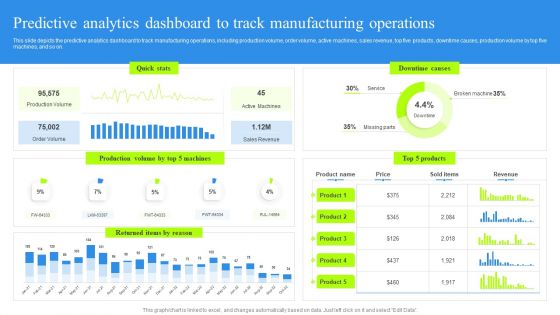
Predictive Analytics Dashboard To Track Manufacturing Operations Rules PDF
This slide depicts the predictive analytics dashboard to track manufacturing operations, including production volume, order volume, active machines, sales revenue, top five products, downtime causes, production volume by top five machines, and so on. Present like a pro with Predictive Analytics Dashboard To Track Manufacturing Operations Rules PDF Create beautiful presentations together with your team, using our easy-to-use presentation slides. Share your ideas in real-time and make changes on the fly by downloading our templates. So whether you are in the office, on the go, or in a remote location, you can stay in sync with your team and present your ideas with confidence. With Slidegeeks presentation got a whole lot easier. Grab these presentations today.
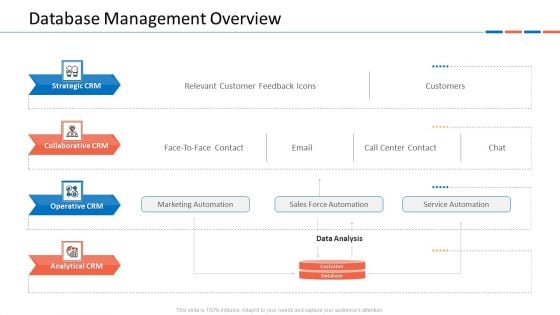
Customer Relationship Management Dashboard Database Management Overview Introduction PDF
Presenting customer relationship management dashboard database management overview introduction pdf to provide visual cues and insights. Share and navigate important information on four stages that need your due attention. This template can be used to pitch topics like marketing automation, sales force automation, service automation. In addtion, this PPT design contains high resolution images, graphics, etc, that are easily editable and available for immediate download.
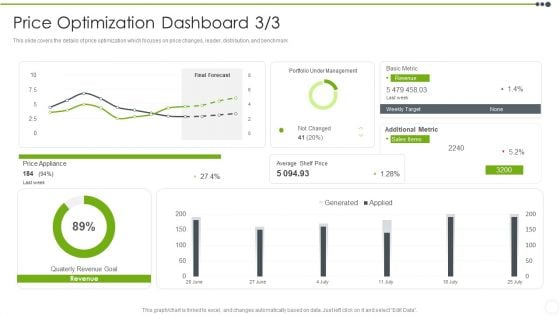
Estimating The Price Price Optimization Dashboard Average Rules PDF
This slide covers the details of price optimization which focuses on price changes, leader, distribution, and benchmark. Deliver an awe inspiring pitch with this creative Estimating The Price Price Optimization Dashboard Average Rules PDF bundle. Topics like Metric, Target, Sales, Average, Price can be discussed with this completely editable template. It is available for immediate download depending on the needs and requirements of the user.
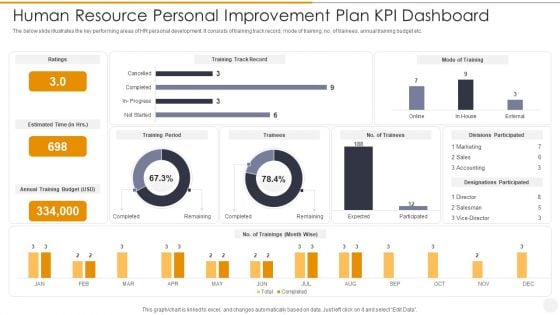
Human Resource Personal Improvement Plan Kpi Dashboard Topics PDF
The below slide illustrates the key performing areas of HR personal development. It consists of training track record, mode of training, no. of trainees, annual training budget etc. Showcasing this set of slides titled Human Resource Personal Improvement Plan Kpi Dashboard Topics PDF. The topics addressed in these templates are Sales, Marketing, Accounting. All the content presented in this PPT design is completely editable. Download it and make adjustments in color, background, font etc. as per your unique business setting.
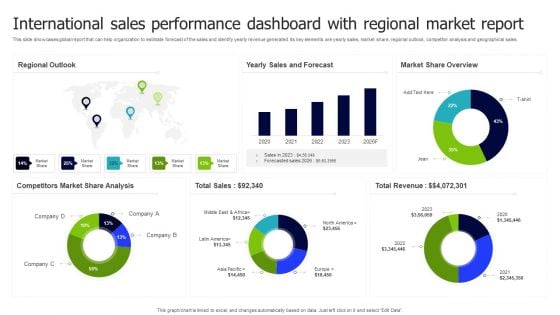
International Sales Performance Dashboard With Regional Market Report Inspiration PDF
This slide showcases global report that can help organization to estimate forecast of the sales and identify yearly revenue generated. Its key elements are yearly sales, market share, regional outlook, competitor analysis and geographical sales. Pitch your topic with ease and precision using this International Sales Performance Dashboard With Regional Market Report Inspiration PDF. This layout presents information on Regional Outlook, Sales And Forecast, Market Share Overview. It is also available for immediate download and adjustment. So, changes can be made in the color, design, graphics or any other component to create a unique layout.

Improving Corporate Performance Sales Opportunity Monitoring Dashboard Portrait PDF
This graph or chart is linked to excel, and changes automatically based on data. Just left click on it and select Edit Data. Welcome to our selection of the Improving Corporate Performance Sales Opportunity Monitoring Dashboard Portrait PDF. These are designed to help you showcase your creativity and bring your sphere to life. Planning and Innovation are essential for any business that is just starting out. This collection contains the designs that you need for your everyday presentations. All of our PowerPoints are 100 percent editable, so you can customize them to suit your needs. This multi-purpose template can be used in various situations. Grab these presentation templates today.
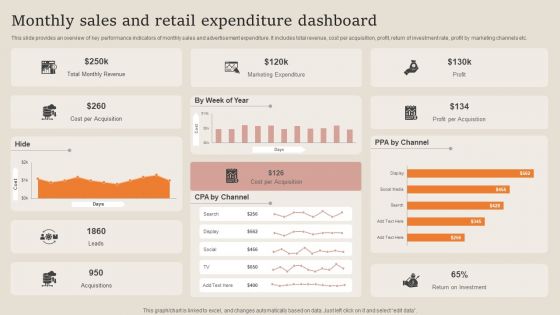
Monthly Sales And Retail Expenditure Dashboard Summary PDF
This slide provides an overview of key performance indicators of monthly sales and advertisement expenditure. It includes total revenue, cost per acquisition, profit, return of investment rate, profit by marketing channels etc. Pitch your topic with ease and precision using this Monthly Sales And Retail Expenditure Dashboard Summary PDF. This layout presents information on Marketing Expenditure, Revenue, Cost Per Acquisition. It is also available for immediate download and adjustment. So, changes can be made in the color, design, graphics or any other component to create a unique layout.
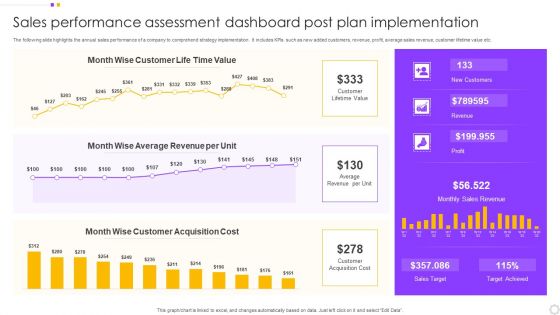
Sales Performance Assessment Dashboard Post Plan Implementation Introduction PDF
The following slide highlights the annual sales performance of a company to comprehend strategy implementation. It includes KPIs such as new added customers, revenue, profit, average sales revenue, customer lifetime value etc. Pitch your topic with ease and precision using this Sales Performance Assessment Dashboard Post Plan Implementation Introduction PDF. This layout presents information on Customer, Value, Average Revenue. It is also available for immediate download and adjustment. So, changes can be made in the color, design, graphics or any other component to create a unique layout.
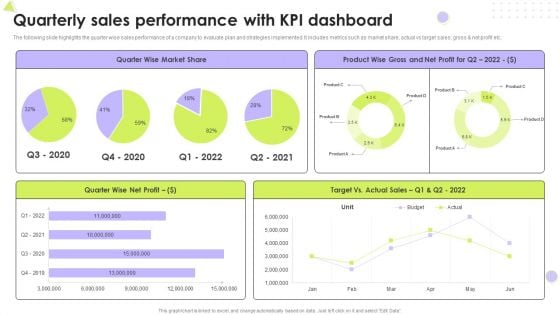
Quarterly Sales Performance With Kpi Dashboard Introduction PDF
The following slide highlights the quarter wise sales performance of a company to evaluate plan and strategies implemented. It includes metrics such as market share, actual vs target sales, gross and net profit etc. Pitch your topic with ease and precision using this Quarterly Sales Performance With Kpi Dashboard Introduction PDF. This layout presents information on Market Share, Net Profit, Target. It is also available for immediate download and adjustment. So, changes can be made in the color, design, graphics or any other component to create a unique layout.
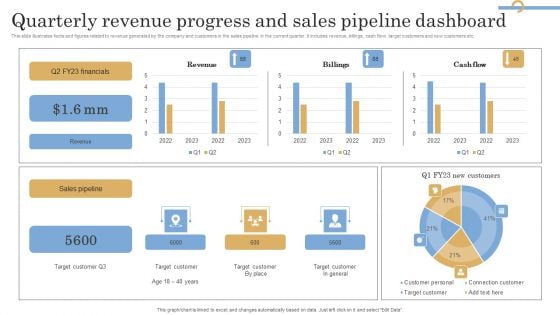
Quarterly Revenue Progress And Sales Pipeline Dashboard Information PDF
This slide illustrates facts and figures related to revenue generated by the company and customers in the sales pipeline in the current quarter. It includes revenue, billings, cash flow, target customers and new customers etc. Showcasing this set of slides titled Quarterly Revenue Progress And Sales Pipeline Dashboard Information PDF. The topics addressed in these templates are Financials, Revenue, Sales Pipeline. All the content presented in this PPT design is completely editable. Download it and make adjustments in color, background, font etc. as per your unique business setting.
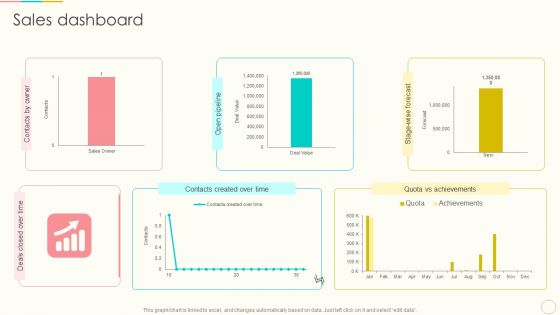
Lead Management To Engage Potential Customers Sales Dashboard Themes PDF
Do you know about Slidesgeeks Lead Management To Engage Potential Customers Sales Dashboard Themes PDF These are perfect for delivering any kind od presentation. Using it, create PowerPoint presentations that communicate your ideas and engage audiences. Save time and effort by using our pre designed presentation templates that are perfect for a wide range of topic. Our vast selection of designs covers a range of styles, from creative to business, and are all highly customizable and easy to edit. Download as a PowerPoint template or use them as Google Slides themes.
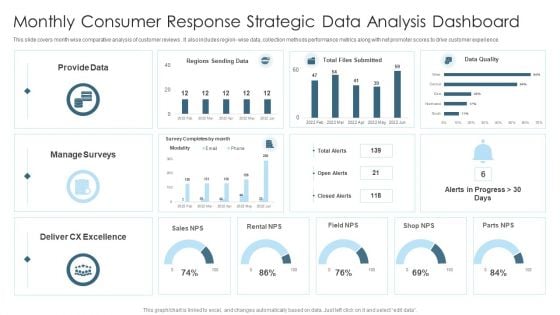
Monthly Consumer Response Strategic Data Analysis Dashboard Graphics PDF
This slide covers month wise comparative analysis of customer reviews . It also includes region wise data, collection methods performance metrics along with net promoter scores to drive customer experience. Showcasing this set of slides titled Monthly Consumer Response Strategic Data Analysis Dashboard Graphics PDF. The topics addressed in these templates are Provide Data, Sales, Manage Surveys. All the content presented in this PPT design is completely editable. Download it and make adjustments in color, background, font etc. as per your unique business setting.
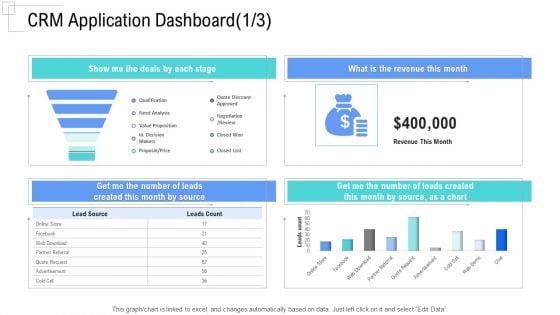
Managing Customer Experience CRM Application Dashboard Month Mockup PDF
This graph or chart is linked to excel, and changes automatically based on data. Just left click on it and select Edit Data.Deliver an awe-inspiring pitch with this creative managing customer experience crm application dashboard month mockup pdf bundle. Topics like show me the deals by each stage, what is the revenue this month, get me the number of leads created this month by source can be discussed with this completely editable template. It is available for immediate download depending on the needs and requirements of the user.
Data Structure IT Data Structure Performance Tracking Dashboard Diagrams PDF
Slidegeeks is here to make your presentations a breeze with Data Structure IT Data Structure Performance Tracking Dashboard Diagrams PDF With our easy-to-use and customizable templates, you can focus on delivering your ideas rather than worrying about formatting. With a variety of designs to choose from, youre sure to find one that suits your needs. And with animations and unique photos, illustrations, and fonts, you can make your presentation pop. So whether youre giving a sales pitch or presenting to the board, make sure to check out Slidegeeks first.
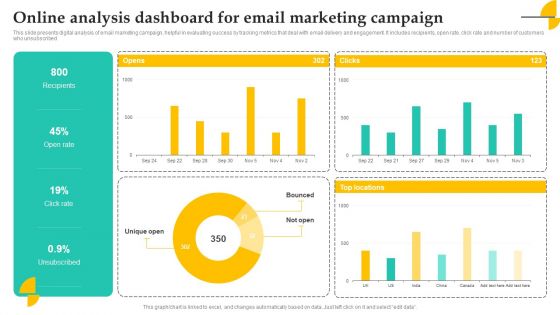
Online Analysis Dashboard For Email Marketing Campaign Elements PDF
This slide presents digital analysis of email marketing campaign, helpful in evaluating success by tracking metrics that deal with email delivery and engagement. It includes recipients, open rate, click rate and number of customers who unsubscribed Showcasing this set of slides titled Online Analysis Dashboard For Email Marketing Campaign Elements PDF. The topics addressed in these templates are Recipients, Open Rate, Campaign. All the content presented in this PPT design is completely editable. Download it and make adjustments in color, background, font etc. as per your unique business setting.
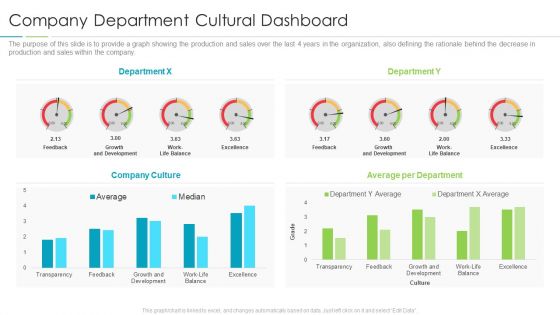
Refining Company Ethos Company Department Cultural Dashboard Rules PDF
The purpose of this slide is to provide a graph showing the production and sales over the last 4 years in the organization, also defining the rationale behind the decrease in production and sales within the company. Deliver an awe inspiring pitch with this creative refining company ethos company department cultural dashboard rules pdf bundle. Topics like growth, development, excellence, culture can be discussed with this completely editable template. It is available for immediate download depending on the needs and requirements of the user.
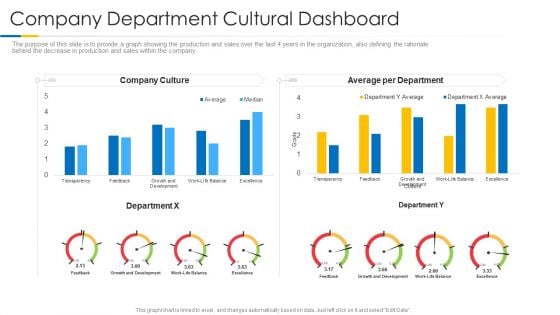
Building Efficient Work Environment Company Department Cultural Dashboard Guidelines PDF
The purpose of this slide is to provide a graph showing the production and sales over the last 4 years in the organization, also defining the rationale behind the decrease in production and sales within the company. Deliver an awe inspiring pitch with this creative building efficient work environment company department cultural dashboard guidelines pdf bundle. Topics like growth, development, excellence, culture can be discussed with this completely editable template. It is available for immediate download depending on the needs and requirements of the user.
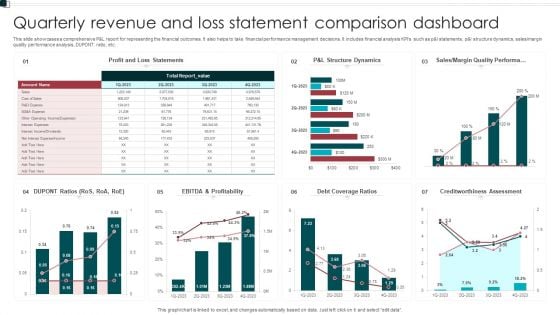
Quarterly Revenue And Loss Statement Comparison Dashboard Portrait PDF
This slide showcases a comprehensive P and L report for representing the financial outcomes. It also helps to take financial performance management decisions. It includes financial analysis KPIs such as p and l statements, p and l structure dynamics, sales or margin quality performance analysis, DUPONT ratio, etc. Showcasing this set of slides titled Quarterly Revenue And Loss Statement Comparison Dashboard Portrait PDF. The topics addressed in these templates are Profitability, Debt Coverage Ratios, Margin Quality Performa. All the content presented in this PPT design is completely editable. Download it and make adjustments in color, background, font etc. as per your unique business setting.
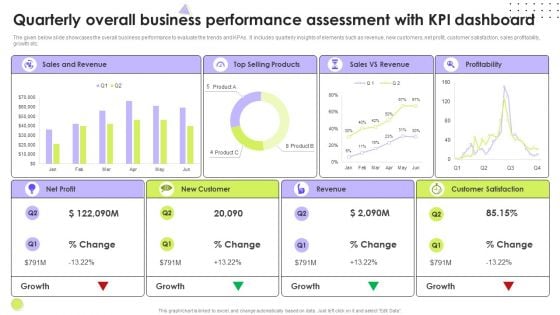
Quarterly Overall Business Performance Assessment With Kpi Dashboard Microsoft PDF
The given below slide showcases the overall business performance to evaluate the trends and KPAs. It includes quarterly insights of elements such as revenue, new customers, net profit, customer satisfaction, sales profitability, growth etc. Pitch your topic with ease and precision using this Quarterly Overall Business Performance Assessment With Kpi Dashboard Microsoft PDF. This layout presents information on Revenue, Customer Satisfaction, Net Profit. It is also available for immediate download and adjustment. So, changes can be made in the color, design, graphics or any other component to create a unique layout.
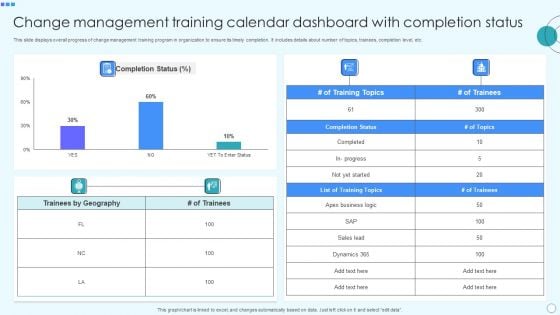
Change Management Training Calendar Dashboard With Completion Status Portrait PDF
This slide displays overall progress of change management training program in organization to ensure its timely completion. It includes details about number of topics, trainees, completion level, etc. Pitch your topic with ease and precision using this Change Management Training Calendar Dashboard With Completion Status Portrait PDF. This layout presents information on Business Logic, Geography, Completion Status, Sales Lead, Dynamics. It is also available for immediate download and adjustment. So, changes can be made in the color, design, graphics or any other component to create a unique layout.
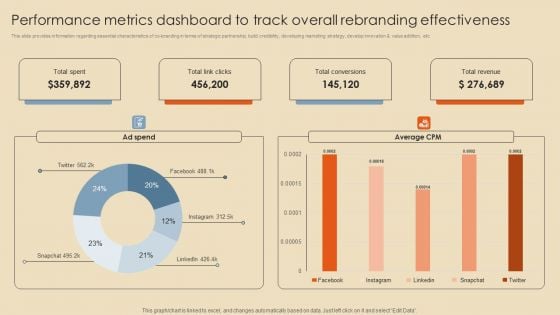
Performance Metrics Dashboard To Track Overall Rebranding Effectiveness Professional PDF
This slide provides information regarding essential characteristics of co-branding in terms of strategic partnership, build credibility, developing marketing strategy, develop innovation and value addition, etc. Make sure to capture your audiences attention in your business displays with our gratis customizable Performance Metrics Dashboard To Track Overall Rebranding Effectiveness Professional PDF. These are great for business strategies, office conferences, capital raising or task suggestions. If you desire to acquire more customers for your tech business and ensure they stay satisfied, create your own sales presentation with these plain slides.
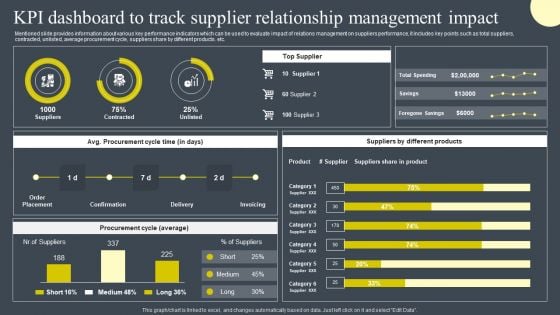
KPI Dashboard To Track Supplier Relationship Management Impact Inspiration PDF
Mentioned slide provides information about various key performance indicators which can be used to evaluate impact of relations management on suppliers performance, it includes key points such as total suppliers, contracted, unlisted, average procurement cycle, suppliers share by different products. etc. Slidegeeks has constructed KPI Dashboard To Track Supplier Relationship Management Impact Inspiration PDF after conducting extensive research and examination. These presentation templates are constantly being generated and modified based on user preferences and critiques from editors. Here, you will find the most attractive templates for a range of purposes while taking into account ratings and remarks from users regarding the content. This is an excellent jumping-off point to explore our content and will give new users an insight into our top-notch PowerPoint Templates.
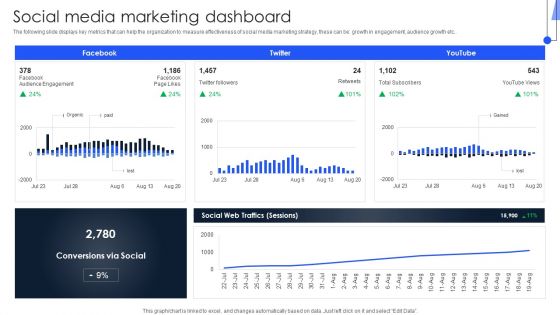
Implementing Marketing Strategies Social Media Marketing Dashboard Diagrams PDF
The following slide displays key metrics that can help the organization to measure effectiveness of social media marketing strategy, these can be growth in engagement, audience growth etc. Slidegeeks is here to make your presentations a breeze with Implementing Marketing Strategies Social Media Marketing Dashboard Diagrams PDF With our easy-to-use and customizable templates, you can focus on delivering your ideas rather than worrying about formatting. With a variety of designs to choose from, youre sure to find one that suits your needs. And with animations and unique photos, illustrations, and fonts, you can make your presentation pop. So whether youre giving a sales pitch or presenting to the board, make sure to check out Slidegeeks first.
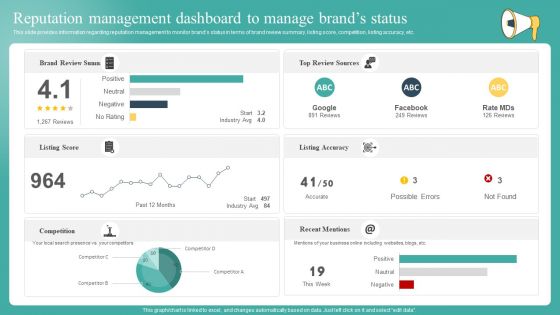
Reputation Management Dashboard To Manage Brands Status Designs PDF
This slide provides information regarding reputation management to monitor brands status in terms of brand review summary, listing score, competition, listing accuracy, etc. Slidegeeks is here to make your presentations a breeze with Reputation Management Dashboard To Manage Brands Status Designs PDF With our easy to use and customizable templates, you can focus on delivering your ideas rather than worrying about formatting. With a variety of designs to choose from, you are sure to find one that suits your needs. And with animations and unique photos, illustrations, and fonts, you can make your presentation pop. So whether you are giving a sales pitch or presenting to the board, make sure to check out Slidegeeks first.
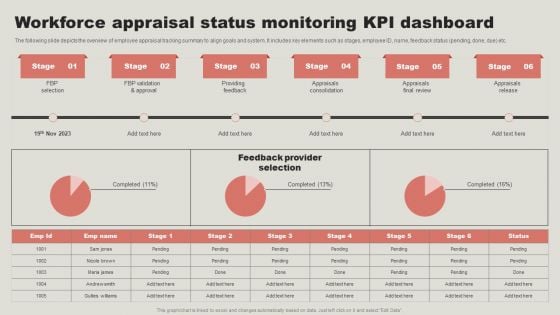
Workforce Appraisal Status Monitoring Kpi Dashboard Template PDF
The following slide depicts the overview of employee appraisal tracking summary to align goals and system. It includes key elements such as stages, employee ID, name, feedback status pending, done, due etc. Slidegeeks is here to make your presentations a breeze with Workforce Appraisal Status Monitoring Kpi Dashboard Template PDF With our easy to use and customizable templates, you can focus on delivering your ideas rather than worrying about formatting. With a variety of designs to choose from, you are sure to find one that suits your needs. And with animations and unique photos, illustrations, and fonts, you can make your presentation pop. So whether you are giving a sales pitch or presenting to the board, make sure to check out Slidegeeks first.

Maintenance KPI Dashboard Ppt PowerPoint Presentation Complete Deck With Slides
Share a great deal of information on the topic by deploying this Maintenance KPI Dashboard Ppt PowerPoint Presentation Complete Deck With Slides. Support your ideas and thought process with this prefabricated set. It includes a set of twelve slides, all fully modifiable and editable. Each slide can be restructured and induced with the information and content of your choice. You can add or remove large content boxes as well, to make this PPT slideshow more personalized. Its high-quality graphics and visuals help in presenting a well-coordinated pitch. This PPT template is also a resourceful tool to take visual cues from and implement the best ideas to help your business grow and expand. The main attraction of this well-formulated deck is that everything is editable, giving you the freedom to adjust it to your liking and choice. Changes can be made in the background and theme as well to deliver an outstanding pitch. Therefore, click on the download button now to gain full access to this multifunctional set.

Organizational Headcount Dashboard Ppt PowerPoint Presentation Complete With Slides
Share a great deal of information on the topic by deploying this Organizational Headcount Dashboard Ppt PowerPoint Presentation Complete With Slides. Support your ideas and thought process with this prefabricated set. It includes a set of tweleve slides, all fully modifiable and editable. Each slide can be restructured and induced with the information and content of your choice. You can add or remove large content boxes as well, to make this PPT slideshow more personalized. Its high-quality graphics and visuals help in presenting a well-coordinated pitch. This PPT template is also a resourceful tool to take visual cues from and implement the best ideas to help your business grow and expand. The main attraction of this well-formulated deck is that everything is editable, giving you the freedom to adjust it to your liking and choice. Changes can be made in the background and theme as well to deliver an outstanding pitch. Therefore, click on the download button now to gain full access to this multifunctional set.
Performance Monitoring Dashboard Ppt PowerPoint Presentation Complete Deck With Slides
Share a great deal of information on the topic by deploying this Performance Monitoring Dashboard Ppt PowerPoint Presentation Complete Deck With Slides. Support your ideas and thought process with this prefabricated set. It includes a set of twelve slides, all fully modifiable and editable. Each slide can be restructured and induced with the information and content of your choice. You can add or remove large content boxes as well, to make this PPT slideshow more personalized. Its high-quality graphics and visuals help in presenting a well-coordinated pitch. This PPT template is also a resourceful tool to take visual cues from and implement the best ideas to help your business grow and expand. The main attraction of this well-formulated deck is that everything is editable, giving you the freedom to adjust it to your liking and choice. Changes can be made in the background and theme as well to deliver an outstanding pitch. Therefore, click on the download button now to gain full access to this multifunctional set.
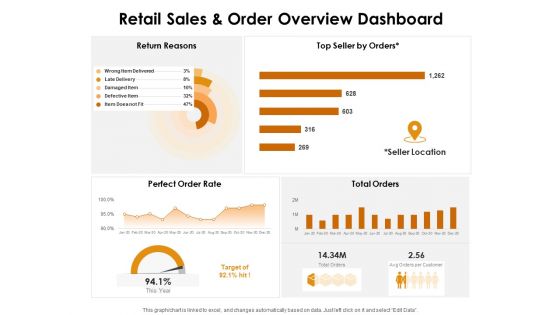
KPI Dashboards Per Industry Retail Sales And Order Overview Dashboard Ppt PowerPoint Presentation Infographic Template Master Slide PDF
Deliver and pitch your topic in the best possible manner with this kpi dashboards per industry retail sales and order overview dashboard ppt powerpoint presentation infographic template master slide pdf. Use them to share invaluable insights on return reasons, top seller orders, perfect order rate, total orders, seller location and impress your audience. This template can be altered and modified as per your expectations. So, grab it now.
Online Purchase Comparison For Various Countries Ppt Layouts Icons PDF
This slide shows the purchasing products online comparison with previous month in coronavirus pandemic which includes Global, COVID-19, E-commerce, growth in E-commerce market will increase, etc. Deliver an awe-inspiring pitch with this creative online purchase comparison for various countries ppt layouts icons pdf bundle. Topics like businesses, market report, growth, e commerce can be discussed with this completely editable template. It is available for immediate download depending on the needs and requirements of the user.
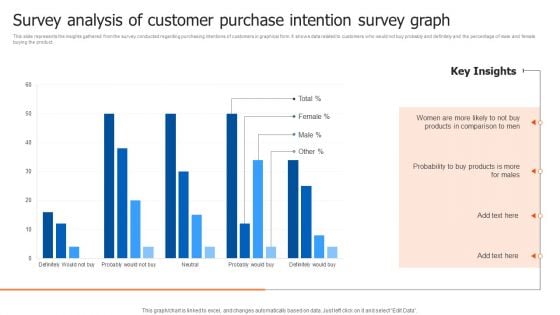
Survey Analysis Of Customer Purchase Intention Survey Graph Structure PDF
This slide represents the insights gathered from the survey conducted regarding purchasing intentions of customers in graphical form. It shows data related to customers who would not buy probably and definitely and the percentage of male and female buying the product. Pitch your topic with ease and precision using this Survey Analysis Of Customer Purchase Intention Survey Graph Structure PDF. This layout presents information on Probability, Products, Key Insights. It is also available for immediate download and adjustment. So, changes can be made in the color, design, graphics or any other component to create a unique layout.
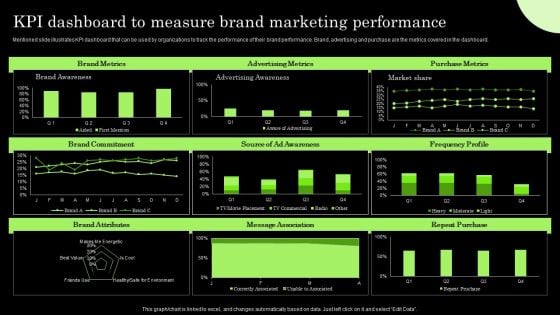
Tactical Brand Extension Launching Kpi Dashboard To Measure Brand Marketing Professional PDF
Mentioned slide illustrates KPI dashboard that can be used by organizations to track the performance of their brand performance. Brand, advertising and purchase are the metrics covered in the dashboard. Get a simple yet stunning designed Tactical Brand Extension Launching Kpi Dashboard To Measure Brand Marketing Professional PDF. It is the best one to establish the tone in your meetings. It is an excellent way to make your presentations highly effective. So, download this PPT today from Slidegeeks and see the positive impacts. Our easy-to-edit Tactical Brand Extension Launching Kpi Dashboard To Measure Brand Marketing Professional PDF can be your go-to option for all upcoming conferences and meetings. So, what are you waiting for Grab this template today.
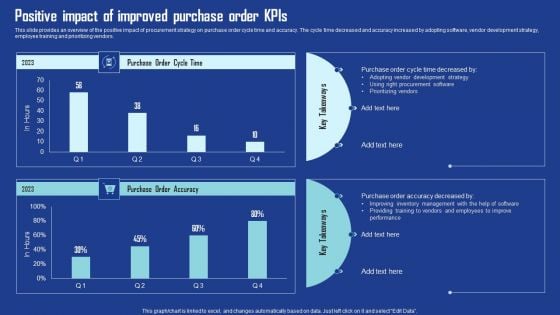
Positive Impact Of Improved Purchase Order Kpis Ideas PDF
This slide provides an overview of the positive impact of procurement strategy on purchase order cycle time and accuracy. The cycle time decreased and accuracy increased by adopting software, vendor development strategy, employee training and prioritizing vendors. Presenting this PowerPoint presentation, titled Positive Impact Of Improved Purchase Order Kpis Ideas PDF, with topics curated by our researchers after extensive research. This editable presentation is available for immediate download and provides attractive features when used. Download now and captivate your audience. Presenting this Positive Impact Of Improved Purchase Order Kpis Ideas PDF. Our researchers have carefully researched and created these slides with all aspects taken into consideration. This is a completely customizable Positive Impact Of Improved Purchase Order Kpis Ideas PDF that is available for immediate downloading. Download now and make an impact on your audience. Highlight the attractive features available with our PPTs.
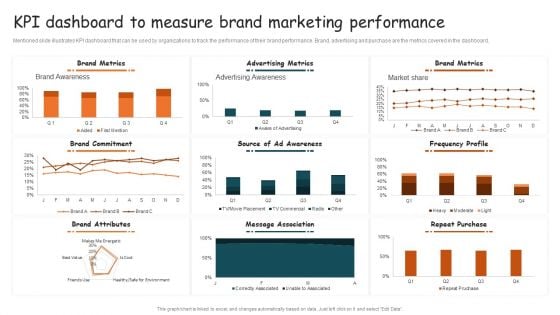
Guide For Brand Kpi Dashboard To Measure Brand Marketing Performance Professional PDF
Mentioned slide illustrates KPI dashboard that can be used by organizations to track the performance of their brand performance. Brand, advertising and purchase are the metrics covered in the dashboard. Slidegeeks is here to make your presentations a breeze with Guide For Brand Kpi Dashboard To Measure Brand Marketing Performance Professional PDF With our easy-to-use and customizable templates, you can focus on delivering your ideas rather than worrying about formatting. With a variety of designs to choose from, youre sure to find one that suits your needs. And with animations and unique photos, illustrations, and fonts, you can make your presentation pop. So whether youre giving a sales pitch or presenting to the board, make sure to check out Slidegeeks first.

Strategic Guide For Positioning Expanded Brand KPI Dashboard To Measure Brand Marketing Performance Graphics PDF
Mentioned slide illustrates KPI dashboard that can be used by organizations to track the performance of their brand performance. Brand, advertising and purchase are the metrics covered in the dashboard. Are you in need of a template that can accommodate all of your creative concepts. This one is crafted professionally and can be altered to fit any style. Use it with Google Slides or PowerPoint. Include striking photographs, symbols, depictions, and other visuals. Fill, move around, or remove text boxes as desired. Test out color palettes and font mixtures. Edit and save your work, or work with colleagues. Download Strategic Guide For Positioning Expanded Brand KPI Dashboard To Measure Brand Marketing Performance Graphics PDF and observe how to make your presentation outstanding. Give an impeccable presentation to your group and make your presentation unforgettable.
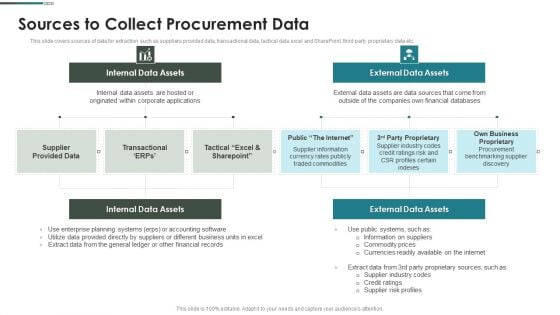
Purchase Assessment Process Sources To Collect Procurement Data Diagrams PDF
This slide covers sources of data for extraction such as suppliers provided data, transactional data, tactical data excel and SharePoint, third party proprietary data etc.Deliver an awe inspiring pitch with this creative Purchase Assessment Process Sources To Collect Procurement Data Diagrams PDF bundle. Topics like Internal Data, External Data, Data Assets can be discussed with this completely editable template. It is available for immediate download depending on the needs and requirements of the user.
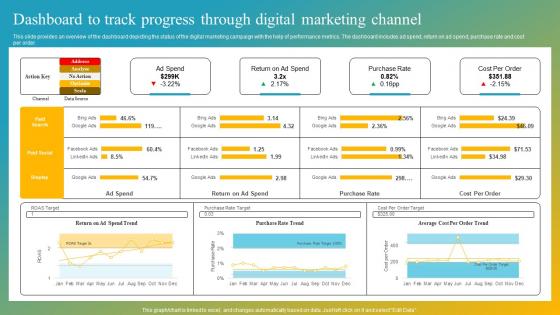
Effective Customer Engagement With Direct Response Dashboard To Track Progress Professional Pdf
This slide provides an overview of the dashboard depicting the status of the digital marketing campaign with the help of performance metrics. The dashboard includes ad spend, return on ad spend, purchase rate and cost per order. Crafting an eye-catching presentation has never been more straightforward. Let your presentation shine with this tasteful yet straightforward Effective Customer Engagement With Direct Response Dashboard To Track Progress Professional Pdf template. It offers a minimalistic and classy look that is great for making a statement. The colors have been employed intelligently to add a bit of playfulness while still remaining professional. Construct the ideal Effective Customer Engagement With Direct Response Dashboard To Track Progress Professional Pdf that effortlessly grabs the attention of your audience. Begin now and be certain to wow your customers. This slide provides an overview of the dashboard depicting the status of the digital marketing campaign with the help of performance metrics. The dashboard includes ad spend, return on ad spend, purchase rate and cost per order.
Social Media Marketing To Boost Dashboard To Track Progress Through Digital Sample Pdf
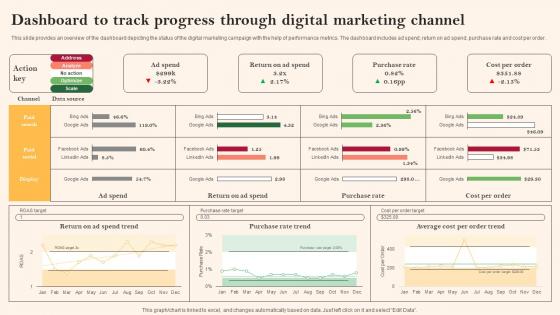
This slide provides an overview of the dashboard depicting the status of the digital marketing campaign with the help of performance metrics. The dashboard includes ad spend, return on ad spend, purchase rate and cost per order. Are you in need of a template that can accommodate all of your creative concepts This one is crafted professionally and can be altered to fit any style. Use it with Google Slides or PowerPoint. Include striking photographs, symbols, depictions, and other visuals. Fill, move around, or remove text boxes as desired. Test out color palettes and font mixtures. Edit and save your work, or work with colleagues. Download Social Media Marketing To Boost Dashboard To Track Progress Through Digital Sample Pdf and observe how to make your presentation outstanding. Give an impeccable presentation to your group and make your presentation unforgettable. This slide provides an overview of the dashboard depicting the status of the digital marketing campaign with the help of performance metrics. The dashboard includes ad spend, return on ad spend, purchase rate and cost per order.
Digital And Offline Marketing Campaign Comparison Dashboard Ppt Inspiration Microsoft PDF
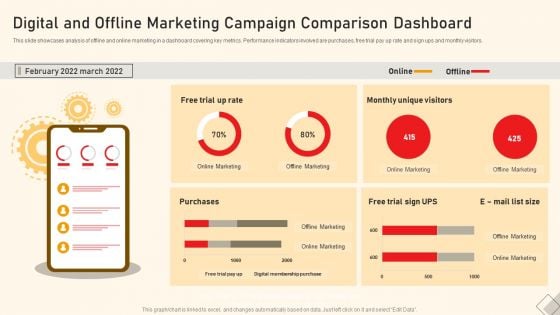
This slide showcases analysis of offline and online marketing in a dashboard covering key metrics. Performance indicators involved are purchases, free trial pay up rate and sign ups and monthly visitors. Pitch your topic with ease and precision using this Digital And Offline Marketing Campaign Comparison Dashboard Ppt Inspiration Microsoft PDF. This layout presents information on Online Marketing, Offline Marketing, Free Trial Sign, UPS. It is also available for immediate download and adjustment. So, changes can be made in the color, design, graphics or any other component to create a unique layout.


 Continue with Email

 Home
Home


