Report Icon
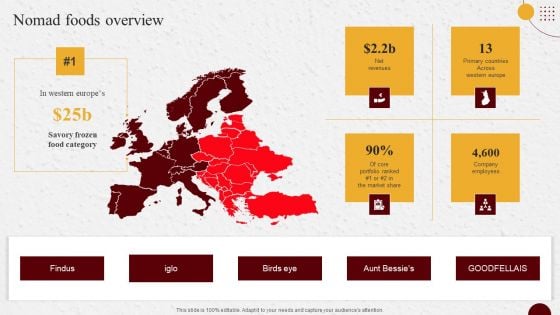
Industry Report Of Packaged Food Products Part 2 Nomad Foods Overview Diagrams PDF
Retrieve professionally designed Industry Report Of Packaged Food Products Part 2 Nomad Foods Overview Diagrams PDF to effectively convey your message and captivate your listeners. Save time by selecting pre made slideshows that are appropriate for various topics, from business to educational purposes. These themes come in many different styles, from creative to corporate, and all of them are easily adjustable and can be edited quickly. Access them as PowerPoint templates or as Google Slides themes. You do not have to go on a hunt for the perfect presentation because Slidegeeks got you covered from everywhere.
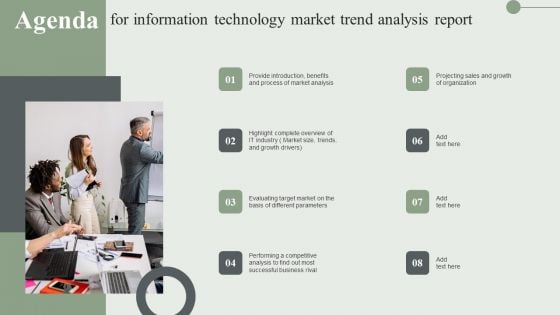
Agenda For Information Technology Market Trend Analysis Report Ppt PowerPoint Presentation File Diagrams PDF
Retrieve professionally designed Agenda For Information Technology Market Trend Analysis Report Ppt PowerPoint Presentation File Diagrams PDF to effectively convey your message and captivate your listeners. Save time by selecting pre made slideshows that are appropriate for various topics, from business to educational purposes. These themes come in many different styles, from creative to corporate, and all of them are easily adjustable and can be edited quickly. Access them as PowerPoint templates or as Google Slides themes. You do not have to go on a hunt for the perfect presentation because Slidegeeks got you covered from everywhere.
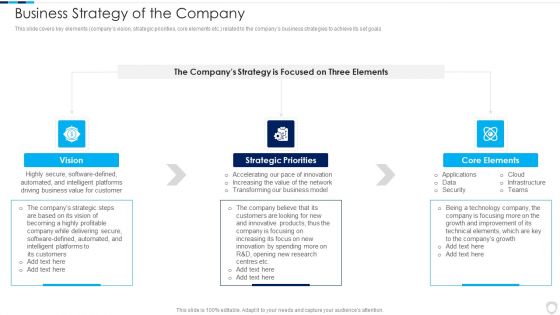
Financial Report Of An IT Firm Business Strategy Of The Company Themes PDF
This slide covers key elements companys vision, strategic priorities, core elements etc. related to the companys business strategies to achieve its set goals.Presenting Financial Report Of An IT Firm Business Strategy Of The Company Themes PDF to provide visual cues and insights. Share and navigate important information on three stages that need your due attention. This template can be used to pitch topics like Strategic Priorities, Core Elements, Growth Improvement In addtion, this PPT design contains high resolution images, graphics, etc, that are easily editable and available for immediate download.
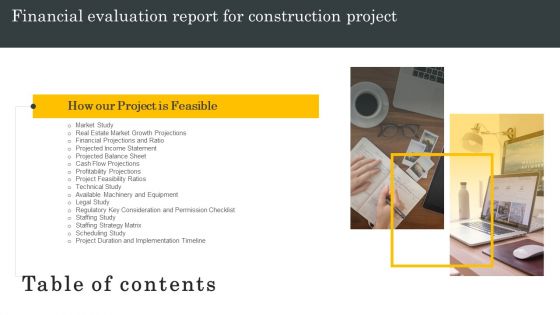
Table Of Contents Financial Evaluation Report For Construction Project Diagrams PDF
Do you know about Slidesgeeks Table Of Contents Financial Evaluation Report For Construction Project Diagrams PDF These are perfect for delivering any kind od presentation. Using it, create PowerPoint presentations that communicate your ideas and engage audiences. Save time and effort by using our pre-designed presentation templates that are perfect for a wide range of topic. Our vast selection of designs covers a range of styles, from creative to business, and are all highly customizable and easy to edit. Download as a PowerPoint template or use them as Google Slides themes.
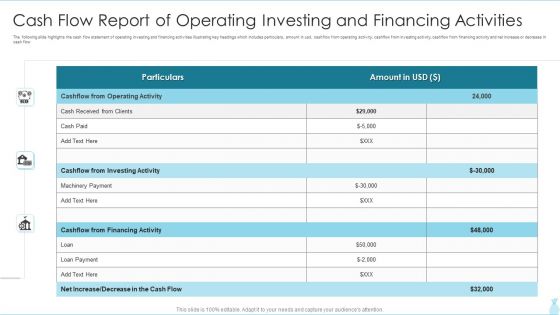
Cash Flow Report Of Operating Investing And Financing Activities Themes PDF
The following slide highlights the cash flow statement of operating investing and financing activities illustrating key headings which includes particulars, amount in usd, cashflow from operating activity, cashflow from investing activity, cashflow from financing activity and net increase or decrease in cash flow.Showcasing this set of slides titled Cash Flow Report Of Operating Investing And Financing Activities Themes PDF The topics addressed in these templates are Operating Activity, Financing Activity, Increase Or Decrease All the content presented in this PPT design is completely editable. Download it and make adjustments in color, background, font etc. as per your unique business setting.
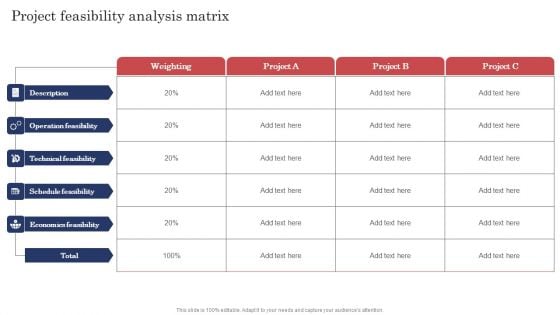
Construction Project Cost Benefit Analysis Report Project Feasibility Analysis Matrix Themes PDF
Welcome to our selection of the Construction Project Cost Benefit Analysis Report Project Feasibility Analysis Matrix Themes PDF. These are designed to help you showcase your creativity and bring your sphere to life. Planning and Innovation are essential for any business that is just starting out. This collection contains the designs that you need for your everyday presentations. All of our PowerPoints are 100 percent editable, so you can customize them to suit your needs. This multi purpose template can be used in various situations. Grab these presentation templates today.
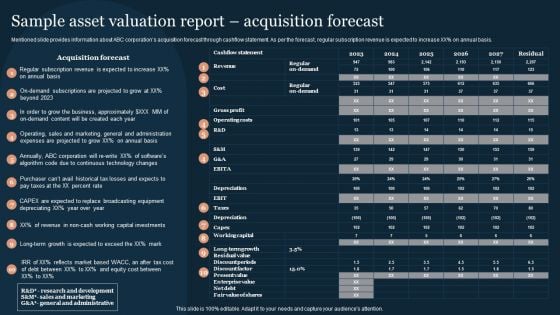
Guide To Develop And Estimate Brand Value Sample Asset Valuation Report Acquisition Forecast Themes PDF
Mentioned slide provides information about ABC corporations acquisition forecast through cashflow statement. As per the forecast, regular subscription revenue is expected to increase XX precent on annual basis.Want to ace your presentation in front of a live audience Our Guide To Develop And Estimate Brand Value Sample Asset Valuation Report Acquisition Forecast Themes PDF can help you do that by engaging all the users towards you. Slidegeeks experts have put their efforts and expertise into creating these impeccable powerpoint presentations so that you can communicate your ideas clearly. Moreover, all the templates are customizable, and easy-to-edit and downloadable. Use these for both personal and commercial use.
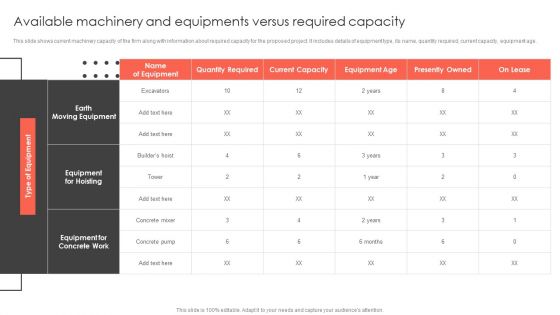
Available Machinery And Equipments Versus Required Capacity Construct Project Feasibility Analysis Report Themes PDF
This slide shows current machinery capacity of the firm along with information about required capacity for the proposed project. It includes details of equipment type, its name, quantity required, current capacity, equipment age. There are so many reasons you need a Available Machinery And Equipments Versus Required Capacity Construct Project Feasibility Analysis Report Themes PDF. The first reason is you can not spend time making everything from scratch, Thus, Slidegeeks has made presentation templates for you too. You can easily download these templates from our website easily.
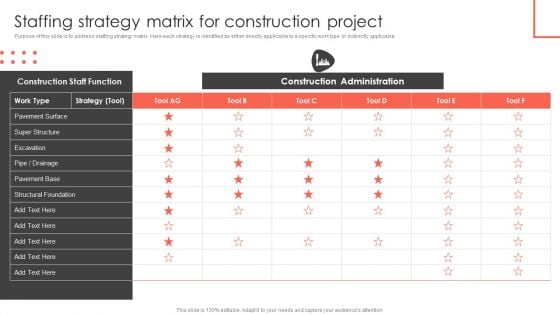
Staffing Strategy Matrix For Construction Project Construct Project Feasibility Analysis Report Themes PDF
Purpose of this slide is to address staffing strategy matrix. Here each strategy is identified as either directly applicable to a specific work type or indirectly applicable. The Staffing Strategy Matrix For Construction Project Construct Project Feasibility Analysis Report Themes PDF is a compilation of the most recent design trends as a series of slides. It is suitable for any subject or industry presentation, containing attractive visuals and photo spots for businesses to clearly express their messages. This template contains a variety of slides for the user to input data, such as structures to contrast two elements, bullet points, and slides for written information. Slidegeeks is prepared to create an impression.
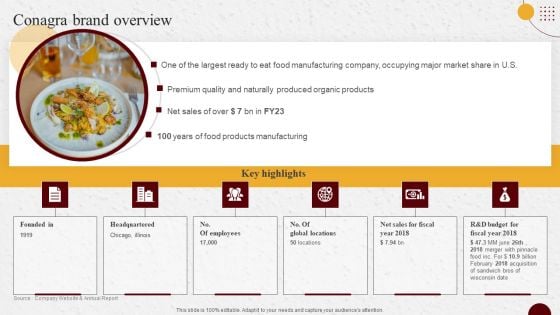
Industry Report Of Packaged Food Products Part 2 Conagra Brand Overview Themes PDF
Present like a pro with Industry Report Of Packaged Food Products Part 2 Conagra Brand Overview Themes PDF Create beautiful presentations together with your team, using our easy to use presentation slides. Share your ideas in real time and make changes on the fly by downloading our templates. So whether you are in the office, on the go, or in a remote location, you can stay in sync with your team and present your ideas with confidence. With Slidegeeks presentation got a whole lot easier. Grab these presentations today.
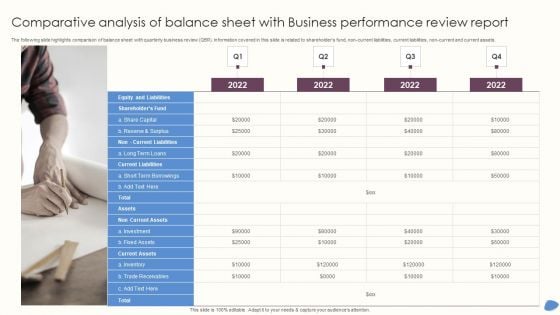
Comparative Analysis Of Balance Sheet With Business Performance Review Report Background PDF
The following slide highlights comparison of balance sheet with quarterly business review QBR. Information covered in this slide is related to shareholders fund, non-current liabilities, current liabilities, non-current and current assets. Presenting Comparative Analysis Of Balance Sheet With Business Performance Review Report Background PDFto dispense important information. This template comprises four stages. It also presents valuable insights into the topics including Equity And Liabilities, 2022, Current Liabilities. This is a completely customizable PowerPoint theme that can be put to use immediately. So, download it and address the topic impactfully.
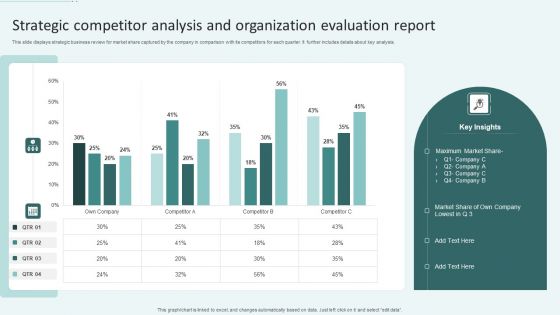
Strategic Competitor Analysis And Organization Evaluation Report Ppt Ideas Clipart Images PDF
This slide displays strategic business review for market share captured by the company in comparison with its competitors for each quarter. It further includes details about key analysis. Pitch your topic with ease and precision using this Strategic Competitor Analysis And Organization Evaluation Report Ppt Ideas Clipart Images PDF. This layout presents information on Maximum Market Share, Key Insights. It is also available for immediate download and adjustment. So, changes can be made in the color, design, graphics or any other component to create a unique layout.
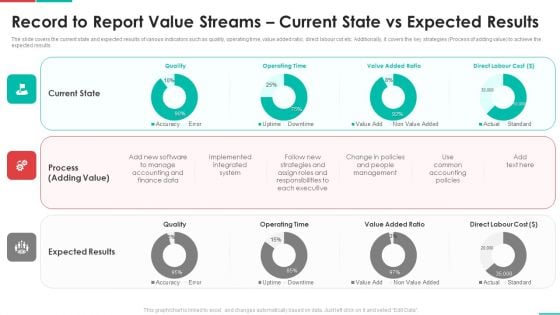
Roadmap For Financial Accounting Transformation Record To Report Value Streams Current State Professional PDF
The slide covers the current state and expected results of various indicators such as quality, operating time, value added ratio, direct labour cot etc. Additionally, it covers the key strategies Process of adding value to achieve the expected results. Deliver and pitch your topic in the best possible manner with this roadmap for financial accounting transformation record to report value streams current state professional pdf. Use them to share invaluable insights on current state, process, expected results and impress your audience. This template can be altered and modified as per your expectations. So, grab it now.
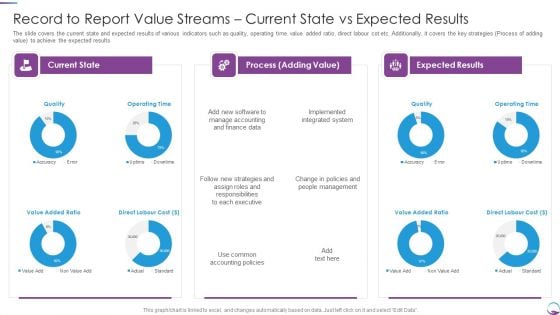
Record To Report Value Streams Current State Vs Expected Results Professional PDF
The slide covers the current state and expected results of various indicators such as quality, operating time, value added ratio, direct labour cot etc. Additionally, it covers the key strategies Process of adding value to achieve the expected results. Deliver and pitch your topic in the best possible manner with this Record To Report Value Streams Current State Vs Expected Results Professional PDF. Use them to share invaluable insights on Management, Strategies, Executive, Finance Data and impress your audience. This template can be altered and modified as per your expectations. So, grab it now.
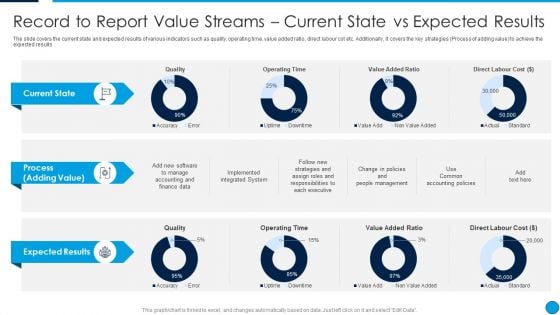
Summary Financial Record To Report Value Streams Current State Vs Expected Results Template PDF
The slide covers the current state and expected results of various indicators such as quality, operating time, value added ratio, direct labour cot etc. Additionally, it covers the key strategies Process of adding value to achieve the expected results. Deliver an awe inspiring pitch with this creative Summary Financial Record To Report Value Streams Current State Vs Expected Results Template PDF bundle. Topics like Current State, Process, Adding Value, Expected Results, Operating Time, Value Added Ratio can be discussed with this completely editable template. It is available for immediate download depending on the needs and requirements of the user.
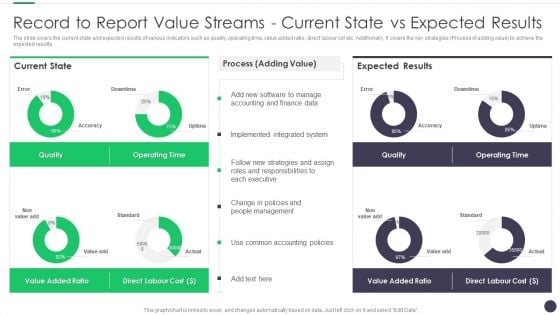
Finance And Accounting Online Conversion Plan Record To Report Value Streams Mockup PDF
The slide covers the current state and expected results of various indicators such as quality, operating time, value added ratio, direct labour cot etc. Additionally, it covers the key strategies Process of adding value to achieve the expected results. Deliver an awe inspiring pitch with this creative Finance And Accounting Online Conversion Plan Record To Report Value Streams Mockup PDF bundle. Topics like Operating Time, Process, Expected Results can be discussed with this completely editable template. It is available for immediate download depending on the needs and requirements of the user.
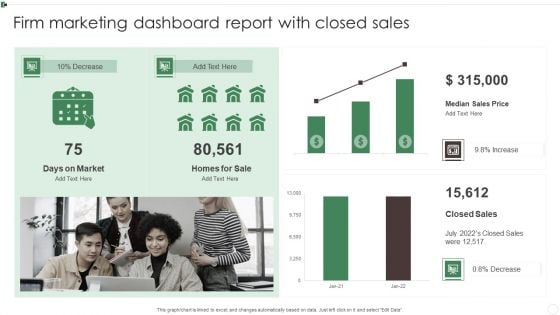
Firm Marketing Dashboard Report With Closed Sales Ppt Slides Graphics Example PDF
This graph or chart is linked to excel, and changes automatically based on data. Just left click on it and select Edit Data. Showcasing this set of slides titled Firm Marketing Dashboard Report With Closed Sales Ppt Slides Graphics Example PDF. The topics addressed in these templates are Days On Market, Homes For Sale, Median Sales Price, Closed Sales. All the content presented in this PPT design is completely editable. Download it and make adjustments in color, background, font etc. as per your unique business setting.
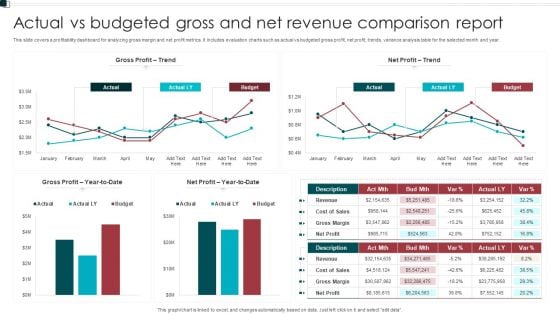
Actual Vs Budgeted Gross And Net Revenue Comparison Report Sample PDF
This slide covers a profitability dashboard for analyzing gross margin and net profit metrics. It includes evaluation charts such as actual vs budgeted gross profit, net profit, trends, variance analysis table for the selected month and year. Pitch your topic with ease and precision using this Actual Vs Budgeted Gross And Net Revenue Comparison Report Sample PDF. This layout presents information on Gross Profit, Net Profit, Budget. It is also available for immediate download and adjustment. So, changes can be made in the color, design, graphics or any other component to create a unique layout.
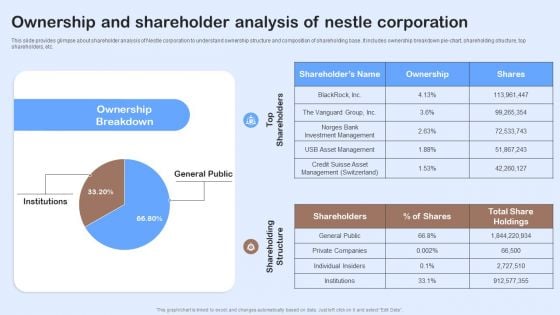
Nestle Performance Management Report Ownership And Shareholder Analysis Of Nestle Brochure PDF
This slide provides glimpse about shareholder analysis of Nestle corporation to understand ownership structure and composition of shareholding base. It includes ownership breakdown pie-chart, shareholding structure, top shareholders, etc. Boost your pitch with our creative Nestle Performance Management Report Ownership And Shareholder Analysis Of Nestle Brochure PDF. Deliver an awe-inspiring pitch that will mesmerize everyone. Using these presentation templates you will surely catch everyones attention. You can browse the ppts collection on our website. We have researchers who are experts at creating the right content for the templates. So you do not have to invest time in any additional work. Just grab the template now and use them.
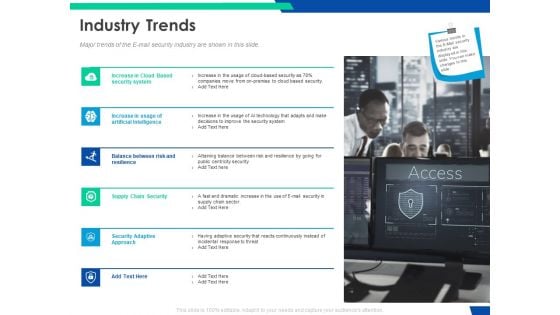
Cloud Based Email Security Market Report Industry Trends Ppt Styles Diagrams PDF
Major trends of the E mail security industry are shown in this slide. This is a cloud based email security market report industry trends ppt styles diagrams pdf template with various stages. Focus and dispense information on six stages using this creative set, that comes with editable features. It contains large content boxes to add your information on topics like security system, artificial intelligence, supply chain security, security adaptive approach. You can also showcase facts, figures, and other relevant content using this PPT layout. Grab it now.
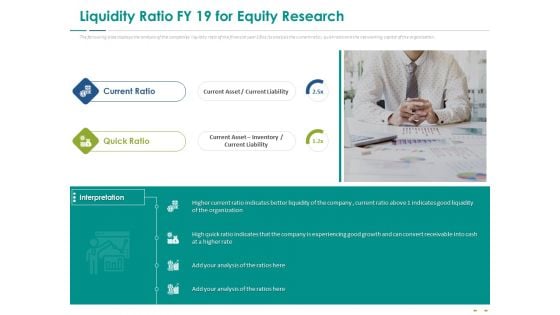
Stock Market Research Report Liquidity Ratio FY 19 For Equity Research Diagrams PDF
The following slide displays the analysis of the companies liquidity ratio of the financial year 19 as its analysis the current ratio, quick ratio and the net working capital of the organization. This is a stock market research report liquidity ratio fy 19 for equity research diagrams pdf template with various stages. Focus and dispense information on one stages using this creative set, that comes with editable features. It contains large content boxes to add your information on topics like current ratio, quick ratio, current asset, current liability, current asset, inventory, current liability. You can also showcase facts, figures, and other relevant content using this PPT layout. Grab it now.
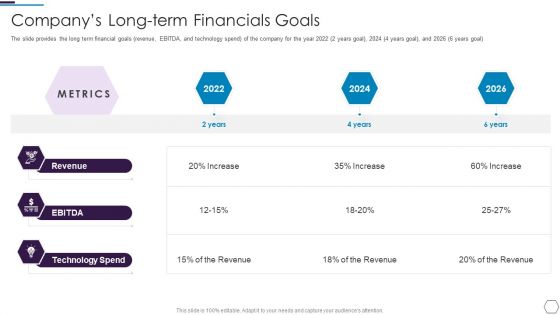
Information Technology Firm Report Example Companys Long Term Financials Goals Diagrams PDF
The slide provides the long term financial goals revenue, EBITDA, and technology spend of the company for the year 2022 2 years goal, 2024 4 years goal, and 2026 6 years goal. This is a Information Technology Firm Report Example Companys Long Term Financials Goals Diagrams PDF template with various stages. Focus and dispense information on four stages using this creative set, that comes with editable features. It contains large content boxes to add your information on topics like Revenue, Technology Spend, Increase You can also showcase facts, figures, and other relevant content using this PPT layout. Grab it now.
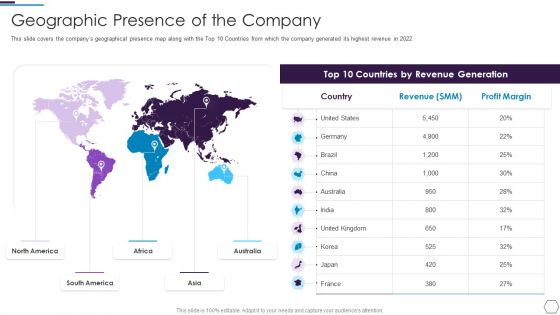
Information Technology Firm Report Example Geographic Presence Of The Company Diagrams PDF
This slide covers the companys geographical presence map along with the Top 10 Countries from which the company generated its highest revenue in 2022 Presenting Information Technology Firm Report Example Geographic Presence Of The Company Diagrams PDF to provide visual cues and insights. Share and navigate important information on five stages that need your due attention. This template can be used to pitch topics like Geographic, Presence Company In addtion, this PPT design contains high resolution images, graphics, etc, that are easily editable and available for immediate download.
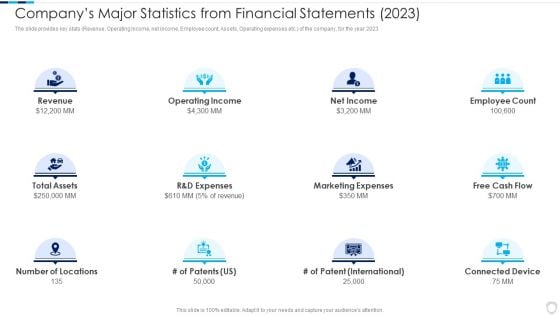
Financial Report Of An IT Firm Companys Major Statistics From Financial Statements 2023 Diagrams PDF
The slide provides key stats Revenue, Operating Income, net income, Employee count, Assets, Operating expenses etc. of the company, for the year 2023.This is a Financial Report Of An IT Firm Companys Major Statistics From Financial Statements 2023 Diagrams PDF template with various stages. Focus and dispense information on twelve stages using this creative set, that comes with editable features. It contains large content boxes to add your information on topics like Total Assets, Employee Count, Connected Device You can also showcase facts, figures, and other relevant content using this PPT layout. Grab it now.
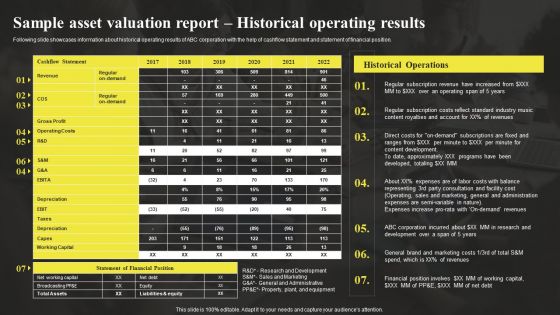
Sample Asset Valuation Report Historical Operating Results Sample Asset Valuation Summary Diagrams PDF
Following slide showcases information about historical operating results of ABC corporation with the help of cashflow statement and statement of financial position.Present like a pro with Sample Asset Valuation Report Historical Operating Results Sample Asset Valuation Summary Diagrams PDF Create beautiful presentations together with your team, using our easy-to-use presentation slides. Share your ideas in real-time and make changes on the fly by downloading our templates. So whether you are in the office, on the go, or in a remote location, you can stay in sync with your team and present your ideas with confidence. With Slidegeeks presentation got a whole lot easier. Grab these presentations today.
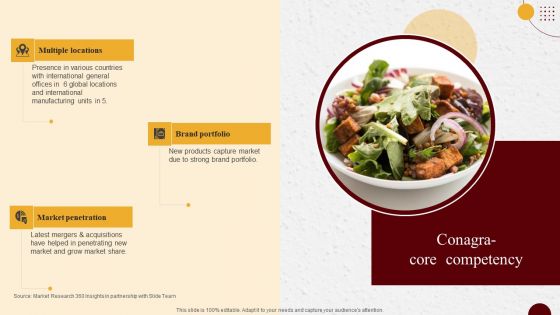
Industry Report Of Packaged Food Products Part 2 Conagra Core Competency Diagrams PDF
Slidegeeks is here to make your presentations a breeze with Industry Report Of Packaged Food Products Part 2 Conagra Core Competency Diagrams PDF With our easy to use and customizable templates, you can focus on delivering your ideas rather than worrying about formatting. With a variety of designs to choose from, you are sure to find one that suits your needs. And with animations and unique photos, illustrations, and fonts, you can make your presentation pop. So whether you are giving a sales pitch or presenting to the board, make sure to check out Slidegeeks first.
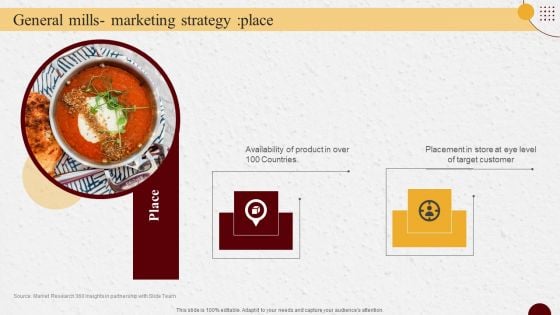
Industry Report Of Packaged Food Products Part 2 General Mills Marketing Strategy Place Diagrams PDF
Coming up with a presentation necessitates that the majority of the effort goes into the content and the message you intend to convey. The visuals of a PowerPoint presentation can only be effective if it supplements and supports the story that is being told. Keeping this in mind our experts created Industry Report Of Packaged Food Products Part 2 General Mills Marketing Strategy Place Diagrams PDF to reduce the time that goes into designing the presentation. This way, you can concentrate on the message while our designers take care of providing you with the right template for the situation.
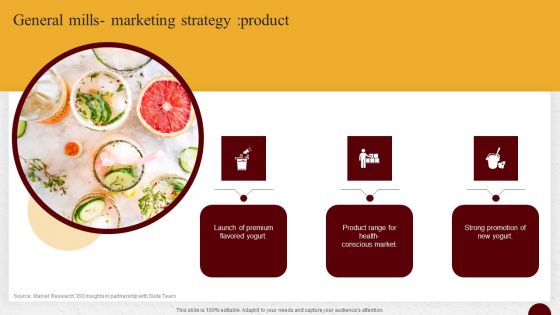
Industry Report Of Packaged Food Products Part 2 General Mills Marketing Strategy Product Diagrams PDF
This Industry Report Of Packaged Food Products Part 2 General Mills Marketing Strategy Product Diagrams PDF is perfect for any presentation, be it in front of clients or colleagues. It is a versatile and stylish solution for organizing your meetings. The product features a modern design for your presentation meetings. The adjustable and customizable slides provide unlimited possibilities for acing up your presentation. Slidegeeks has done all the homework before launching the product for you. So, do not wait, grab the presentation templates today

Nestle Performance Management Report Assessing Market Segmentation Of Nestle Diagrams PDF
This slide provides glimpse about market segmentation of Nestle SA to divide the market into smaller groups of consumers with similar characteristics. It includes segmentation types such as geographic, demographic, behavioural, psychographic, etc. Want to ace your presentation in front of a live audience Our Nestle Performance Management Report Assessing Market Segmentation Of Nestle Diagrams PDF can help you do that by engaging all the users towards you. Slidegeeks experts have put their efforts and expertise into creating these impeccable powerpoint presentations so that you can communicate your ideas clearly. Moreover, all the templates are customizable, and easy-to-edit and downloadable. Use these for both personal and commercial use.
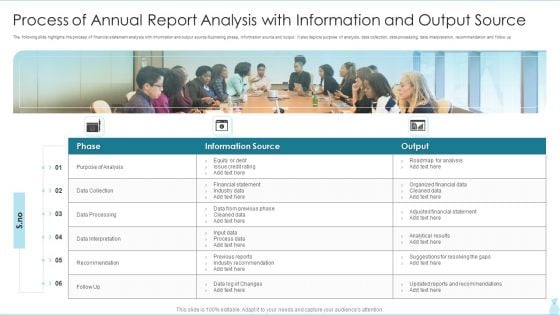
Process Of Annual Report Analysis With Information And Output Source Brochure PDF
The following slide highlights the process of financial statement analysis with information and output source illustrating phase, information source and output. It also depicts purpose of analysis, data collection, data processing, data interpretation, recommendation and follow up.Presenting Process Of Annual Report Analysis With Information And Output Source Brochure PDF to dispense important information. This template comprises six stages. It also presents valuable insights into the topics including Information Source, Financial Statement, Industry Data This is a completely customizable PowerPoint theme that can be put to use immediately. So, download it and address the topic impactfully.
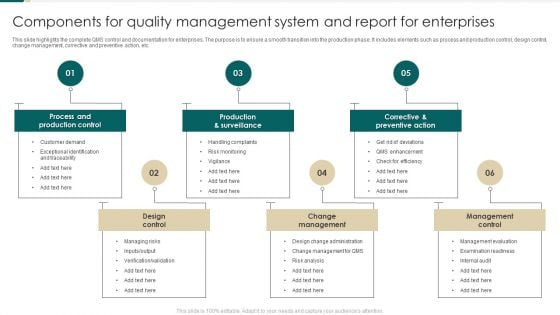
Components For Quality Management System And Report For Enterprises Background PDF
This slide highlights the complete QMS control and documentation for enterprises. The purpose is to ensure a smooth transition into the production phase. It includes elements such as process and production control, design control, change management, corrective and preventive action, etc. Presenting Components For Quality Management System And Report For Enterprises Background PDF to dispense important information. This template comprises Six stages. It also presents valuable insights into the topics including Process And Production Control, Design Control, Change Management. This is a completely customizable PowerPoint theme that can be put to use immediately. So, download it and address the topic impactfully.
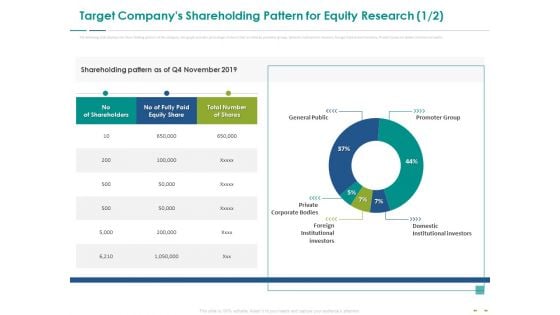
Stock Market Research Report Target Companys Shareholding Pattern For Equity Research Structure PDF
The following slide displays the share holding pattern of the company, the graph provides percentage of shares that are held by promotor groups, domestic institutional investors, foreign Institutional investors, Private Corporate Bodies and General public. Deliver an awe-inspiring pitch with this creative stock market research report target companys shareholding pattern for equity research structure pdf bundle. Topics like general public, promoter group, domestic institutional investors, private corporate bodies, foreign institutional investors can be discussed with this completely editable template. It is available for immediate download depending on the needs and requirements of the user.
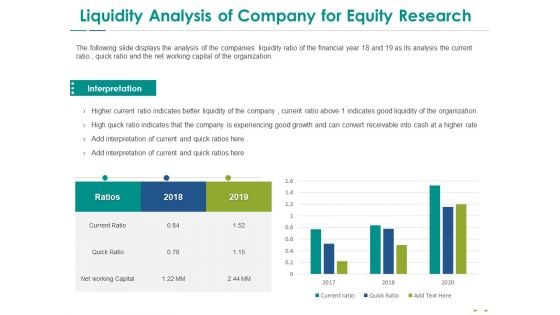
Stock Market Research Report Liquidity Analysis Of Company For Equity Research Designs PDF
The following slide displays the analysis of the companies liquidity ratio of the financial year 18 and 19 as its analysis the current ratio, quick ratio and the net working capital of the organization. Deliver an awe-inspiring pitch with this creative stock market research report liquidity analysis of company for equity research designs pdf bundle. Topics like current ratio, quick ratio, 2017 to 2020 can be discussed with this completely editable template. It is available for immediate download depending on the needs and requirements of the user.
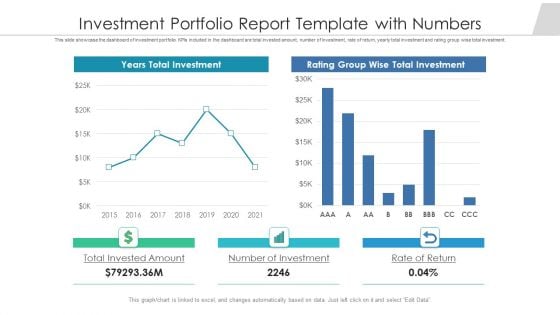
Investment Portfolio Report Template With Numbers Ppt PowerPoint Presentation Gallery Grid PDF
This slide showcase the dashboard of investment portfolio. KPIs included in the dashboard are total invested amount, number of investment, rate of return, yearly total investment and rating group wise total investment. Pitch your topic with ease and precision using this investment portfolio report template with numbers ppt powerpoint presentation gallery grid pdf. This layout presents information on total invested amount, number of investment, rate of return. It is also available for immediate download and adjustment. So, changes can be made in the color, design, graphics or any other component to create a unique layout.
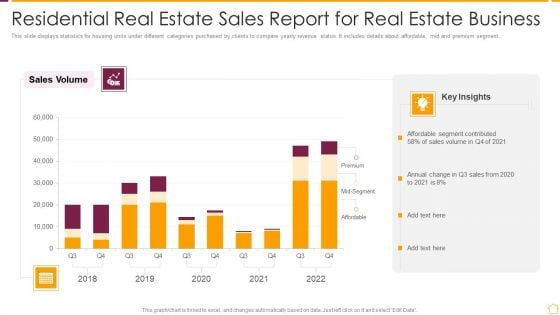
Residential Real Estate Sales Report For Real Estate Business Ppt PowerPoint Presentation File Master Slide PDF
This slide displays statistics for housing units under different categories purchased by clients to compare yearly revenue status. It includes details about affordable, mid and premium segment. Pitch your topic with ease and precision using this Residential Real Estate Sales Report For Real Estate Business Ppt PowerPoint Presentation File Master Slide PDF. This layout presents information on Affordable Segment Contributed, Sales Volume, 2018 To 2022. It is also available for immediate download and adjustment. So, changes can be made in the color, design, graphics or any other component to create a unique layout.
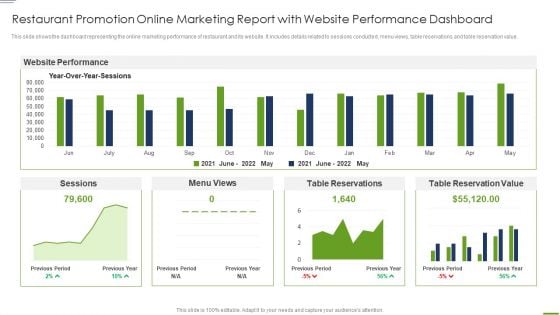
Restaurant Promotion Online Marketing Report With Website Performance Dashboard Information PDF
This slide shows the dashboard representing the online marketing performance of restaurant and its website. It includes details related to sessions conducted, menu views, table reservations and table reservation value.Showcasing this set of slides titled Restaurant Promotion Online Marketing Report With Website Performance Dashboard Information PDF The topics addressed in these templates are Performance, Table Reservations, Table Reservation All the content presented in this PPT design is completely editable. Download it and make adjustments in color, background, font etc. as per your unique business setting.
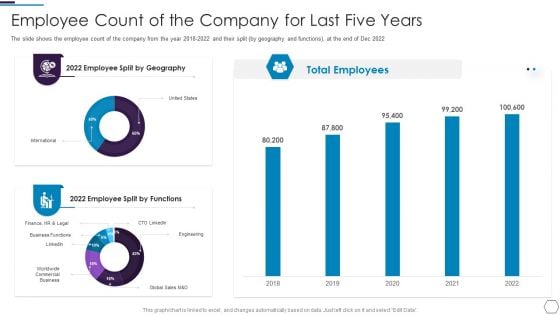
Information Technology Firm Report Example Employee Count Of The Company For Last Five Years Topics PDF
The slide shows the employee count of the company from the year 2018 to 2022 and their split by geography and functions, at the end of Dec 2022 Deliver an awe inspiring pitch with this creative Information Technology Firm Report Example Employee Count Of The Company For Last Five Years Topics PDF bundle. Topics like Employee Geography, Total Employees, Employee Functions can be discussed with this completely editable template. It is available for immediate download depending on the needs and requirements of the user.
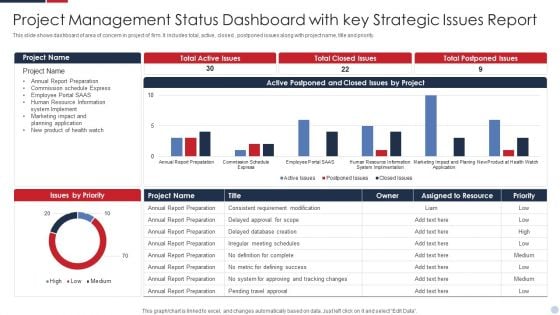
Project Management Status Dashboard With Key Strategic Issues Report Inspiration PDF
This slide shows dashboard of area of concern in project of firm. It includes total, active, closed , postponed issues along with project name, title and priority. Showcasing this set of slides titled Project Management Status Dashboard With Key Strategic Issues Report Inspiration PDF. The topics addressed in these templates are System Implement, Human Resource Information, Planning Application. All the content presented in this PPT design is completely editable. Download it and make adjustments in color, background, font etc. as per your unique business setting.
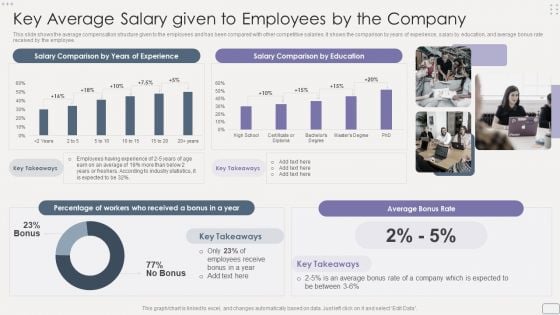
Income Assessment Report Key Average Salary Given To Employees By The Company Download PDF
This slide shows the average compensation structure given to the employees and has been compared with other competitive salaries. It shows the comparison by years of experience, salary by education, and average bonus rate received by the employee.Deliver an awe inspiring pitch with this creative Income Assessment Report Key Average Salary Given To Employees By The Company Download PDF bundle. Topics like Junior Level, Management, Senior Level can be discussed with this completely editable template. It is available for immediate download depending on the needs and requirements of the user.
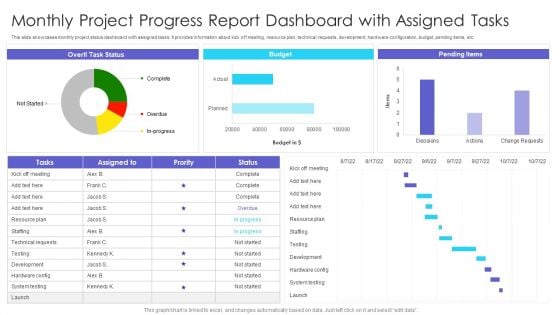
Monthly Project Progress Report Dashboard With Assigned Tasks Ppt Styles Clipart PDF
This slide showcases monthly project status dashboard with assigned tasks. It provides information about kick off meeting, resource plan, technical requests, development, hardware configuration, budget, pending items, etc. Pitch your topic with ease and precision using this Monthly Project Progress Report Dashboard With Assigned Tasks Ppt Styles Clipart PDF. This layout presents information on Pending Items, Budget, Kick Off Meeting. It is also available for immediate download and adjustment. So, changes can be made in the color, design, graphics or any other component to create a unique layout.
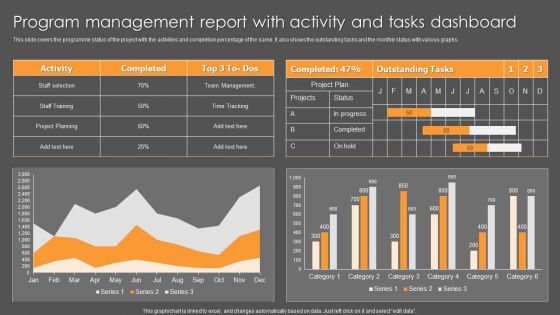
Program Management Report With Activity And Tasks Dashboard Ppt File Objects PDF
This slide covers the programme status of the project with the activities and completion percentage of the same. It also shows the outstanding tasks and the monthly status with various graphs. Pitch your topic with ease and precision using this Program Management Report With Activity And Tasks Dashboard Ppt File Objects PDF. This layout presents information on Activity, Team Management, Time Tracking. It is also available for immediate download and adjustment. So, changes can be made in the color, design, graphics or any other component to create a unique layout.
Employees Attrition Tracking Statistics And Resignation Rate Report By Industry Background PDF
This slide covers dashboard for industry wise employees turnover rates. It further includes statistics on resignation rare of workers, average turnover rates for different industries. Pitch your topic with ease and precision using this Employees Attrition Tracking Statistics And Resignation Rate Report By Industry Background PDF. This layout presents information on Employees, Industry, Average Turnover Rate. It is also available for immediate download and adjustment. So, changes can be made in the color, design, graphics or any other component to create a unique layout.
Impact Survey Report Of Employee Attrition Tracking On Team Operations Demonstration PDF
This slide covers key factors having high impact on day to day team operations. It includes areas such as delay in project delivery, loss of productivity, rehiring cost and on boarding a replacement, low team morale, stress issues, legal and HR related issues. Pitch your topic with ease and precision using this Impact Survey Report Of Employee Attrition Tracking On Team Operations Demonstration PDF. This layout presents information on Employees Turnover, Project, Cost. It is also available for immediate download and adjustment. So, changes can be made in the color, design, graphics or any other component to create a unique layout.
Report On Cost Of High Restaurant Attrition Tracking With Key Insights Topics PDF
This slide depicts breakdown of cost incurred due to restaurant employees turnover. It includes components such as productivity loss, recruitment costs, selection costs, pre-departure costs, orientation and training costs, along with turnover rates, cost per churned employee, total annual cost. Pitch your topic with ease and precision using this Report On Cost Of High Restaurant Attrition Tracking With Key Insights Topics PDF. This layout presents information on Average Turnover Cost, Employee, Productivity. It is also available for immediate download and adjustment. So, changes can be made in the color, design, graphics or any other component to create a unique layout.
Sales Attrition Tracking Report With Revenue And Customer Churn Analytics Formats PDF
This slide covers dashboard depicting total annual sales in company. It includes key components such as revenue, profit margins, cost incurred, cost breakdown, up sell and churn trends. Showcasing this set of slides titled Sales Attrition Tracking Report With Revenue And Customer Churn Analytics Formats PDF. The topics addressed in these templates are Revenue, Number Of Sales, Profit, Cost. All the content presented in this PPT design is completely editable. Download it and make adjustments in color, background, font etc. as per your unique business setting.
Survey Report On Global Voluntary Attrition Tracking By Function Background PDF
This slide depicts survey outcomes on turnover rates based on different functions. It includes survey based on multiple functions such as IT, legal, R and D, public sector, customer support, marketing, HR, sales and finance. along with overall global rates. Showcasing this set of slides titled Survey Report On Global Voluntary Attrition Tracking By Function Background PDF. The topics addressed in these templates are Finance Function, Global Turnover Rates. All the content presented in this PPT design is completely editable. Download it and make adjustments in color, background, font etc. as per your unique business setting.
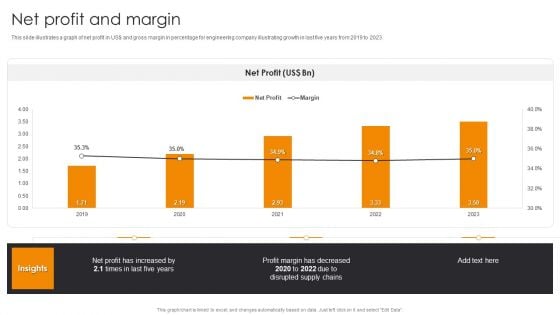
Net Profit And Margin Engineering Company Financial Analysis Report Background PDF
This slide illustrates a graph of net profit in US dollar and gross margin in percentage for engineering company illustrating growth in last five years from 2019 to 2023.Slidegeeks has constructed Net Profit And Margin Engineering Company Financial Analysis Report Background PDF after conducting extensive research and examination. These presentation templates are constantly being generated and modified based on user preferences and critiques from editors. Here, you will find the most attractive templates for a range of purposes while taking into account ratings and remarks from users regarding the content. This is an excellent jumping-off point to explore our content and will give new users an insight into our top-notch PowerPoint Templates.

Engineering Services Company Report Gross Profit And Margin Ppt PowerPoint Presentation File Show PDF
This slide illustrates a graph of gross profit in US dollar and gross margin in percentage for engineering company illustrating growth trend in last five years from 2018 to 2022. From laying roadmaps to briefing everything in detail, our templates are perfect for you. You can set the stage with your presentation slides. All you have to do is download these easy-to-edit and customizable templates. Engineering Services Company Report Gross Profit And Margin Ppt PowerPoint Presentation File Show PDF will help you deliver an outstanding performance that everyone would remember and praise you for. Do download this presentation today.
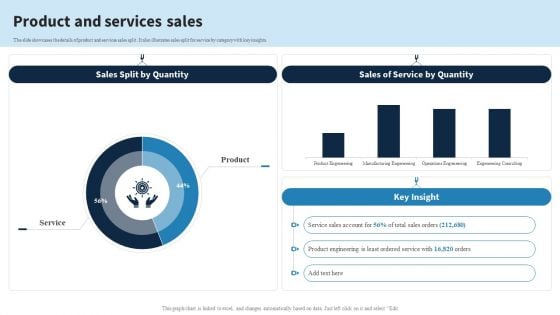
Engineering Services Company Report Product And Services Sales Ppt PowerPoint Presentation File Deck PDF
The slide showcases the details of product and services sales split. It also illustrates sales split for service by category with key insights. Find a pre-designed and impeccable Engineering Services Company Report Product And Services Sales Ppt PowerPoint Presentation File Deck PDF. The templates can ace your presentation without additional effort. You can download these easy-to-edit presentation templates to make your presentation stand out from others. So, what are you waiting for Download the template from Slidegeeks today and give a unique touch to your presentation.

Engineering Services Company Report Top Products And Services Ppt File Graphics Pictures PDF
The slide highlights the top product and services by sales volume in 2022. It showcases mechanical tools, industrial sensors, safety valves, line expansion, security consulting and manufacturing automation. Want to ace your presentation in front of a live audience Our Engineering Services Company Report Top Products And Services Ppt File Graphics Pictures PDF can help you do that by engaging all the users towards you. Slidegeeks experts have put their efforts and expertise into creating these impeccable powerpoint presentations so that you can communicate your ideas clearly. Moreover, all the templates are customizable, and easy-to-edit and downloadable. Use these for both personal and commercial use.
Multiple Project Progress Tracking Report Dashboard With Key Performance Indicators Brochure PDF
This slide shows the dashboard representing status of various projects and tracking their performance with the help of key performance indicators which are as follows schedule, budget, resources, risk and issues and quality of projects.Pitch your topic with ease and precision using this Multiple Project Progress Tracking Report Dashboard With Key Performance Indicators Brochure PDF. This layout presents information on Risks Issues, Quality Open Defects, Techno Blogger. It is also available for immediate download and adjustment. So, changes can be made in the color, design, graphics or any other component to create a unique layout.
Multiple Projects Progress Tracking Report Management Dashboard With Duration Summary PDF
This slide shows the dashboard representing status of various projects which would be helpful in project management. It shows information related to project status, tasks status, milestones completed, upcoming milestones, critical tasks, projects names along with their start and end date, duration etc.Pitch your topic with ease and precision using this Multiple Projects Progress Tracking Report Management Dashboard With Duration Summary PDF. This layout presents information on Start Date, Finish Date, Percent Complete. It is also available for immediate download and adjustment. So, changes can be made in the color, design, graphics or any other component to create a unique layout.
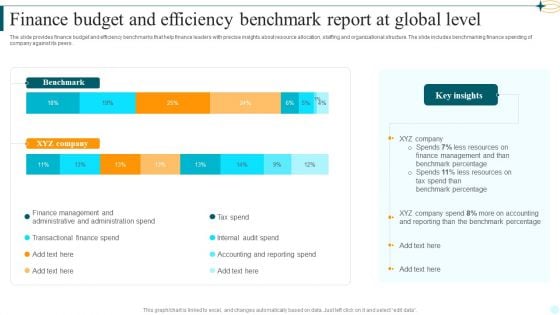
Finance Budget And Efficiency Benchmark Report At Global Level Template PDF
The slide provides finance budget and efficiency benchmarks that help finance leaders with precise insights about resource allocation, staffing and organizational structure. The slide includes benchmarking finance spending of company against its peers. Showcasing this set of slides titled Finance Budget And Efficiency Benchmark Report At Global Level Template PDF. The topics addressed in these templates are Benchmark, Key Insights, Benchmark Percentage. All the content presented in this PPT design is completely editable. Download it and make adjustments in color, background, font etc. as per your unique business setting.
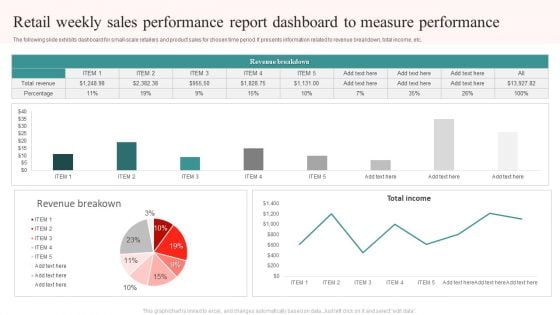
Retail Weekly Sales Performance Report Dashboard To Measure Performance Ppt Gallery File Formats PDF
The following slide exhibits dashboard for small-scale retailers and product sales for chosen time period. It presents information related to revenue breakdown, total income, etc. Showcasing this set of slides titled Retail Weekly Sales Performance Report Dashboard To Measure Performance Ppt Gallery File Formats PDF. The topics addressed in these templates are Revenue Breakdown, Total Income, Total Revenue. All the content presented in this PPT design is completely editable. Download it and make adjustments in color, background, font etc. as per your unique business setting.
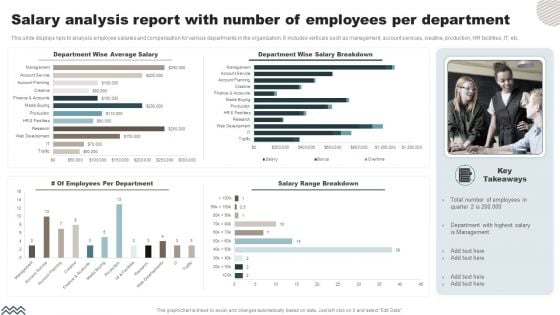
Salary Analysis Report With Number Of Employees Per Department Clipart PDF
This slide displays kpis to analysis employee salaries and compensation for various departments in the organization. It includes verticals such as management, account services, creative, production, HR facilities, IT, etc. Showcasing this set of slides titled Salary Analysis Report With Number Of Employees Per Department Clipart PDF. The topics addressed in these templates are Department Wise Average Salary, Salary Range Breakdown. All the content presented in this PPT design is completely editable. Download it and make adjustments in color, background, font etc. as per your unique business setting.
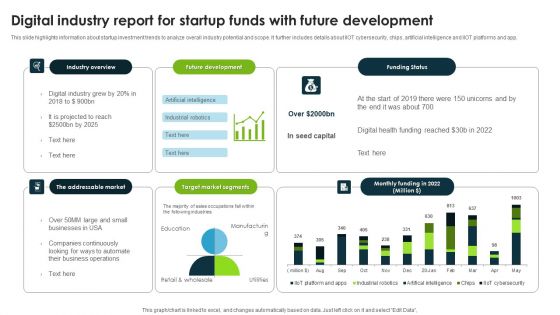
Digital Industry Report For Startup Funds With Future Development Pictures PDF
This slide highlights information about startup investment trends to analyze overall industry potential and scope. It further includes details about IIOT cybersecurity, chips, artificial intelligence and IIOT platforms and app. Pitch your topic with ease and precision using this Digital Industry Report For Startup Funds With Future Development Pictures PDF. This layout presents information on Industry Overview, Future Development, Target Market Segments. It is also available for immediate download and adjustment. So, changes can be made in the color, design, graphics or any other component to create a unique layout.
Social Media Influencer Marketing Campaign Performance Tracking Report Ppt PowerPoint Presentation File Backgrounds PDF
This slide represents the dashboard representing the lead generation through the social media influencer marketing campaign carried out by the organization. It shows measurement of performance through key metrics of post impressions, engagements, clicks and video views etc.Showcasing this set of slides titled Social Media Influencer Marketing Campaign Performance Tracking Report Ppt PowerPoint Presentation File Backgrounds PDF. The topics addressed in these templates are Post Impressions, Post Engagements, Massages During Publishing. All the content presented in this PPT design is completely editable. Download it and make adjustments in color, background, font etc. as per your unique business setting.
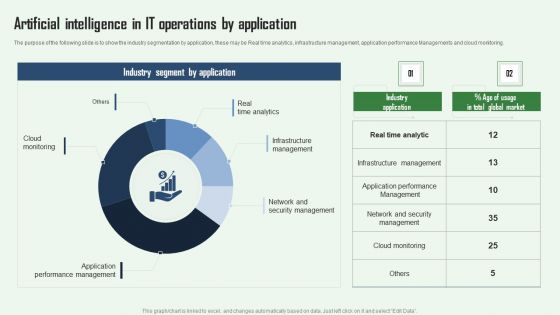
Artificial Intelligence In IT Operations By Application Aiops Integration Summary Report Microsoft PDF
The purpose of the following slide is to show the industry segmentation by application, these may be Real time analytics, infrastructure management, application performance Managements and cloud monitoring. Make sure to capture your audiences attention in your business displays with our gratis customizable Artificial Intelligence In IT Operations By Application Aiops Integration Summary Report Microsoft PDF. These are great for business strategies, office conferences, capital raising or task suggestions. If you desire to acquire more customers for your tech business and ensure they stay satisfied, create your own sales presentation with these plain slides.
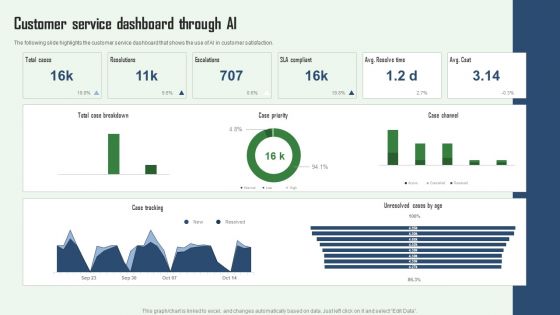
Customer Service Dashboard Through AI Aiops Integration Summary Report Microsoft PDF
The following slide highlights the customer service dashboard that shows the use of AI in customer satisfaction. Coming up with a presentation necessitates that the majority of the effort goes into the content and the message you intend to convey. The visuals of a PowerPoint presentation can only be effective if it supplements and supports the story that is being told. Keeping this in mind our experts created Customer Service Dashboard Through AI Aiops Integration Summary Report Microsoft PDF to reduce the time that goes into designing the presentation. This way, you can concentrate on the message while our designers take care of providing you with the right template for the situation.
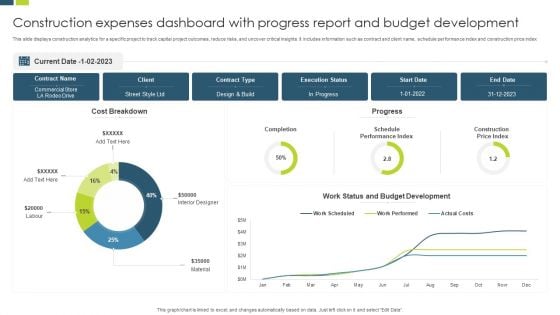
Construction Expenses Dashboard With Progress Report And Budget Development Background PDF
This slide displays construction analytics for a specific project to track capital project outcomes, reduce risks, and uncover critical insights. It includes information such as contract and client name, schedule performance index and construction price index. Showcasing this set of slides titled Construction Expenses Dashboard With Progress Report And Budget Development Background PDF. The topics addressed in these templates are Budget Development, Execution Status, Commercial Store. All the content presented in this PPT design is completely editable. Download it and make adjustments in color, background, font etc. as per your unique business setting.


 Continue with Email

 Home
Home


