Report Icon
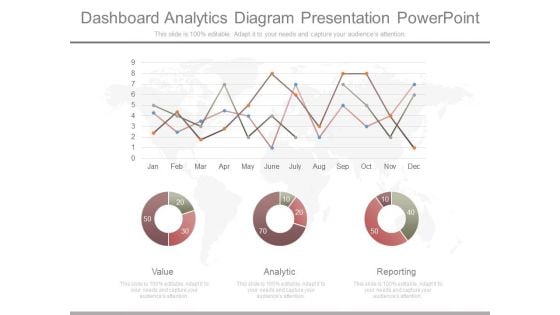
Dashboard Analytics Diagram Presentation Powerpoint
This is a dashboard analytics diagram presentation powerpoint. This is a three stage process. The stages in this process are value, analytic, reporting.
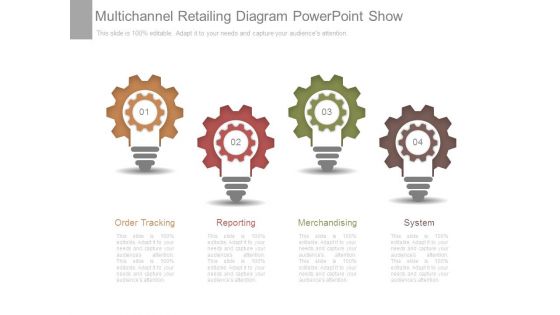
Multichannel Retailing Diagram Powerpoint Show
This is a multichannel retailing diagram powerpoint show. This is a four stage process. The stages in this process are order tracking, reporting, merchandising, system.
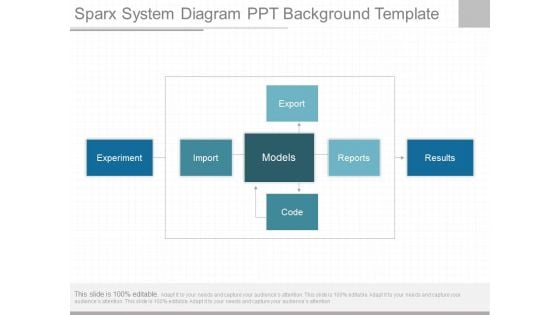
Sparx System Diagram Ppt Background Template
This is a sparx system diagram ppt background template. This is a one stage process. The stages in this process are experiment, import, export, models, code, reports, results.
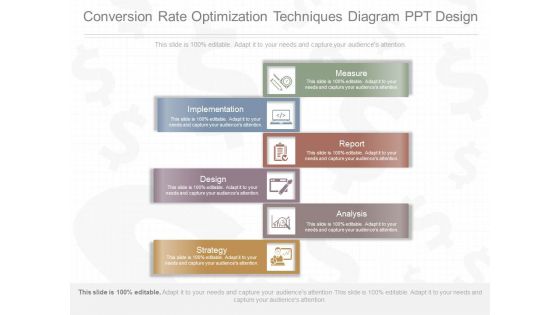
Conversion Rate Optimization Techniques Diagram Ppt Design
This is a conversion rate optimization techniques diagram ppt design. This is a six stage process. The stages in this process are measure, implementation, report, design, analysis, strategy.
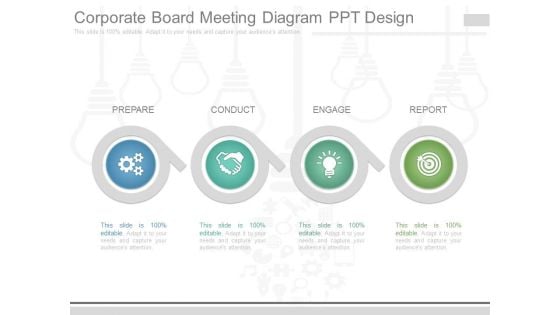
Corporate Board Meeting Diagram Ppt Design
This is a corporate board meeting diagram ppt design. This is a four stage process. The stages in this process are prepare, conduct, engage, report.
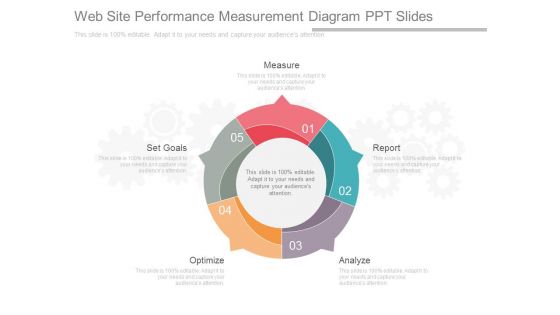
Web Site Performance Measurement Diagram Ppt Slides
This is a web site performance measurement diagram ppt slides. This is a five stage process. The stages in this process are measure, report, analyze, optimize, set goals.
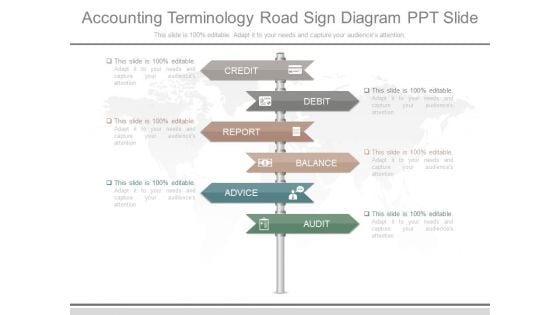
Accounting Terminology Road Sign Diagram Ppt Slide
This is a accounting terminology road sign diagram ppt slide. This is a six stage process. The stages in this process are credit, debit, report, balance, advice, audit.
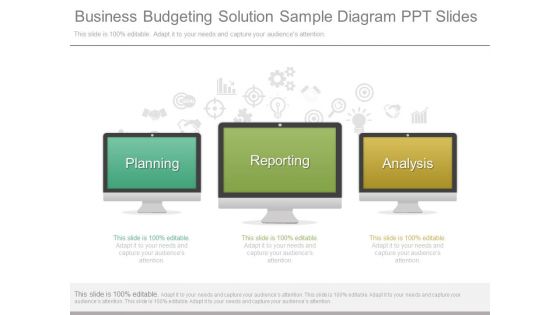
Business Budgeting Solution Sample Diagram Ppt Slides
This is a business budgeting solution sample diagram ppt slides. This is a three stage process. The stages in this process are planning, reporting, analysis.
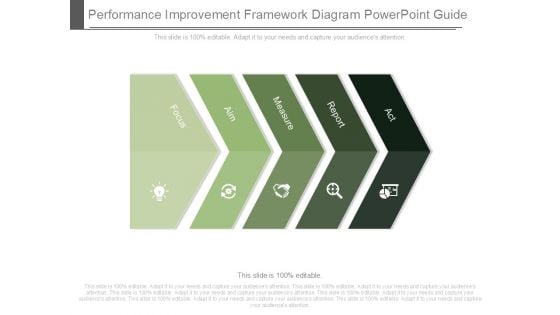
Performance Improvement Framework Diagram Powerpoint Guide
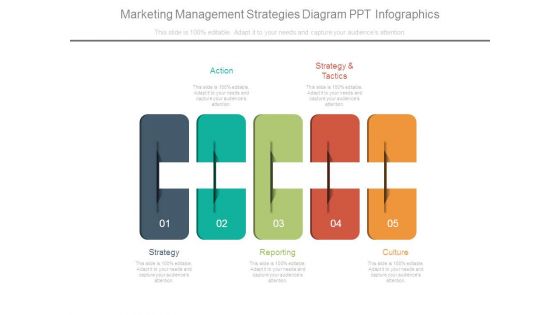
Marketing Management Strategies Diagram Ppt Infographics
This is a marketing management strategies diagram ppt infographics. This is a five stage process. The stages in this process are action, strategy and tactics, strategy, reporting, culture.
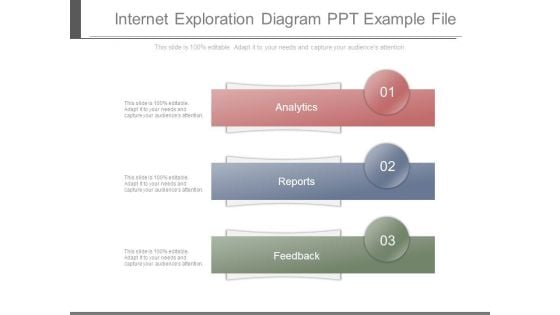
Internet Exploration Diagram Ppt Example File
This is a internet exploration diagram ppt example file. This is a three stage process. The stages in this process are analytics, reports, feedback.
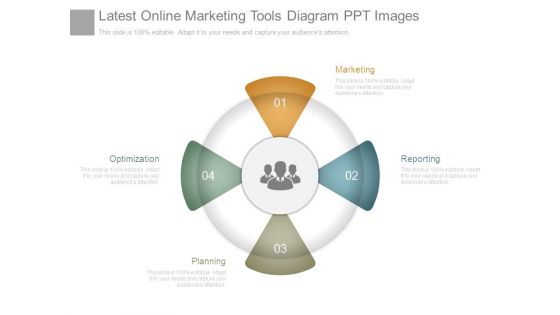
Latest Online Marketing Tools Diagram Ppt Images
This is a latest online marketing tools diagram ppt images. This is a four stage process. The stages in this process are optimization, planning, marketing, reporting.
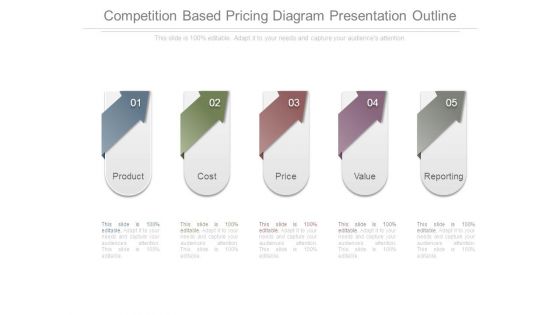
Competition Based Pricing Diagram Presentation Outline
This is a competition based pricing diagram presentation outline. This is a five stage process. The stages in this process are product, cost, price, value, reporting.
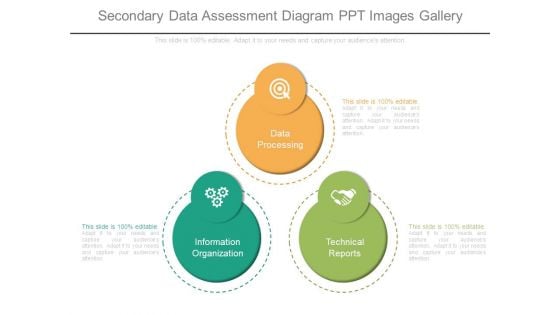
Secondary Data Assessment Diagram Ppt Images Gallery
This is a secondary data assessment diagram ppt images gallery. This is a three stage process. The stages in this process are data processing, information organization, technical reports.

Stock Requirement Plan With Inventory Summary Ppt PowerPoint Presentation Gallery Designs Download PDF
The following slide highlights the material requirement planning with inventory summary. It illustrates sales report, delivery report, inventory summary, purchase order and suppliers. Showcasing this set of slides titled Stock Requirement Plan With Inventory Summary Ppt PowerPoint Presentation Gallery Designs Download PDF. The topics addressed in these templates are Suppliers, Sales Report, Inventory Summary, Purchase Order. All the content presented in this PPT design is completely editable. Download it and make adjustments in color, background, font etc. as per your unique business setting.
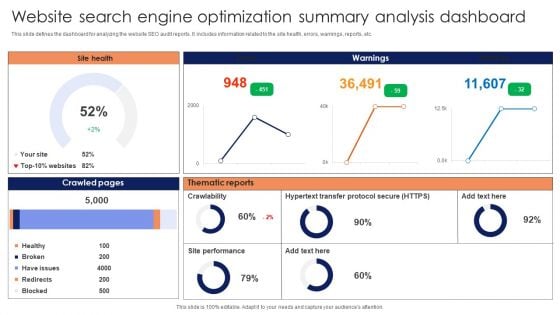
Website Search Engine Optimization Summary Analysis Dashboard Infographics PDF
This slide defines the dashboard for analyzing the website SEO audit reports. It includes information related to the site health, errors, warnings, reports, etc. Showcasing this set of slides titled Website Search Engine Optimization Summary Analysis Dashboard Infographics PDF. The topics addressed in these templates are Crawled Pages, Thematic Reports, Site Health, Warnings. All the content presented in this PPT design is completely editable. Download it and make adjustments in color, background, font etc. as per your unique business setting.
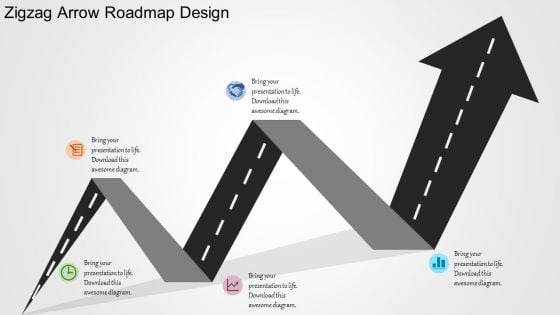
Zigzag Arrow Roadmap Design PowerPoint Templates
Need to show the achievements or performance of your company or want to show your colleagues their targets. Have a look at the above slide. Presenting zigzag arrow road map PowerPoint template design which has everything that you need for your presentation. This PPT template is very helpful and can be used in various ways. For example, it can depict what are the hindrances one might face in order to achieve the goal. This design can also be used to show your business or company?s performance over the period of time, or how has the journey been. This slide has five customizable icons which can help you put forward your point and give you the edge over those boring presentations. This template can be modified as per your needs. So what are you waiting for? Download this amazing zigzag road map PowerPoint template for your presentation.
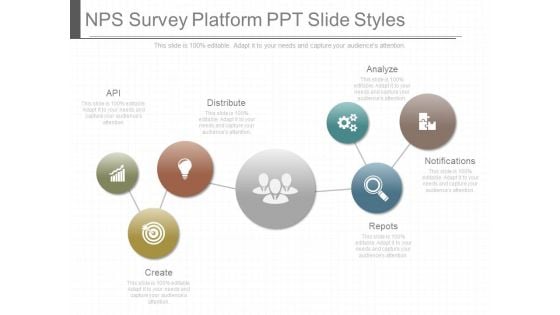
Naps Survey Platform Ppt Slide Styles
This is a naps survey platform ppt slide styles. This is a one stage process. The stages in this process are distribute, create, analyze, notifications, reports.
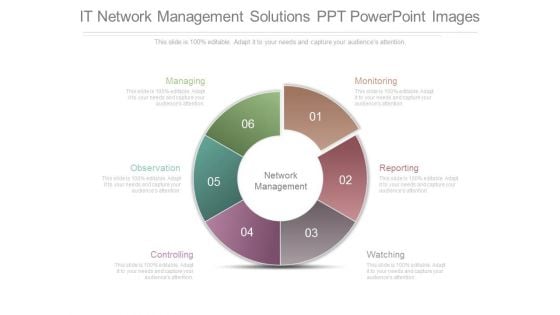
It Network Management Solutions Ppt Powerpoint Images
This is a it network management solutions ppt powerpoint images. This is a six stage process. The stages in this process are monitoring, reporting, watching, controlling, observation, managing.
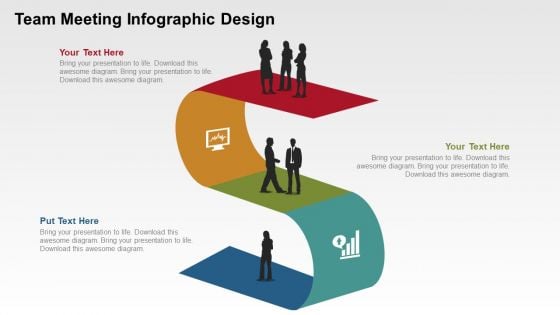
Team Meeting Infographic Design PowerPoint Templates
This template can be best used to describe different levels in an organization. It could be perfect solution if you are looking for a slide to depict the existing hierarchy or flow of communication in a company. This S shaped PowerPoint template is good enough to encourage your colleagues, teammates to reach their goals. This slide can represent stairs and what steps have to be taken to reach the top or achieve the targets. This diagram also displays how you can plan or discuss things with others during your journey. And slowly steadily you are there at the top. You can easily modify it per your needs and convenience. The human icons are editable. Use this background to make your point easy to understand.
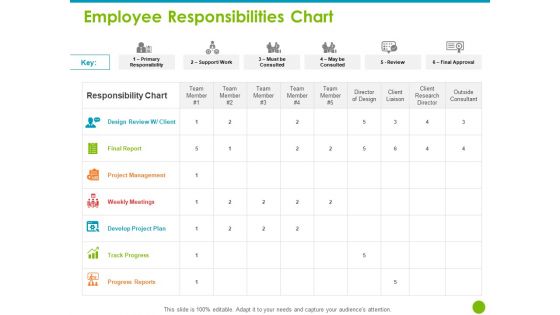
Project Capabilities Employee Responsibilities Chart Ppt Infographics File Formats PDF
Presenting this set of slides with name project capabilities employee responsibilities chart ppt infographics file formats pdf. The topics discussed in these slides are progress reports, track progress, develop project plan, weekly meetings, project management, final report. This is a completely editable PowerPoint presentation and is available for immediate download. Download now and impress your audience.
Web Trends Analyzer Diagram Ppt Powerpoint Images
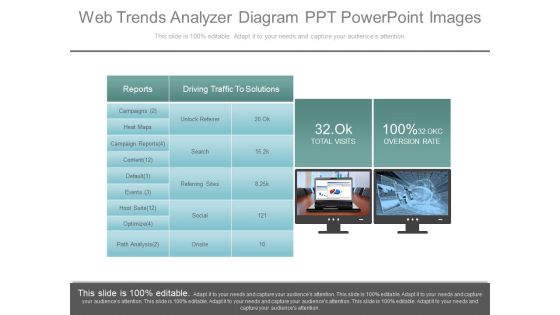
This is a web trends analyzer diagram ppt powerpoint images. This is a two stage process. The stages in this process are reports, driving traffic to solutions, campaigns, heat maps, campaign reports, content, default, events, hoot suite, optimize, unlock referrer, search, referring sites, social, onsite, 32 ok total visits, 100 percent 32 okc oversion rate.
Market Research Guidelines Diagram Ppt Files
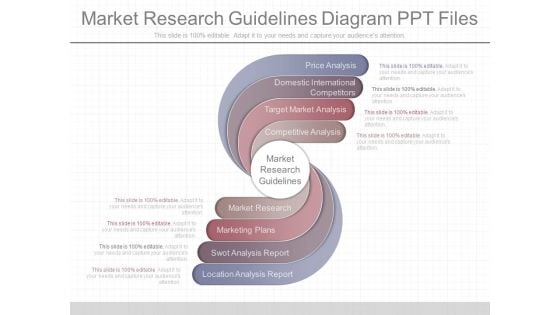
This is a market research guidelines diagram ppt files. This is a four stage process. The stages in this process are price analysis, domestic international competitors, target market analysis, competitive analysis, market research guidelines, market research, marketing plans, swot analysis report, location analysis report.
Business Analysis Vs Business Analytics Diagram Ppt Slides
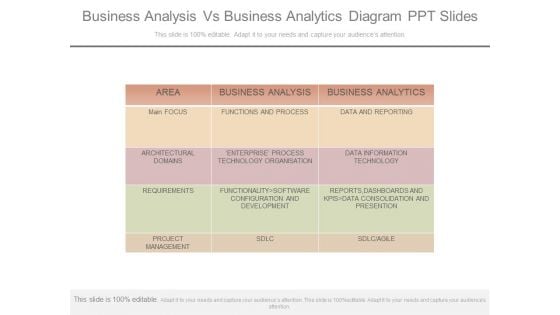
This is a business analysis vs business analytics diagram ppt slides. This is a one stage process. The stages in this process are area, main focus, architectural domains, requirements, project management, business analysis, functions and process, enterprise? process technology organisation, functionality software configuration and development, sdlc, business analytics, data and reporting, data information technology, reports, dashboards and kpis data consolidation and presention, sdlc agile.

Quarterly Financial Performance Dashboard By Power BI Ppt Sample SS
This slide represents the pyramid showing the asset performance management. It includes details related to APM-centric, predictive, condition-based, preventive and reactive maintenance. Find a pre-designed and impeccable Quarterly Financial Performance Dashboard By Power BI Ppt Sample SS The templates can ace your presentation without additional effort. You can download these easy-to-edit presentation templates to make your presentation stand out from others. So, what are you waiting for Download the template from Slidegeeks today and give a unique touch to your presentation. This slide represents the pyramid showing the asset performance management. It includes details related to APM-centric, predictive, condition-based, preventive and reactive maintenance.
Service Marketing Quarterly Performance Strategic Marketing Campaign Demonstration Pdf
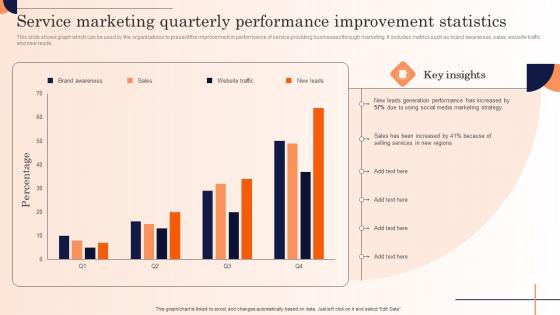
This slide shows graph which can be used by the organizations to present the improvement in performance of service providing businesses through marketing. It includes metrics such as brand awareness, sales, website traffic and new leads.Take your projects to the next level with our ultimate collection of Service Marketing Quarterly Performance Strategic Marketing Campaign Demonstration Pdf. Slidegeeks has designed a range of layouts that are perfect for representing task or activity duration, keeping track of all your deadlines at a glance. Tailor these designs to your exact needs and give them a truly corporate look with your own brand colors they all make your projects stand out from the rest. This slide shows graph which can be used by the organizations to present the improvement in performance of service providing businesses through marketing. It includes metrics such as brand awareness, sales, website traffic and new leads.
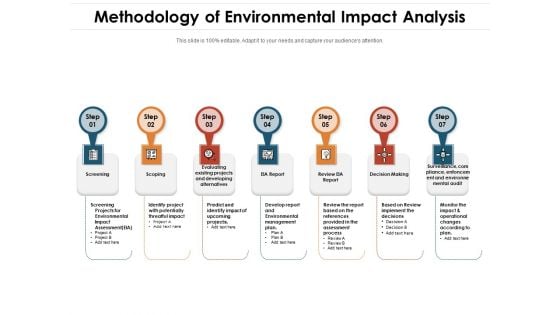
Methodology Of Environmental Impact Analysis Ppt PowerPoint Presentation Portfolio Slide Portrait PDF
Presenting methodology of environmental impact analysis ppt powerpoint presentation portfolio slide portrait pdf to dispense important information. This template comprises seven stages. It also presents valuable insights into the topics including screening, scoping, eia report, review eia report, decision making. This is a completely customizable PowerPoint theme that can be put to use immediately. So, download it and address the topic impactfully.
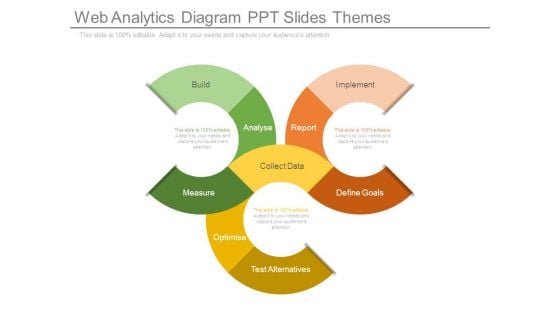
Web Analytics Diagram Ppt Slides Themes
This is a web analytics diagram ppt slides themes. This is a three stage process. The stages in this process are build, analyse, measure, test alternatives, optimise, collect data, define goals, report, implement.
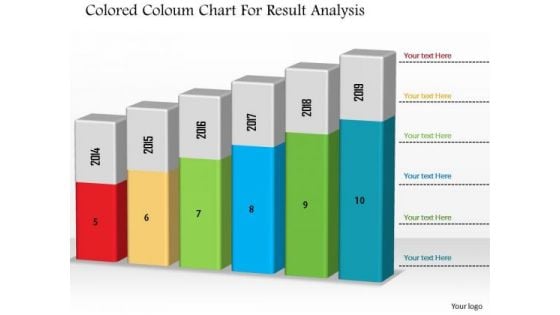
Business Diagram Colored Column Chart For Result Analysis PowerPoint Slide
This Power Point diagram has been designed with graphic of column chart. It contains diagram of bar char depicting annual business progress report. Use this diagram to build professional presentations for your viewers.
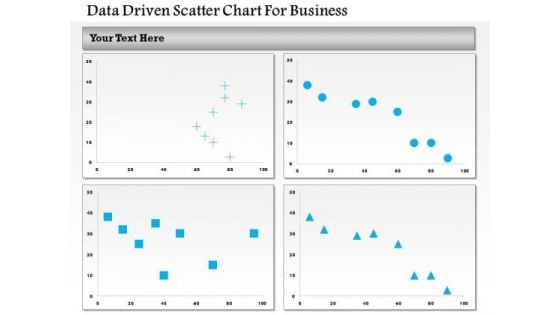
Business Diagram Data Driven Scatter Chart For Business PowerPoint Slide
This business diagram has been designed with four comparative charts. This slide suitable for data representation. You can also use this slide to present business analysis and reports. Use this diagram to present your views in a wonderful manner.
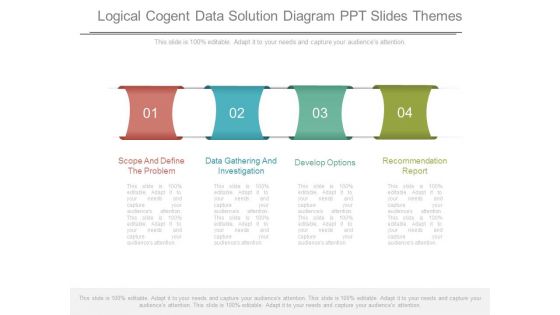
Logical Cogent Data Solution Diagram Ppt Slides Themes
This is a logical cogent data solution diagram ppt slides themes. This is a four stage process. The stages in this process are scope and define the problem, data gathering and investigation, develop options, recommendation report.
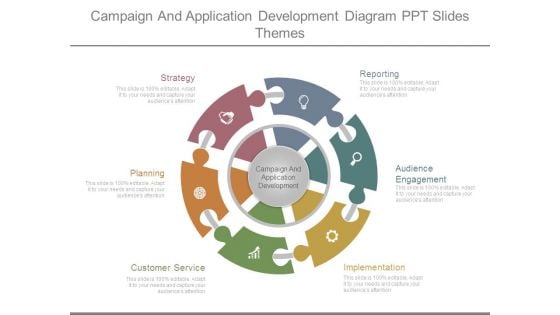
Campaign And Application Development Diagram Ppt Slides Themes
This is a campaign and application development diagram ppt slides themes. This is a six stage process. The stages in this process are campaign and application development, strategy, planning, customer service, reporting, audience engagement, implementation.
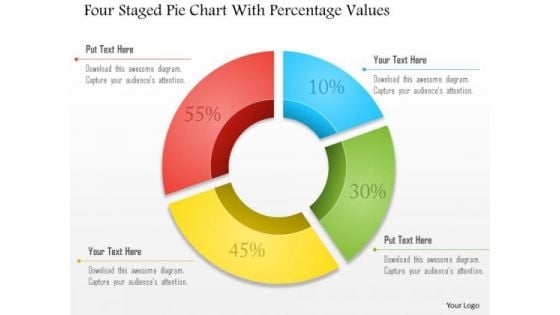
Business Diagram Four Staged Pie Chart With Percentage Values Presentation Template
Four staged pie chart and percentage values are used to design this business slide. Download this diagram to make business and financial reports. Use our above diagram to express information in a visual way.
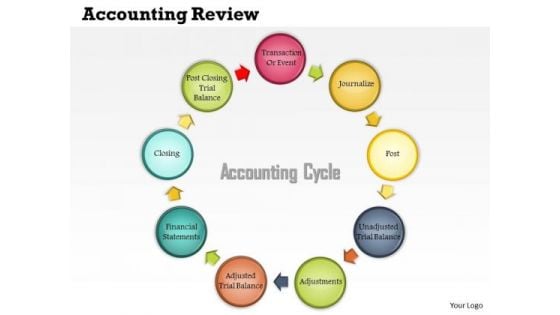
Business Framework Accounting Review PowerPoint Presentation
This circular diagram depicts the steps involved in the accounting process from when a transaction occurs up the end of period reports. Use this diagram to display accounting procedure in graphical way.
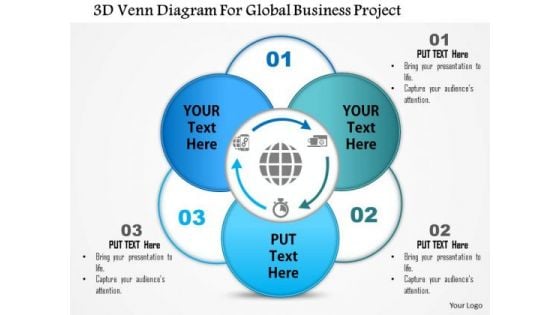
Business Diagram 3d Venn Diagram For Global Business Project Presentation Template
This business diagram displays 3d Venn diagram. This editable slide is suitable to present business reports. Use this diagram for business and finance related topics and display complete data analysis in your presentation.
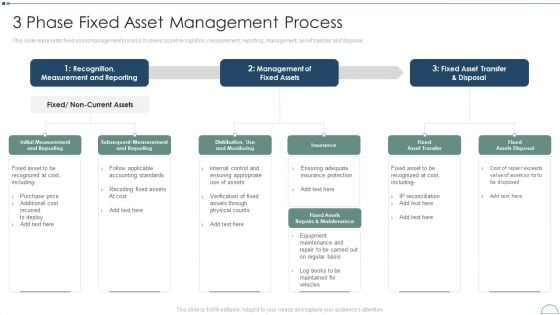
Fixed Asset Management Framework Implementation 3 Phase Fixed Asset Management Process Microsoft PDF
This slide represents fixed asset management process. It covers asset recognition, measurement, reporting, management, asset transfer and disposal.Deliver an awe inspiring pitch with this creative Fixed Asset Management Framework Implementation 3 Phase Fixed Asset Management Process Microsoft PDF bundle. Topics like Measurement And Reporting, Management Of Fixed, Asset Transfer can be discussed with this completely editable template. It is available for immediate download depending on the needs and requirements of the user.
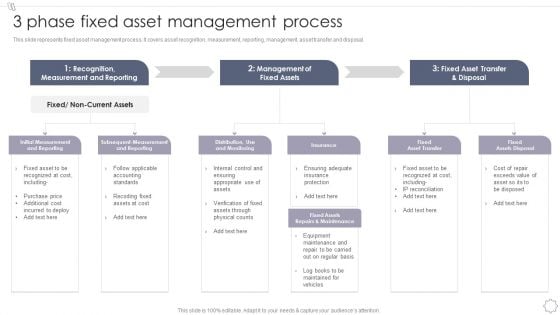
Maintaining And Managing Fixed Assets 3 Phase Fixed Asset Management Process Inspiration PDF
This slide represents fixed asset management process. It covers asset recognition, measurement, reporting, management, asset transfer and disposal.Deliver and pitch your topic in the best possible manner with this Maintaining And Managing Fixed Assets 3 Phase Fixed Asset Management Process Inspiration PDF. Use them to share invaluable insights on Measurement Reporting, Management Fixed, Fixed Asset and impress your audience. This template can be altered and modified as per your expectations. So, grab it now.
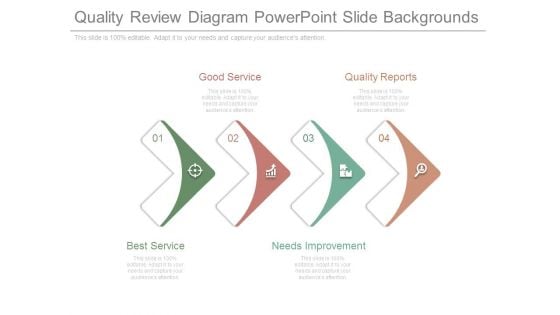
Quality Review Diagram Powerpoint Slide Backgrounds
This is a quality review diagram powerpoint slide backgrounds. This is a four stage process. The stages in this process are good service, quality reports, needs improvement, best service.
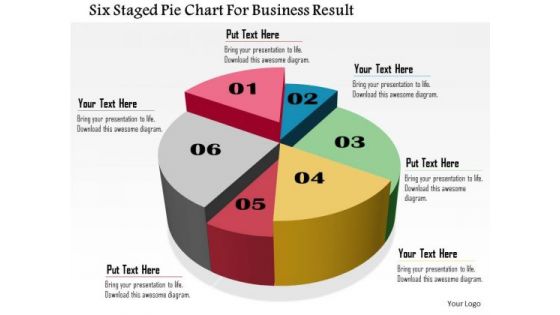
Business Daigram Six Staged Pie Chart For Business Result Presentation Templets
Six staged pie chart is used to design this business slide. Download this diagram to make business and financial reports. Use our above diagram to express information in a visual way.
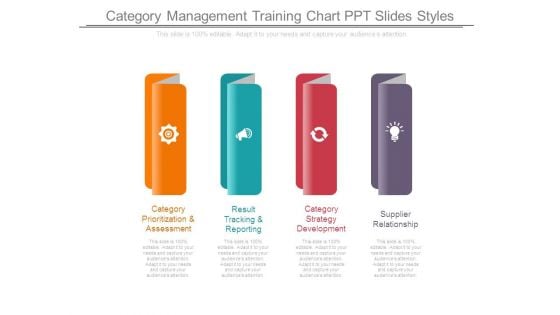
Category Management Training Chart Ppt Slides Styles
This is a category management training chart ppt slides styles. This is a four stage process. The stages in this process are category prioritization and assessment, result tracking and reporting, category strategy development, supplier relationship.
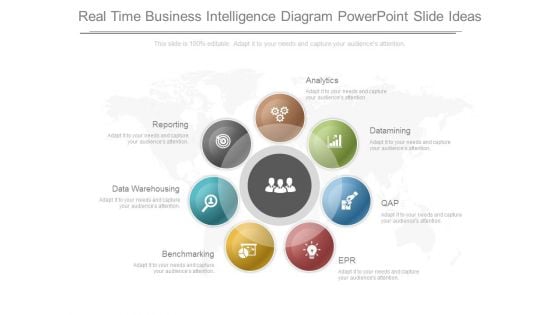
Real Time Business Intelligence Diagram Powerpoint Slide Ideas
This is a real time business intelligence diagram powerpoint slide ideas. This is a seven stage process. The stages in this process are data warehousing, reporting, analytics, datamining, qap, epr, benchmarking.
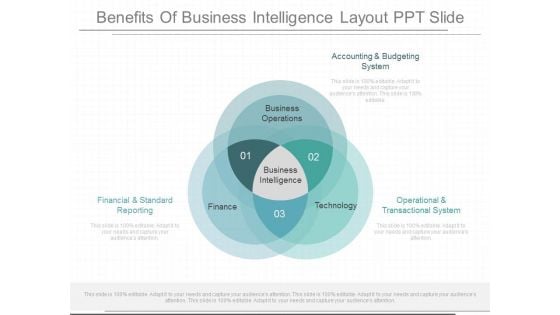
Benefits Of Business Intelligence Layout Ppt Slide
This is a benefits of business intelligence layout ppt slide. This is a three stage process. The stages in this process are accounting and budgeting system, financial and standard reporting, operational and transactional system, business operations, business intelligence, finance, technology.
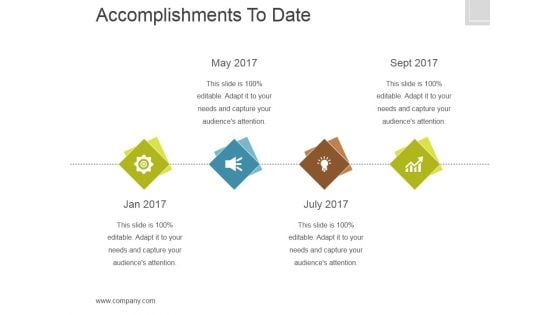
Accomplishments To Date Ppt PowerPoint Presentation Ideas
This is a accomplishments to date ppt powerpoint presentation ideas. This is a four stage process. The stages in this process are icons, business, process, marketing, years.
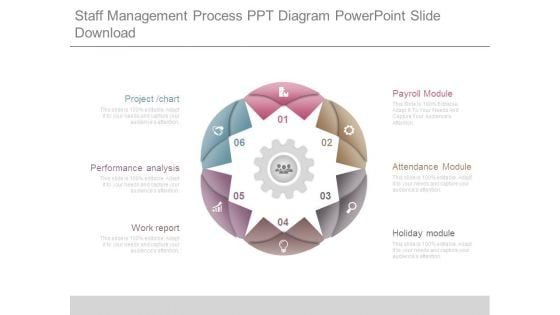
Staff Management Process Ppt Diagram Powerpoint Slide Download
This is a staff management process ppt diagram powerpoint slide download. This is a six stage process. The stages in this process are project chart, performance analysis, work report, holiday module, attendance module, payroll module.
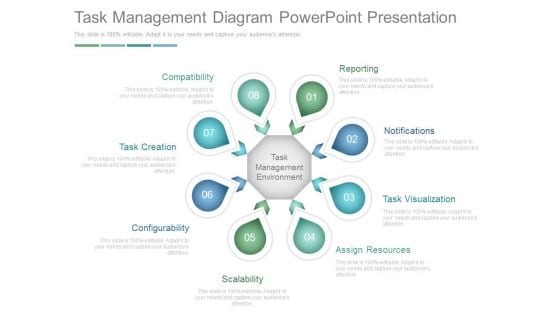
Task Management Diagram Powerpoint Presentation
This is a task management diagram powerpoint presentation. This is a eight stage process. The stages in this process are compatibility, task creation, configurability, scalability, assign resources, task visualization, notifications, reporting.
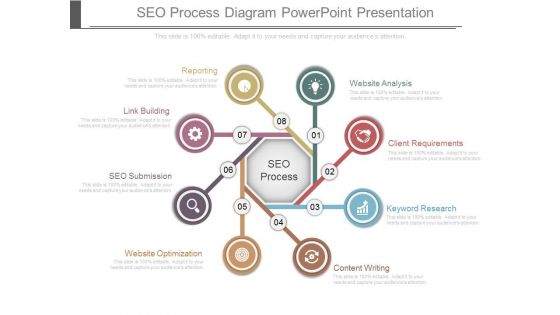
Seo Process Diagram Powerpoint Presentation
This is a seo process diagram powerpoint presentation. This is a eight stage process. The stages in this process are reporting, link building, seo submission, website optimization, content writing, keyword research, client requirements, website analysis, seo process.
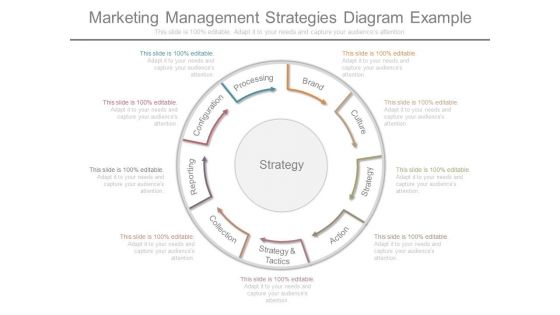
Marketing Management Strategies Diagram Example
This is a marketing management strategies diagram example. This is a nine stage process. The stages in this process are brand, culture, strategy, action, strategy and tactics, collection, reporting, configuration, processing.
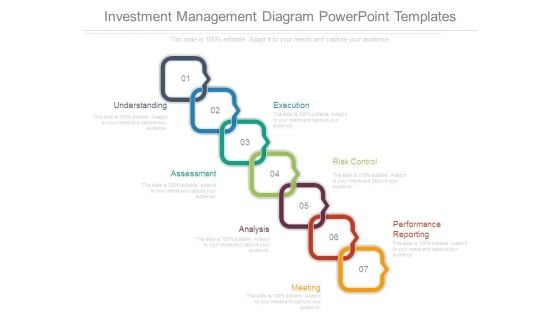
Investment Management Diagram Powerpoint Templates
This is a investment management diagram powerpoint templates. This is a seven stage process. The stages in this process are understanding, execution, risk control, performance reporting, meeting, analysis, assessment.
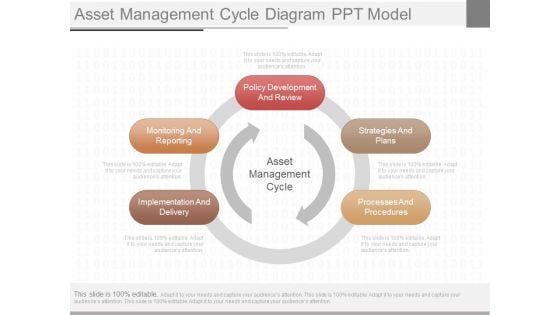
Asset Management Cycle Diagram Ppt Model
This is a asset management cycle diagram ppt model. This is a five stage process. The stages in this process are monitoring and reporting, policy development and review, implementation and delivery, strategies and plans, processes and procedures, asset management cycle.
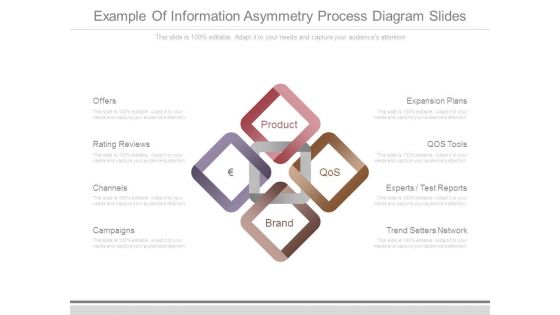
Example Of Information Asymmetry Process Diagram Slides
This is a example of information asymmetry process diagram slides. This is a four stage process. The stages in this process are offers, rating reviews, channels, campaigns, product, brand, expansion plans, qos tools, experts test reports, trend setters network.
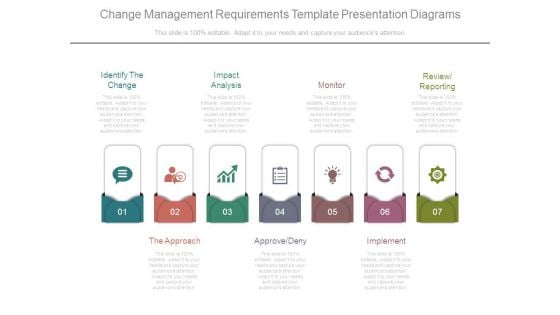
Change Management Requirements Template Presentation Diagrams
This is a Change Management Requirements Template Presentation Diagrams. This is a seven stage process. The stages in this process are identify the change, impact analysis, monitor, review reporting, the approach, approve deny, implement.

Major Achievements Powerpoint Ppt Template Bundles
This Major Achievements Powerpoint Ppt Template Bundles is meant to inspire a sense of awe about the organization, planning, skill and innovation you bring to business, and the ways it pays you back. The presentation template in Technological Achievements, Achievements In Healthcare Industry, Accomplishments Of AI slides also lists the roles and duties of a business organization and its members in building a wholesome, prosperous society. You can create a comprehensive chart on business functions and showcase specifics that make you special due to the 100 percent editable and customizable nature of the presentation. Encourage stakeholders to dig deep into business knowledge and use it in practice to deliver quality products and service with the uses of this PPT Template for the ages. Download now. Our Major Achievements PowerPoint Template Bundles are expertly designed to enhance any presentation. Use them to present your accomplishments with a professional and visually appealing backdrop.
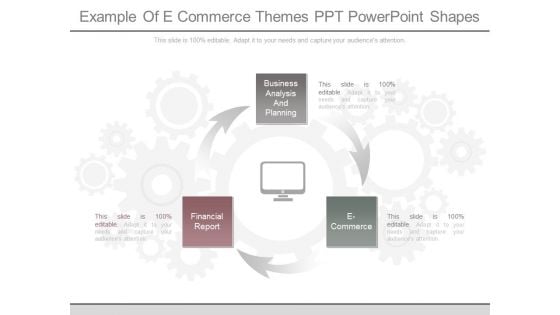
Example Of E Commerce Themes Ppt Powerpoint Shapes
This is a example of e commerce themes ppt powerpoint shapes. This is a three stage process. The stages in this process are business analysis and planning, financial report, e commerce.

Kpi Engineering Process Cycle Diagram Ppt Sample
This is a kpi engineering process cycle diagram ppt sample. This is a six stage process. The stages in this process are program discovery, database optimization, program implementation, program delivery, program maintenance, analysis and reporting.

Order Fulfillment Cycle Diagram Ppt Sample
This is an order fulfillment cycle diagram ppt sample. This is a four stage process. The stages in this process are storage, incoming orders, picking, packing and despatch, reporting, stock control, incoming shipments.
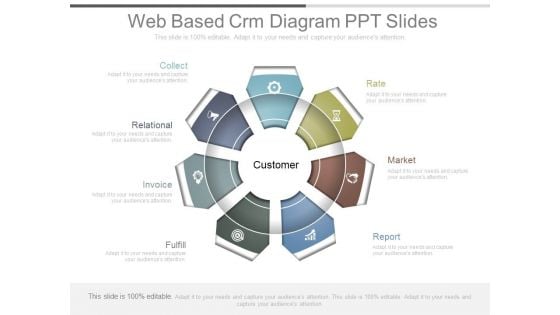
Web Based Crm Diagram Ppt Slides
This is a web based crm diagram ppt slides. This is a five stage process. The stages in this process are collect, relational, invoice, fulfill, rate, market, report, customer.
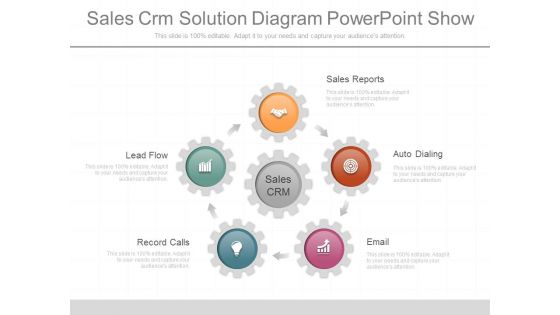
Sales Crm Solution Diagram Powerpoint Show
This is a sales crm solution diagram powerpoint show. This is a five stage process. The stages in this process are lead flow, record calls, email, auto dialing, sales reports, sales crm.
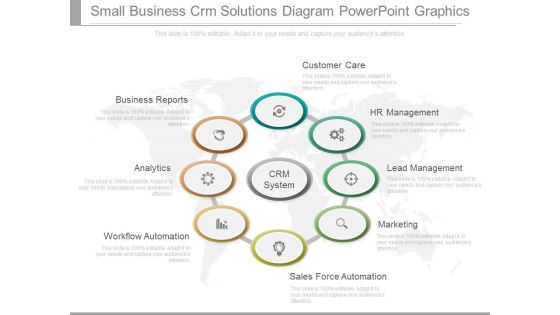
Small Business Crm Solutions Diagram Powerpoint Graphics
This is a small business crm solutions diagram powerpoint graphics. This is a eight stage process. The stages in this process are business reports, analytics, workflow automation, sales force automation, marketing, lead management, hr management, customer care, crm system.
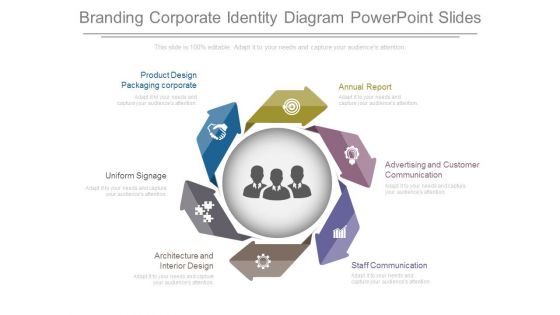
Branding Corporate Identity Diagram Powerpoint Slides
This is a branding corporate identity diagram powerpoint slides. This is a six stage process. The stages in this process are annual report, advertising and customer communication, staff communication, architecture and interior design uniform signage, product design packaging corporate.
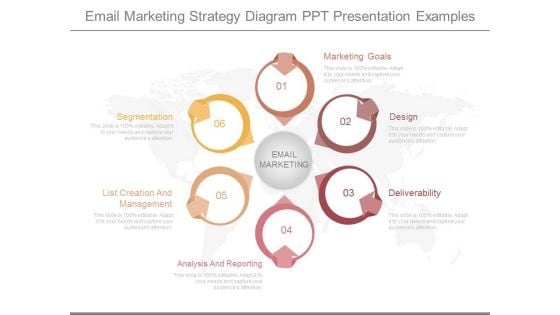
Email Marketing Strategy Diagram Ppt Presentation Examples
This is a email marketing strategy diagram ppt presentation examples. This is a six stage process. The stages in this process are segmentation, list creation and management, analysis and reporting, email marketing, marketing goals, design, deliverability.

 Home
Home