Report Icon
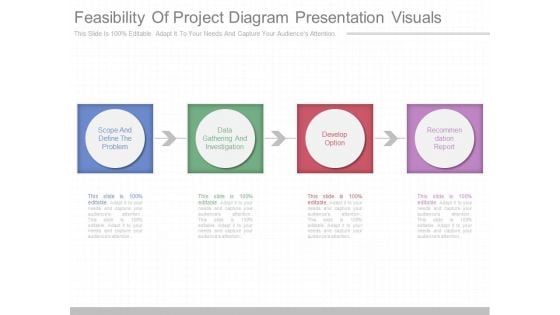
Feasibility Of Project Diagram Presentation Visuals
This is a feasibility of project diagram presentation visuals. This is a four stage process. The stages in this process are scope and define the problem, data gathering and investigation, develop option, recommendation report.
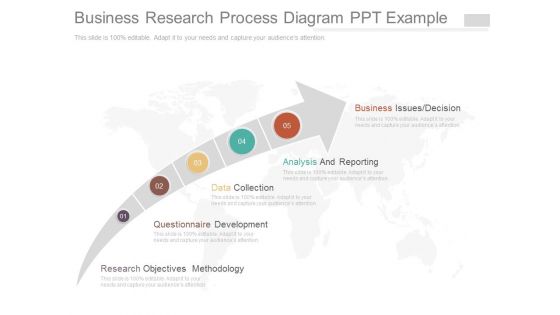
Business Research Process Diagram Ppt Example
This is a business research process diagram ppt example. This is a five stage process. The stages in this process are business issues decision, analysis and reporting, data collection, questionnaire development, research objectives methodology.
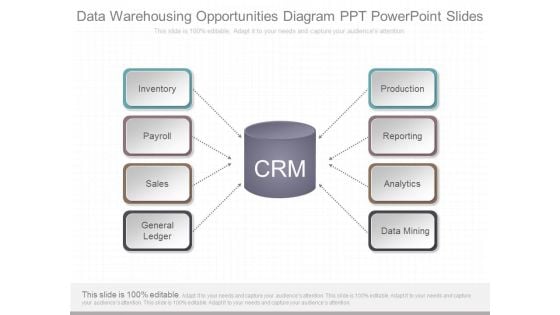
Data Warehousing Opportunities Diagram Ppt Powerpoint Slides
This is a data warehousing opportunities diagram ppt powerpoint slides. This is a eight stage process. The stages in this process are inventory, payroll, sales, ledger general, production, reporting, analytics, data mining.
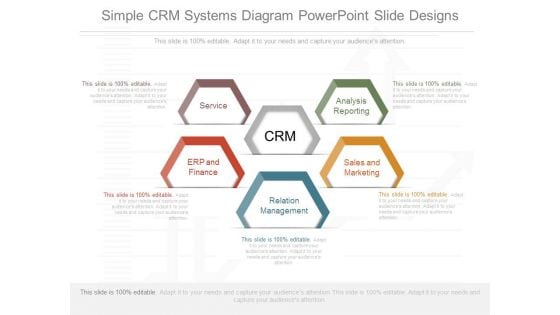
Simple Crm Systems Diagram Powerpoint Slide Designs
This is a simple crm systems diagram powerpoint slide designs. This is a five stage process. The stages in this process are service, erp and finance, analysis reporting, sales and marketing, relation management.
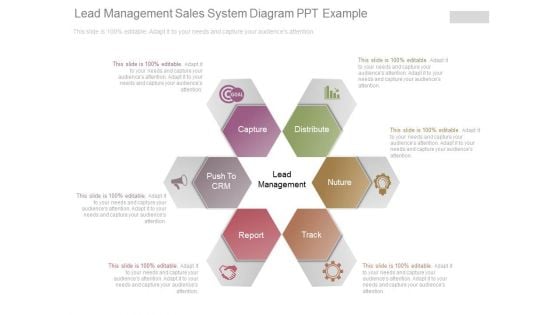
Lead Management Sales System Diagram Ppt Example
This is a lead management sales system diagram ppt example. This is a six stage process. The stages in this process are capture, distribute, nuture, track, report, push to crm, lead management.
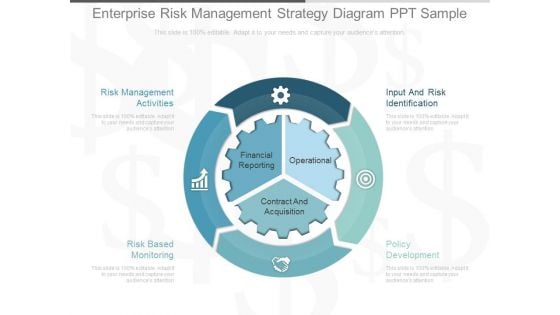
Enterprise Risk Management Strategy Diagram Ppt Sample
This is a enterprise risk management strategy diagram ppt sample. This is a three stage process. The stages in this process are risk management activities, input and risk identification, risk based monitoring, policy development, financial reporting, operational, contract and acquisition.\n\n\n\n\n\n\n\n
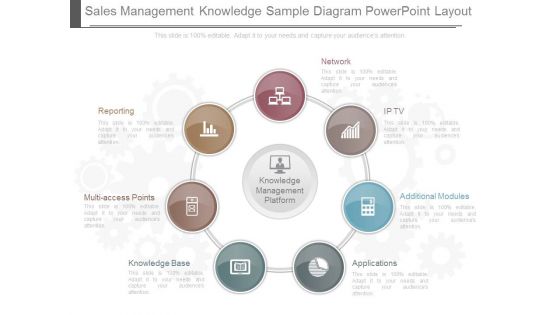
Sales Management Knowledge Sample Diagram Powerpoint Layout
This is a sales management knowledge sample diagram powerpoint layout. This is a seven stage process. The stages in this process are network, ip tv, additional modules, applications, knowledge base, multi access points, reporting.
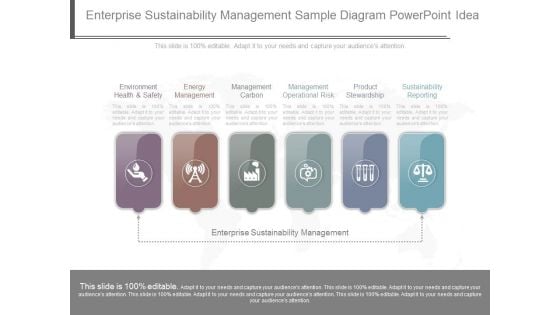
Enterprise Sustainability Management Sample Diagram Powerpoint Idea
This is a enterprise sustainability management sample diagram powerpoint idea. This is a six stage process. The stages in this process are environment health and safety, energy management, management carbon, management operational risk, product stewardship, sustainability reporting, enterprise sustainability management.
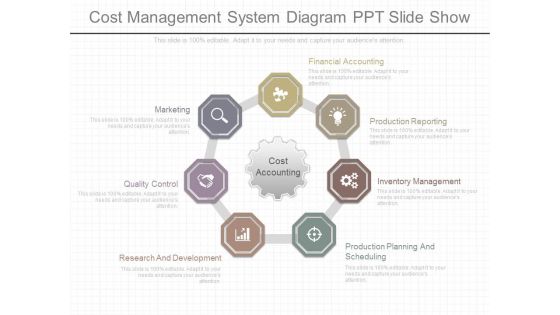
Cost Management System Diagram Ppt Slide Show
This is a cost management system diagram ppt slide show. This is a seven stage process. The stages in this process are research and development, quality control, marketing, financial accounting, production reporting, inventory management, production planning and scheduling, cost accounting.
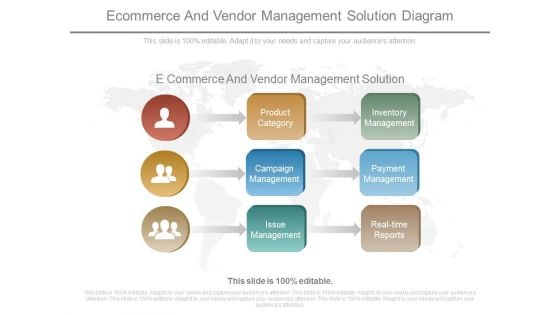
E Commerce And Vendor Management Solution Diagram
This is a e commerce and vendor management solution diagram. This is a nine stage process. The stages in this process are product category, campaign management, issue management, inventory management, payment management, real time reports.\n\n\n\n
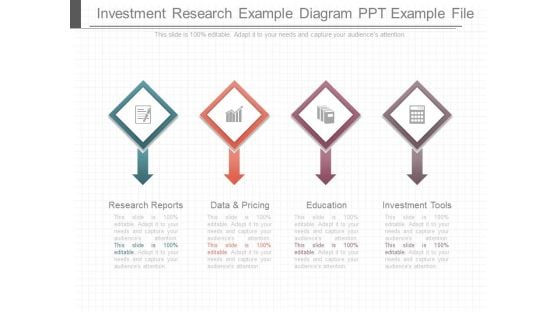
Investment Research Example Diagram Ppt Example File
This is a investment research example diagram ppt example file. This is a four stage process. The stages in this process are research reports, data and pricing, education, investment tools.
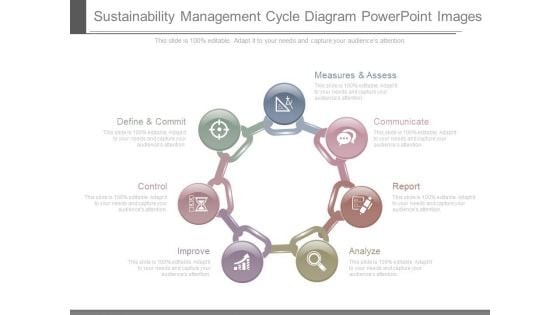
Sustainability Management Cycle Diagram Powerpoint Images
This is a sustainability management cycle diagram powerpoint images. This is a seven stage process. The stages in this process are define and commit, control, improve, analyze, report, communicate, measures and assess.
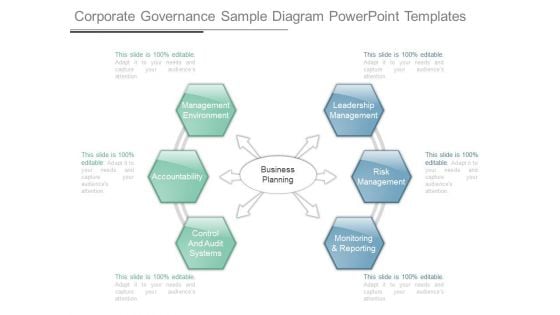
Corporate Governance Sample Diagram Powerpoint Templates
This is a corporate governance sample diagram powerpoint templates. This is a six stage process. The stages in this process are management environment, leadership management, accountability, control and audit systems, monitoring and reporting, risk management, business planning.

Service Level Management Sample Diagram Powerpoint Slide
This is a service level management sample diagram powerpoint slide. This is a five stage process. The stages in this process are service level management, availability sla, plan, monitor, report.

Streamline Commercial Lending Diagram Ppt Examples
This is a streamline commercial lending diagram ppt examples. This is a six stage process. The stages in this process are origination, structuring, due diligence, reporting, marketing, credit analysis.
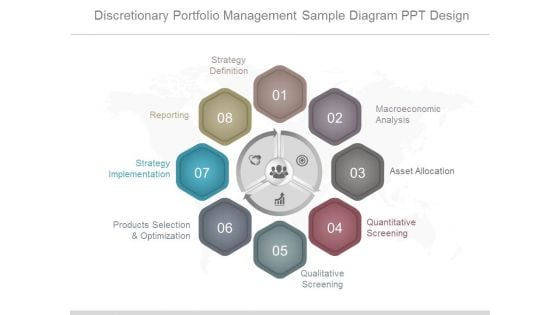
Discretionary Portfolio Management Sample Diagram Ppt Design
This is a discretionary portfolio management sample diagram ppt design. This is a eight stage process. The stages in this process are strategy definition, reporting, strategy implementation, products selection and optimization, macroeconomic analysis, asset allocation, quantitative screening, qualitative screening.
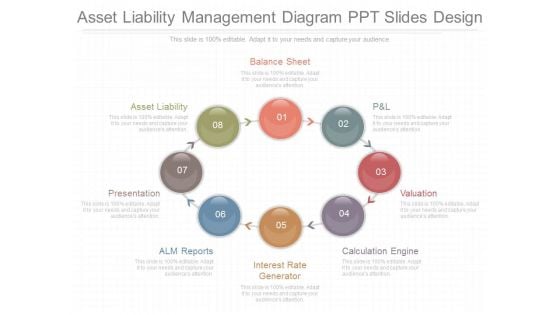
Asset Liability Management Diagram Ppt Slides Design
This is a asset liability management diagram ppt slides design. This is a eight stage process. The stages in this process are valuation, calculation engine, interest rate generator, alm reports, presentation, asset liability, balance sheet, p and l.
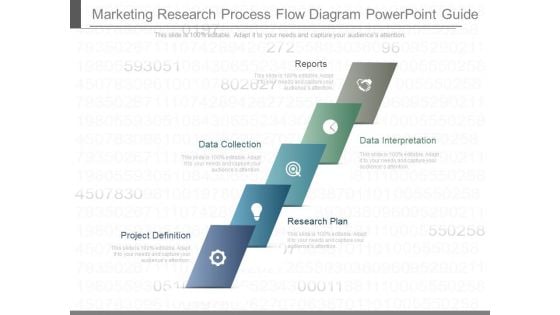
Marketing Research Process Flow Diagram Powerpoint Guide
This is a marketing research process flow diagram powerpoint guide. This is a five stage process. The stages in this process are reports, data interpretation, data collection, research plan, project definition.
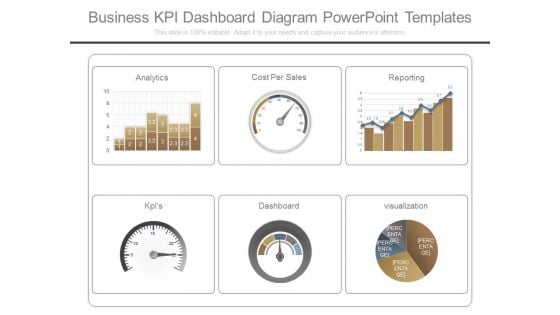
Business Kpi Dashboard Diagram Powerpoint Templates
This is a business kpi dashboard diagram powerpoint templates. This is a six stage process. The stages in this process are analytics, cost per sales, reporting, kpis, dashboard, visualization.
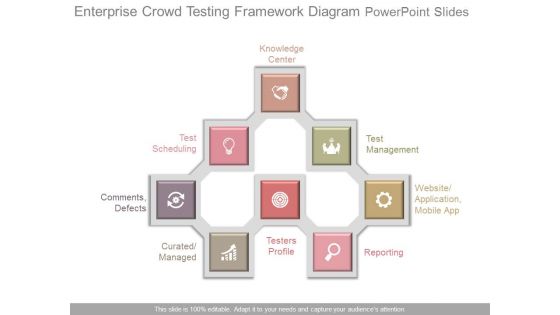
Enterprise Crowd Testing Framework Diagram Powerpoint Slides
This is a enterprise crowd testing framework diagram powerpoint slides. This is a eight stage process. The stages in this process are knowledge center, test scheduling, test management, comments defects, website application mobile app, curated managed, testers profile, reporting.
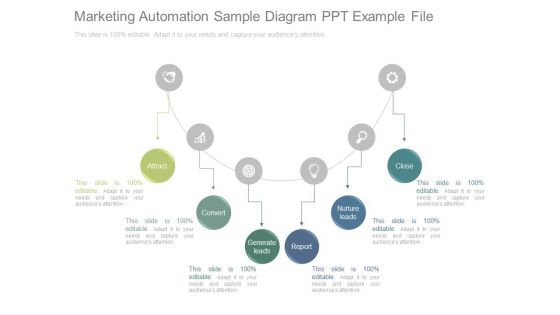
Marketing Automation Sample Diagram Ppt Example File
This is a marketing automation sample diagram ppt example file. This is a six stage process. The stages in this process are attract, convert, generate leads, report, nurture leads, close.
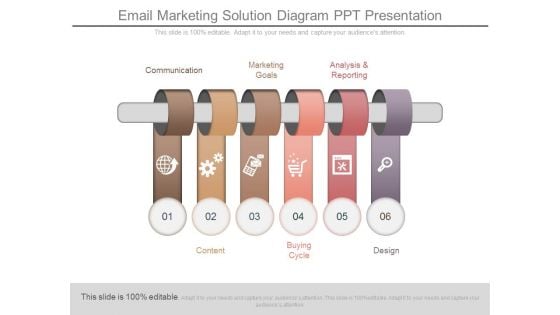
Email Marketing Solution Diagram Ppt Presentation
This is a email marketing solution diagram ppt presentation. This is a six stage process. The stages in this process are communication, marketing, goals, analysis and reporting, content, buying cycle, design.
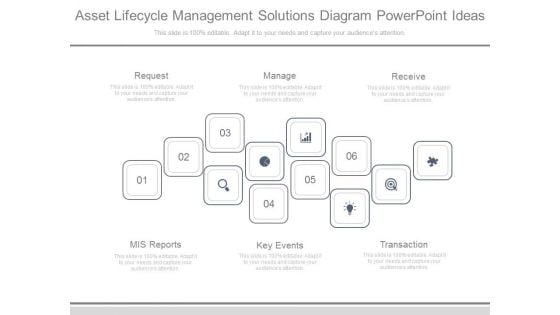
Asset Lifecycle Management Solutions Diagram Powerpoint Ideas
This is a asset lifecycle management solutions diagram powerpoint ideas. This is a six stage process. The stages in this process are request, manage, receive, mis reports, key events, transaction.
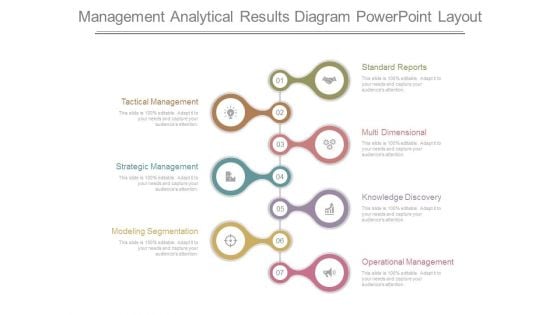
Management Analytical Results Diagram Powerpoint Layout
This is a management analytical results diagram powerpoint layout. This is a seven stage process. The stages in this process are standard reports, multi dimensional, knowledge discovery, operational management, modeling segmentation, strategic management, tactical management.

Annual Financial Planning Cycle Diagram Ppt Summary
This is a annual financial planning cycle diagram ppt summary. This is a six stage process. The stages in this process are annual report, risk management, strategy objectives, budget, strategy invectives, evaluate alternatives.
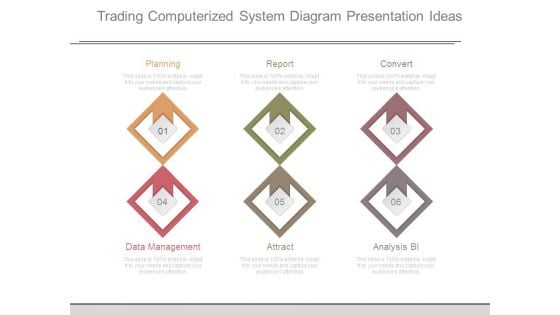
Trading Computerized System Diagram Presentation Ideas
This is a trading computerized system diagram presentation ideas. This is a six stage process. The stages in this process are planning, report, convert, data management, attract, analysis bi.
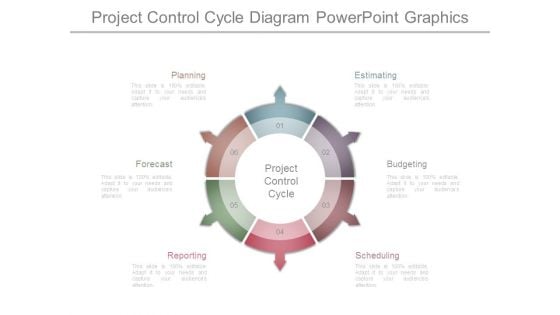
Project Control Cycle Diagram Powerpoint Graphics
This is a project control cycle diagram powerpoint graphics. This is a six stage process. The stages in this process are estimating, budgeting, scheduling, reporting, forecast, planning, project control cycle.

Internal Audit Process Diagram Presentation Powerpoint Example
This is a internal audit process diagram presentation powerpoint example. This is a six stage process. The stages in this process are our audit process, reporting, internal audit process, fieldwork, corrective action, planning.
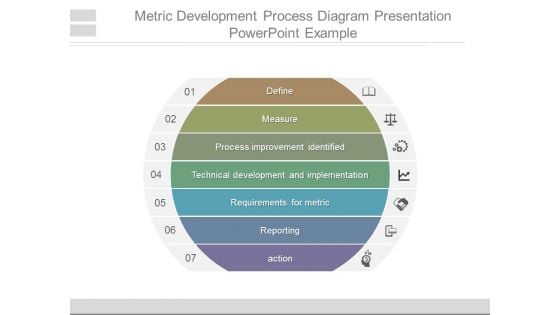
Metric Development Process Diagram Presentation Powerpoint Example
This is a metric development process diagram presentation powerpoint example. This is a seven stage process. The stages in this process are define, measure, process improvement identified, technical development and implementation, requirements for metric, reporting, action.
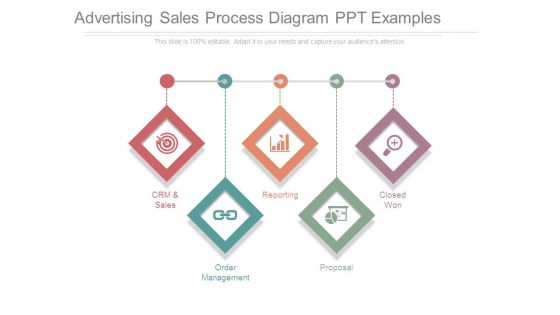
Advertising Sales Process Diagram Ppt Examples
This is a advertising sales process diagram ppt examples. This is a five stage process. The stages in this process are crm and sales, order management, reporting, proposal, closed won.
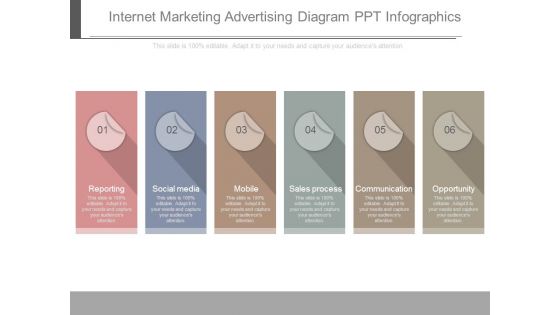
Internet Marketing Advertising Diagram Ppt Infographics
This is a internet marketing advertising diagram ppt infographics. This is a six stage process. The stages in this process are reporting, social media, mobile, sales process, communication, opportunity.
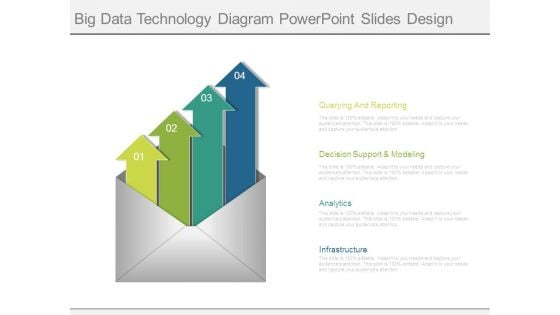
Big Data Technology Diagram Powerpoint Slides Design
This is a big data technology diagram powerpoint slides design. This is a four stage process. The stages in this process are querying and reporting, decision support and modeling, analytics, infrastructure.
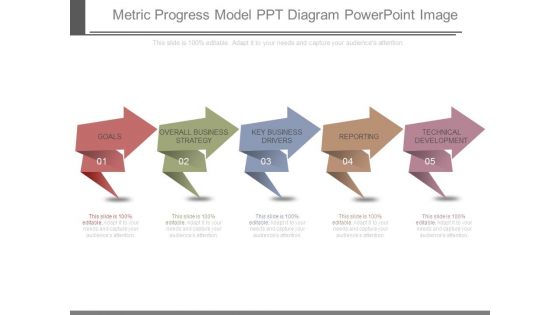
Metric Progress Model Ppt Diagram Powerpoint Image
This is a metric progress model ppt diagram powerpoint image. This is a five stage process. The stages in this process are goals, overall business strategy, key business drivers, reporting, technical development.
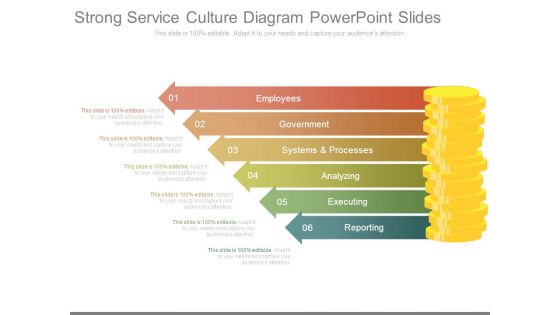
Strong Service Culture Diagram Powerpoint Slides
This is a strong service culture diagram powerpoint slides. This is a six stage process. The stages in this process are employees, government, systems and processes, analyzing, executing, reporting.
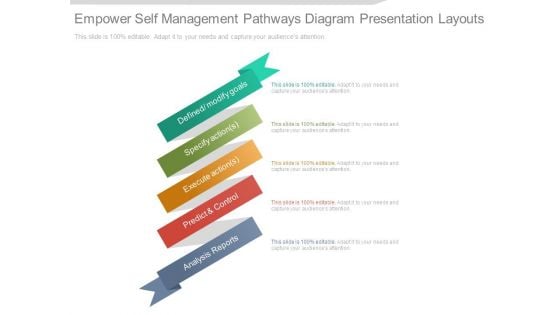
Empower Self Management Pathways Diagram Presentation Layouts
This is a Empower Self Management Pathways Diagram Presentation Layouts. This is a five stage process. The stages in this process are defined modify goals, specify action, execute action, predict and control, analysis reports.
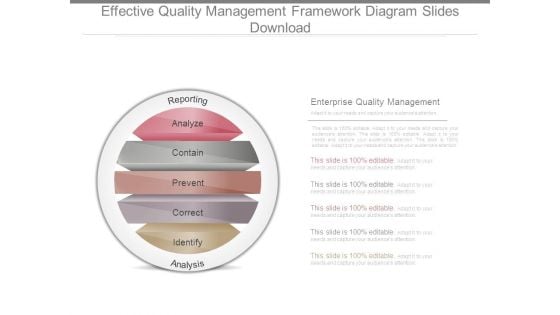
Effective Quality Management Framework Diagram Slides Download
This is a effective quality management framework diagram slides download. This is a five stage process. The stages in this process are reporting, analyze, contain, prevent, correct, identify, analysis, enterprise quality management.
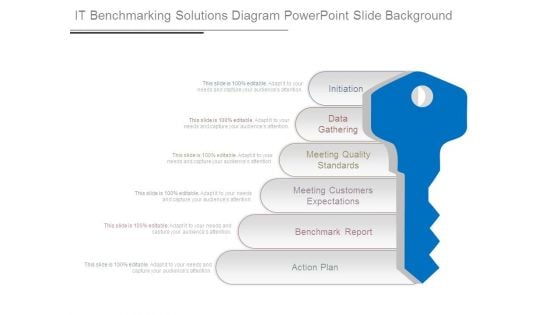
It Benchmarking Solutions Diagram Powerpoint Slide Background
This is a it benchmarking solutions diagram powerpoint slide background. This is a six stage process. The stages in this process are initiation, data gathering, meeting quality standards, meeting customers expectations, benchmark report, action plan.
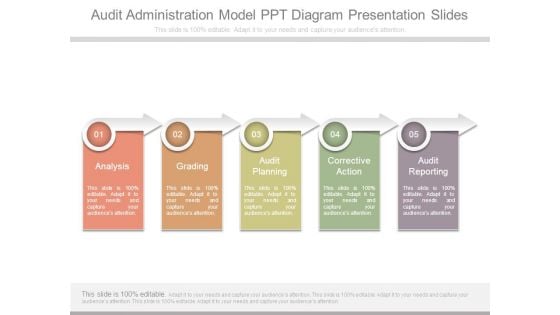
Audit Administration Model Ppt Diagram Presentation Slides
This is a audit administration model ppt diagram presentation slides. This is a five stage process. The stages in this process are analysis, grading, audit planning, corrective action, audit reporting.
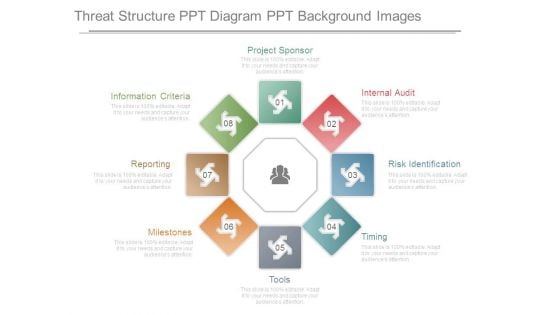
Threat Structure Ppt Diagram Ppt Background Images
This is a threat structure ppt diagram ppt background images. This is a eight stage process. The stages in this process are project sponsor, internal audit, risk identification, timing, tools, milestones, reporting, information criteria.
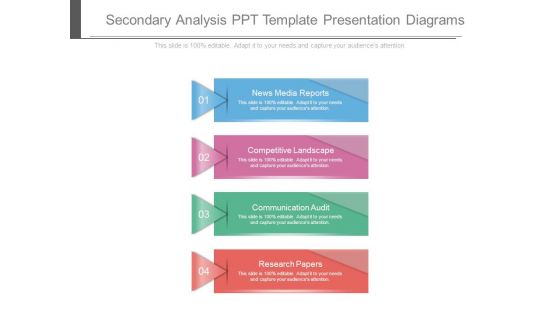
Secondary Analysis Ppt Template Presentation Diagrams
This is a secondary analysis ppt template presentation diagrams. This is a four stage process. The stages in this process are news media reports, competitive landscape, communication audit, research papers.
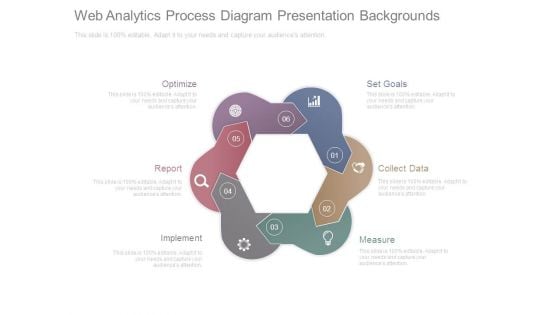
Web Analytics Process Diagram Presentation Backgrounds
This is a web analytics process diagram presentation backgrounds. This is a six stage process. The stages in this process are optimize, report, implement, measure, collect data, set goals.
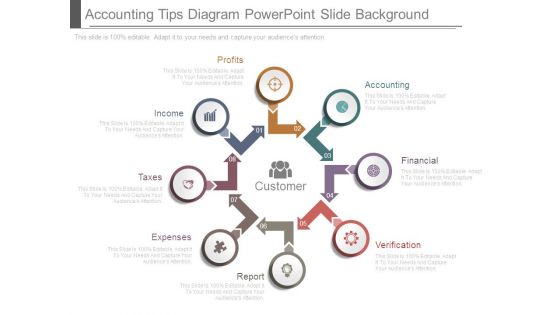
Accounting Tips Diagram Powerpoint Slide Background
This is a accounting tips diagram powerpoint slide background. This is a eight stage process. The stages in this process are accounting, financial, verification, report, expenses, taxes, income, profits, customer.
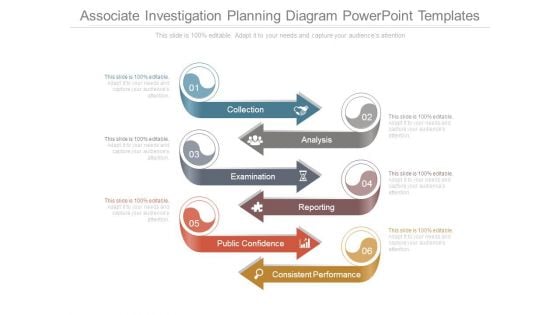
Associate Investigation Planning Diagram Powerpoint Templates
This is a associate investigation planning diagram powerpoint templates. This is a six stage process. The stages in this process are collection, analysis, examination, reporting, public confidence, consistent performance.

Customized Analytical Support Diagram Powerpoint Presentation Examples
This is a customized analytical support diagram powerpoint presentation examples. This is a four stage process. The stages in this process are scope and define the problem, data gathering and investigation, develop options, recommendation report.
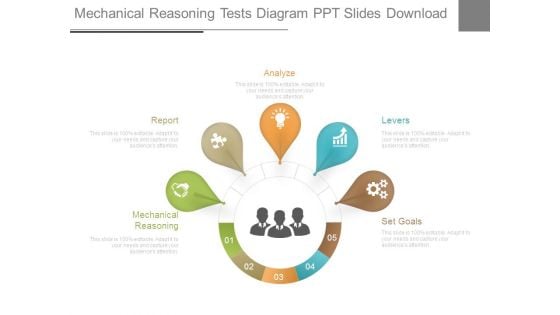
Mechanical Reasoning Tests Diagram Ppt Slides Download
This is a mechanical reasoning tests diagram ppt slides download. This is a five stage process. The stages in this process are mechanical reasoning, report, analyze, levers, set goals.
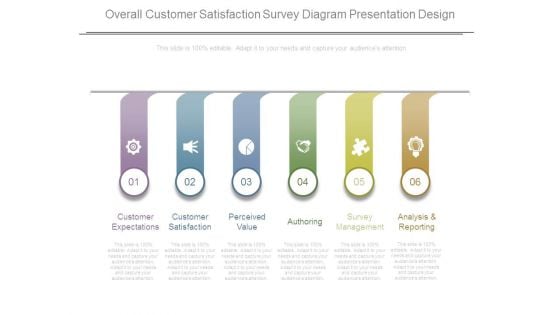
Overall Customer Satisfaction Survey Diagram Presentation Design
This is a overall customer satisfaction survey diagram presentation design. This is a six stage process. The stages in this process are customer expectations, customer satisfaction, perceived value, authoring, survey management, analysis and reporting.
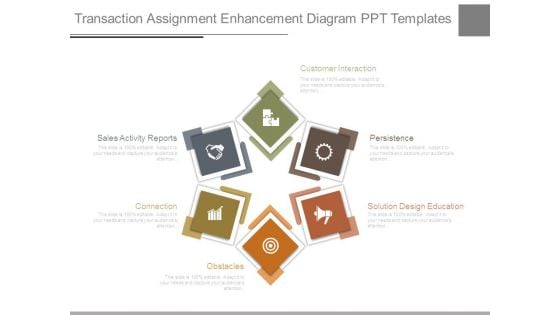
Transaction Assignment Enhancement Diagram Ppt Templates
This is a transaction assignment enhancement diagram ppt templates. This is a six stage process. The stages in this process are customer interaction, persistence, solution design education, obstacles, connection, sales activity reports.
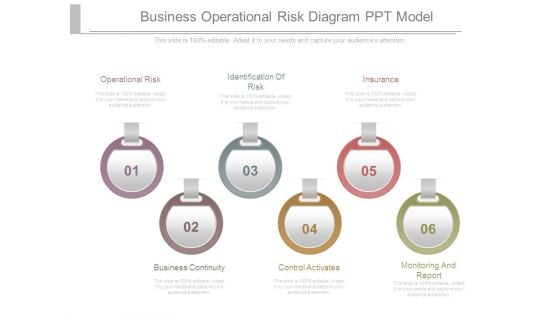
Business Operational Risk Diagram Ppt Model
This is a business operational risk diagram ppt model. This is a six stage process. The stages in this process are operational risk, identification of risk, insurance, business continuity, control activates, monitoring and report.
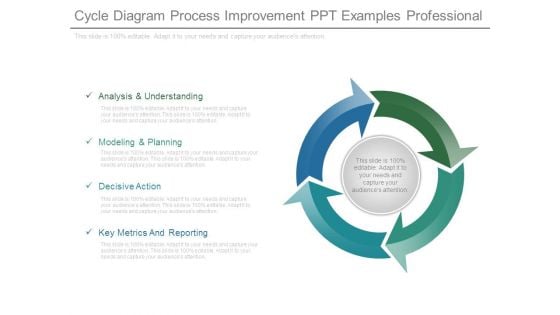
Cycle Diagram Process Improvement Ppt Examples Professional
This is a cycle diagram process improvement ppt examples professional. This is a four stage process. The stages in this process are analysis and understanding, modeling and planning, decisive action, key metrics and reporting.
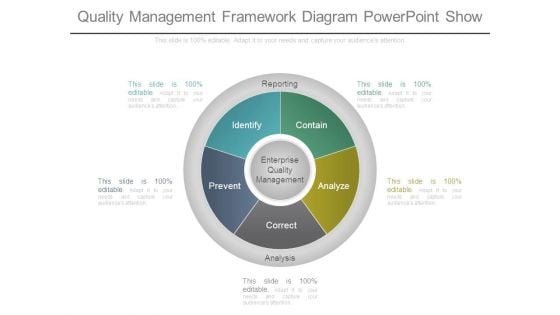
Quality Management Framework Diagram Powerpoint Show
This is a quality management framework diagram powerpoint show. This is a five stage process. The stages in this process are enterprise quality management, reporting, identify, prevent, correct, analyze, contain, analysis.
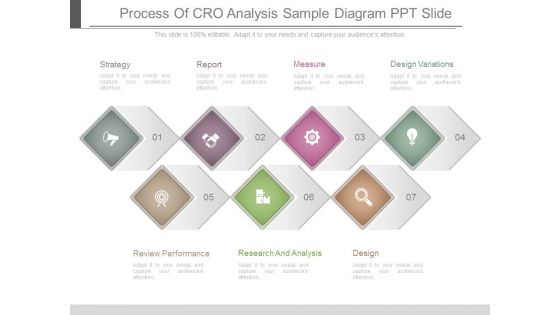
Process Of Cro Analysis Sample Diagram Ppt Slide
This is a process of cro analysis sample diagram ppt slide. This is a seven stage process. The stages in this process are strategy, report, measure, design variations, design, research and analysis, review performance.
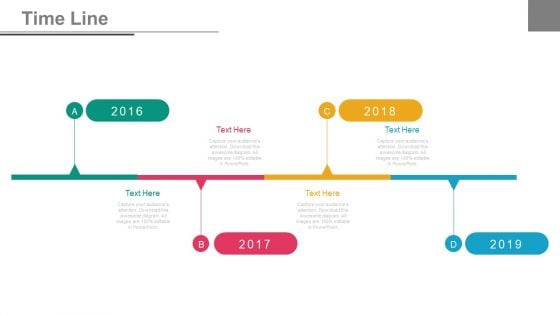
Four Years Tags Timeline Diagram Powerpoint Slides
This PowerPoint timeline slide design can be used to display yearly business report. This timeline template has been designed with four years tags. Download this PowerPoint timeline template to make impressive presentations.
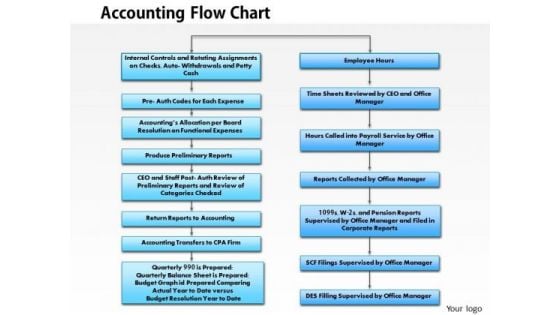
Business Framework Accounting Flowchart PowerPoint Presentation
This flowchart depicts the steps involved in the accounting process from when a transaction occurs up the end of period reports. Use this diagram to display accounting procedure in graphical way.

Ecommerce Features Sample Diagram Powerpoint Presentation Templates
This is a ecommerce features sample diagram powerpoint presentation templates. This is a fifteen stage process. The stages in this process are unlimited categories and products, create online payment facilities, order history, gift certificate, solid analytics and reporting, online sales reports, multi currency support, inventory management system, shopping cart system, customer product reviews, flexible pricing management, integrated shipping, catalog management, product feed support, discount of reward based schemes.\n\n\n\n\n\n\n\n
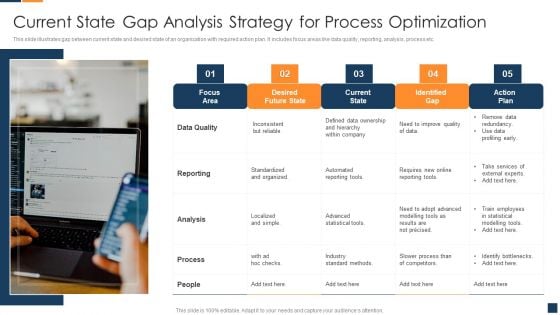
Current State Gap Analysis Strategy For Process Optimization Diagrams PDF
This slide illustrates gap between current state and desired state of an organization with required action plan. It includes focus areas like data quality, reporting, analysis, process etc. Presenting Current State Gap Analysis Strategy For Process Optimization Diagrams PDF to dispense important information. This template comprises five stages. It also presents valuable insights into the topics including Data Quality, Reporting, Analysis. This is a completely customizable PowerPoint theme that can be put to use immediately. So, download it and address the topic impactfully.
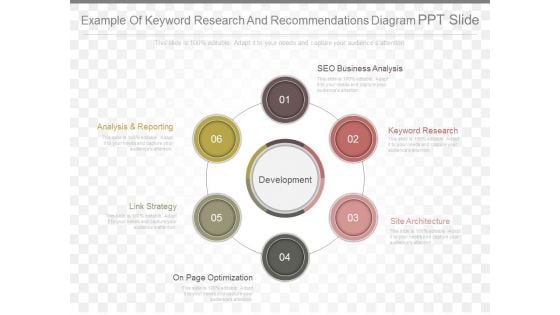
Example Of Keyword Research And Recommendations Diagram Ppt Slide
This is an example of keyword research and recommendations diagram ppt slide. This is a six stage process. The stages in this process are analysis and reporting, link strategy, on page optimization, site architecture, keyword research, seo business analysis.

Improve Net Promoter Score Diagram Ppt Slide Template
This is a improve net promoter score diagram ppt slide template. This is a five stage process. The stages in this process are program governance, driving innovation, action and accountability, enrolling and equipping the organization, measurement analysis and reporting.
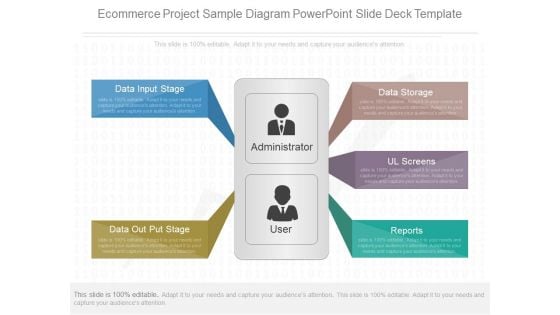
Ecommerce Project Sample Diagram Powerpoint Slide Deck Template
This is a ecommerce project sample diagram powerpoint slide deck template. This is a five stage process. The stages in this process are data input stage, data out put stage, data storage, ul screens, reports.
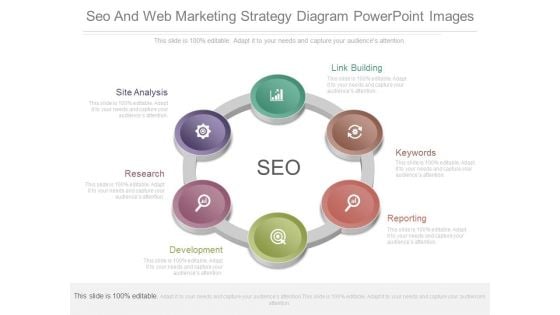
Seo And Web Marketing Strategy Diagram Powerpoint Images
This is a seo and web marketing strategy diagram powerpoint images. This is a six stage process. The stages in this process are seo, link building, keywords, reporting, development, research, site analysis.
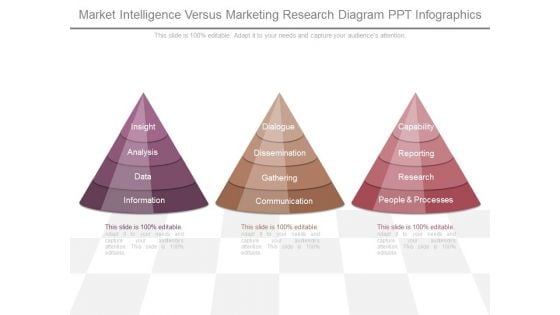
Market Intelligence Versus Marketing Research Diagram Ppt Infographics
This is a market intelligence versus marketing research diagram ppt infographics. This is a three stage process. The stages in this process are insight, analysis, data, information, dialogue, dissemination, gathering, communication, capability, reporting, research, people and processes.

 Home
Home