Revenue Chart
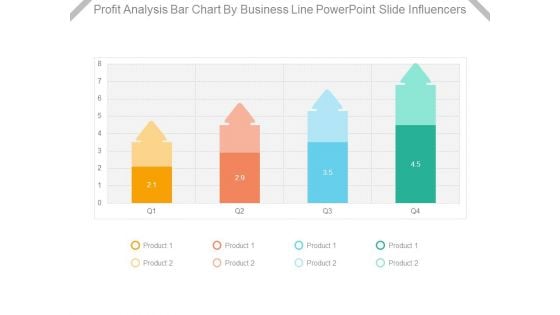
Profit Analysis Bar Chart By Business Line Powerpoint Slide Influencers
This is a profit analysis bar chart by business line powerpoint slide influencers. This is a four stage process. The stages in this process are product.
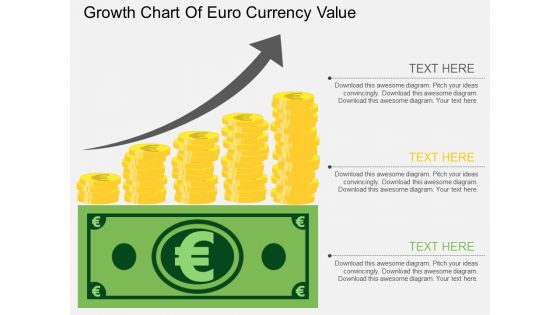
Growth Chart Of Euro Currency Value Powerpoint Template
The above PPT template displays growth chart of Euro currency. This diagram helps to exhibit Euro currency value growth. Adjust the above diagram in your business presentations to visually support your content.

Business Chart Marketing PowerPoint Templates And PowerPoint Backgrounds 0211
Microsoft PowerPoint Template and Background with up arrow showing increase in money Our Business Chart Marketing PowerPoint Templates And PowerPoint Backgrounds 0211 will never fight shy. They are confident of addressing any and every issue.
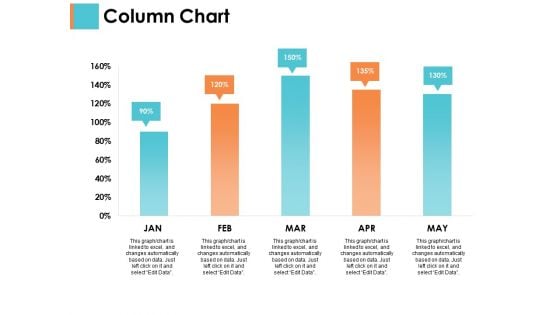
Column Chart Sample Budget Ppt Ppt PowerPoint Presentation Infographics Brochure
This is a column chart sample budget ppt ppt powerpoint presentation infographics brochure. This is a two stage process. The stages in this process are business, management, strategy, analysis, marketing.
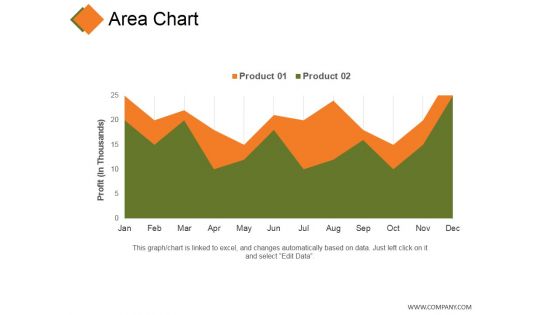
Area Chart Ppt PowerPoint Presentation Gallery Clipart Images
This is a area chart ppt powerpoint presentation gallery clipart images. This is a two stage process. The stages in this process are product, profit, business, finance, marketing.
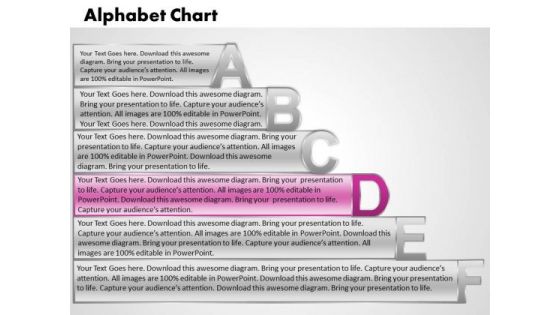
Ppt Alphabet Chart With Textboxes Business Plan PowerPoint Process Templates
PPT alpahabet chart with textboxes business plan powerpoint Process Templates-Use this Amazing PowerPoint Diagram which shows the different way to represent your text and make your Presentation more interesting and impressive to watch for Audiences.-PPT alpahabet chart with textboxes business plan powerpoint Process Templates Orient teams with our Ppt Alphabet Chart With Textboxes Business Plan PowerPoint Process Templates. Download without worries with our money back guaranteee.
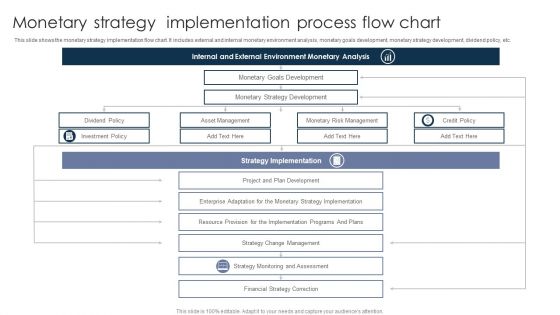
Monetary Strategy Implementation Process Flow Chart Brochure PDF
This slide shows the monetary strategy implementation flow chart. It includes external and internal monetary environment analysis, monetary goals development, monetary strategy development, dividend policy, etc. Pitch your topic with ease and precision using this Monetary Strategy Implementation Process Flow Chart Brochure PDF. This layout presents information on Dividend Policy, Investment Policy, Asset Management. It is also available for immediate download and adjustment. So, changes can be made in the color, design, graphics or any other component to create a unique layout.

Profits Bar Chart Finance PowerPoint Templates And PowerPoint Themes 0612
Profits Bar Chart Finance PowerPoint Templates And PowerPoint Themes PPT Slides-Microsoft Powerpoint Templates and Background with graph with arrow Augment your adeptness with our Profits Bar Chart Finance PowerPoint Templates And PowerPoint Themes 0612. Give a boost to your decisive character.
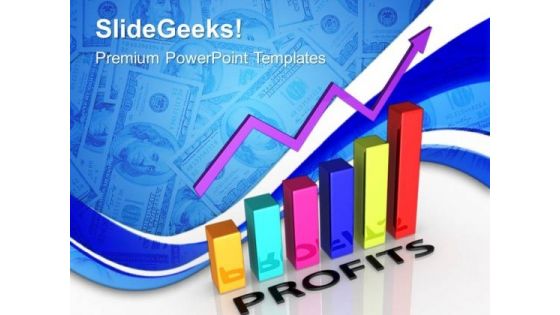
Profits Bar Chart Sales PowerPoint Templates And PowerPoint Themes 0612
Profits Bar Chart Sales PowerPoint Templates And PowerPoint Themes PPT Slides-Microsoft Powerpoint Templates and Background with graph with arrow Let our Profits Bar Chart Sales PowerPoint Templates And PowerPoint Themes 0612 do your errands. They will bring in the goodies for you.
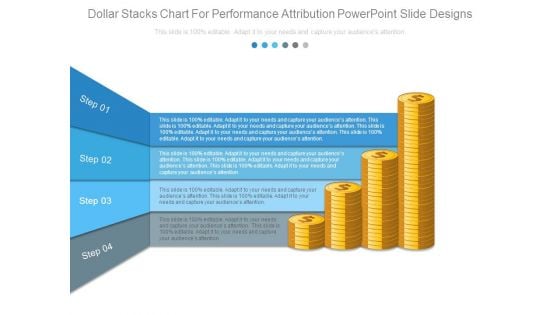
Dollar Stacks Chart For Performance Attribution Powerpoint Slide Designs
This is a dollar stacks chart for performance attribution powerpoint slide designs. This is a four stage process. The stages in this process are step.
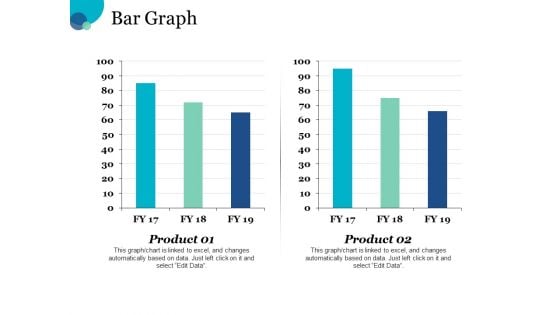
Bar Graph Chart Ppt PowerPoint Presentation Portfolio Templates
This is a bar graph chart ppt powerpoint presentation portfolio templates. This is a two stage process. The stages in this process are financial, minimum, medium, maximum.
Org Chart Beauty Brand Capital Raising Pitch Deck Icons Pdf
This slide shows diagram representing the organizational structure of the company which can be used to understand the positions of key members. Crafting an eye catching presentation has never been more straightforward. Let your presentation shine with this tasteful yet straightforward Org Chart Beauty Brand Capital Raising Pitch Deck Icons Pdf template. It offers a minimalistic and classy look that is great for making a statement. The colors have been employed intelligently to add a bit of playfulness while still remaining professional. Construct the ideal Org Chart Beauty Brand Capital Raising Pitch Deck Icons Pdf that effortlessly grabs the attention of your audience. Begin now and be certain to wow your customers. This slide shows diagram representing the organizational structure of the company which can be used to understand the positions of key members.
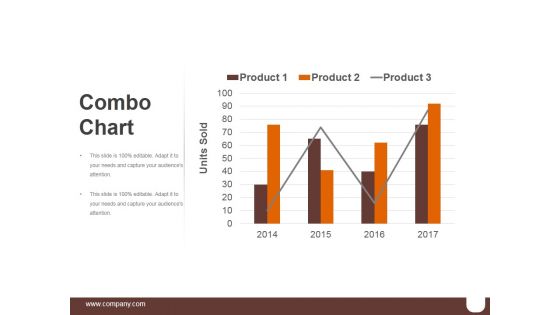
Combo Chart Template 1 Ppt PowerPoint Presentation Themes
This is a combo chart template 1 ppt powerpoint presentation themes. This is a four stage process. The stages in this process are business, marketing, finance, timeline, management.

Financial Information Systems Chart Example Of Ppt Presentation
This is a financial information systems chart example of ppt presentation. This is a three stage process. The stages in this process are process, people, value, technology.
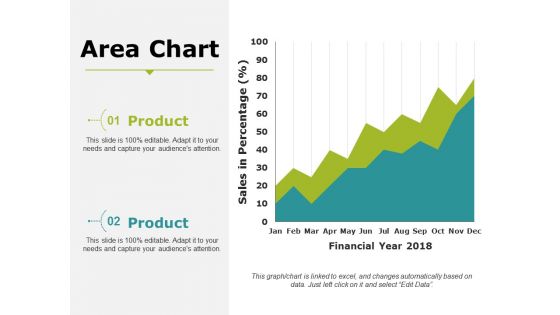
Area Chart Ppt PowerPoint Presentation Infographic Template Portrait
This is a area chart ppt powerpoint presentation infographic template portrait. This is a two stage process. The stages in this process are business, marketing, strategy, planning, finance.
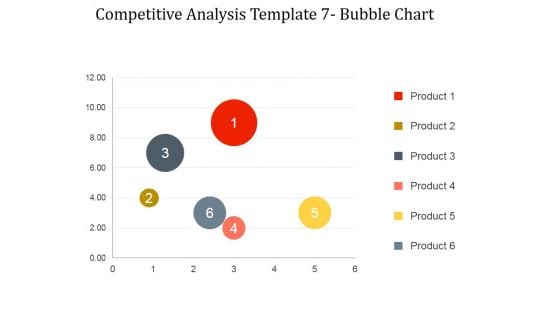
Competitive Analysis Bubble Chart Ppt PowerPoint Presentation Templates
This is a competitive analysis bubble chart ppt powerpoint presentation templates. This is a six stage process. The stages in this process are product, business, management, marketing, strategy.
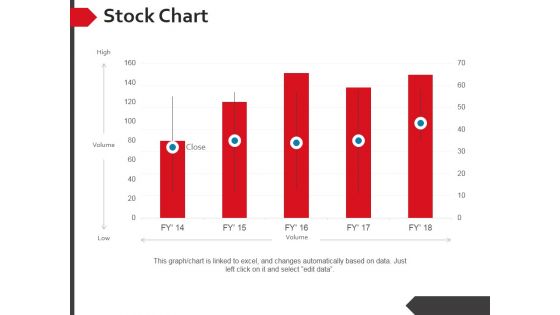
Stock Chart Ppt PowerPoint Presentation Summary Background Designs
This is a stock chart ppt powerpoint presentation summary background designs. This is a five stage process. The stages in this process are high, volume, low.
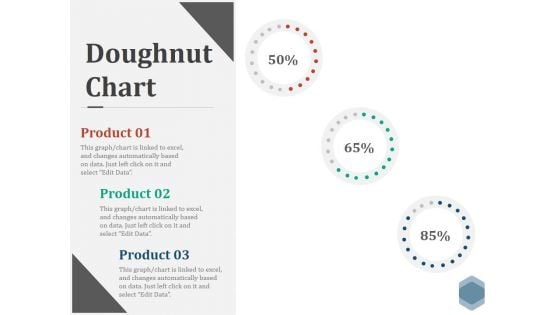
Doughnut Chart Ppt PowerPoint Presentation Visual Aids Files
This is a doughnut chart ppt powerpoint presentation visual aids files. This is a three stage process. The stages in this process are finance, donut, percentage, business, marketing.
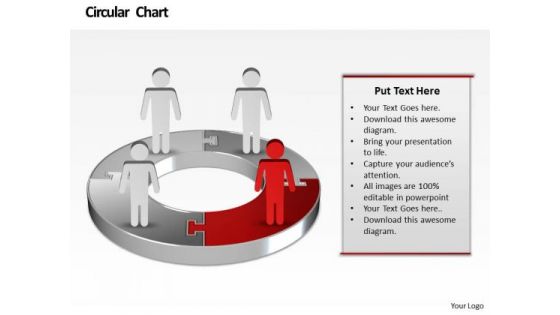
Ppt Illustration Of Financial Pie Chart Marketing Presentation PowerPoint Templates
PPT illustration of financial pie chart marketing presentation powerpoint Templates-You have the people in place, selected the team leaders and all are raring to go. You have the plans ready for them to absorb and understand. Educate your team with your thoughts and logic. -PPT illustration of financial pie chart marketing presentation powerpoint Templates-Abstract, Access, Arrow, Background, Business, Chart, Circle, Concept, Conceptual, Connection, Corporate, Creative, Cycle, Design, Different, Element, Empty, Form, Frame, Graphic, Group, Idea, Illustration, Part, Piece, Place, Process, Red, Shapes, Solution, Special, Speech, Strategy, Symbol Our Ppt Illustration Of Financial Pie Chart Marketing Presentation PowerPoint Templates can be aesthetically appealing. Expose your audience to the art of beauty.
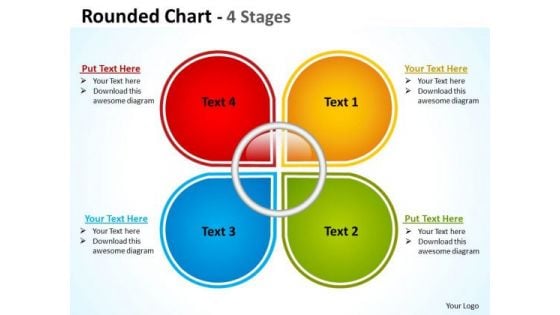
Marketing Diagram Rounded Chart With 4 Stages Strategic Management
Your Grasp Of Economics Is Well Known. Help Your Audience Comprehend Issues With Our Marketing Diagram Rounded Chart With 4 Stages Strategic Management Powerpoint Templates.
Chart Variations To Compare Quarterly Performance Ppt Icon
This is a chart variations to compare quarterly performance ppt icon. This is a five stage process. The stages in this process are series, business, marketing, finance, success.
Stock Chart Ppt PowerPoint Presentation Icon Graphic Images
This is a stock chart ppt powerpoint presentation icon graphic images. This is a five stage process. The stages in this process are high, volume, low, close.
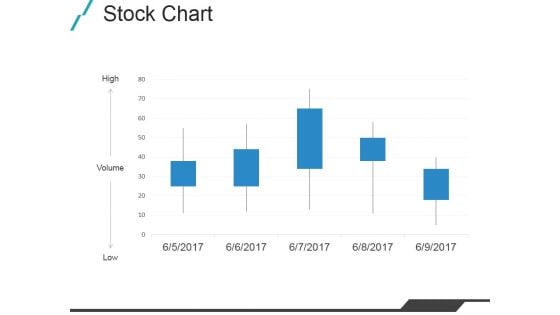
Stock Chart Ppt PowerPoint Presentation Outline Slide Portrait
This is a stock chart ppt powerpoint presentation outline slide portrait. This is a five stage process. The stages in this process are high, volume, low, business.
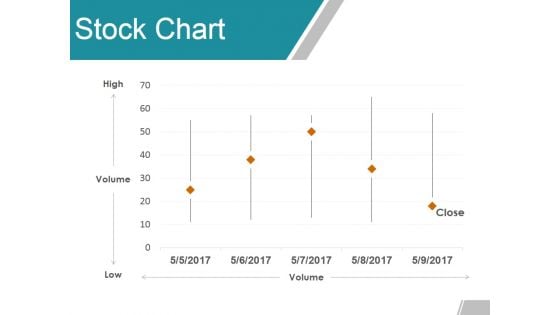
Stock Chart Ppt PowerPoint Presentation Summary Graphics Pictures
This is a stock chart ppt powerpoint presentation summary graphics pictures. This is a five stage process. The stages in this process are high, volume, low, close, finance.
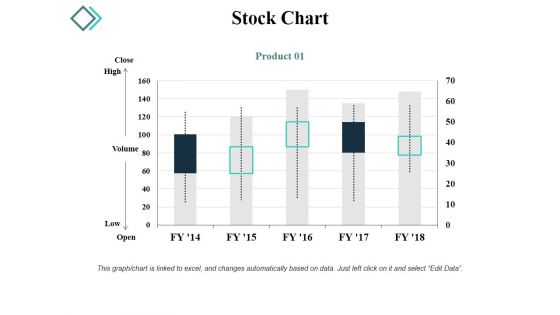
Stock Chart Ppt PowerPoint Presentation Gallery Graphic Images
This is a stock chart ppt powerpoint presentation gallery graphic images. This is a five stage process. The stages in this process are close, high, volume, low, open.
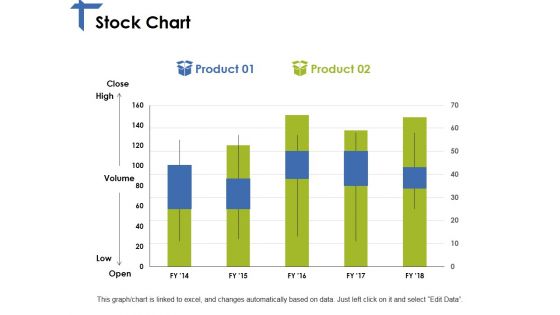
Stock Chart Ppt PowerPoint Presentation Slides Graphics Pictures
This is a stock chart ppt powerpoint presentation slides graphics pictures. This is a two stage process. The stages in this process are product, high, volume, low, open.
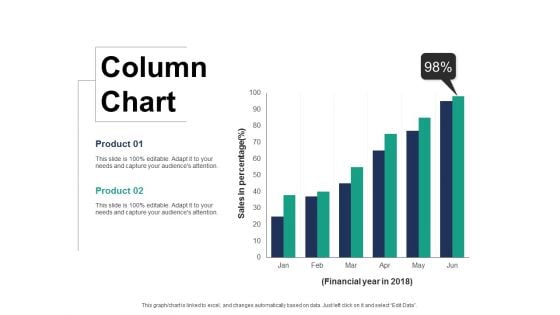
Column Chart Finance Ppt PowerPoint Presentation Layouts Display
This is a column chart finance ppt powerpoint presentation layouts display. This is a two stage process. The stages in this process are finance, marketing, management, investment, analysis.
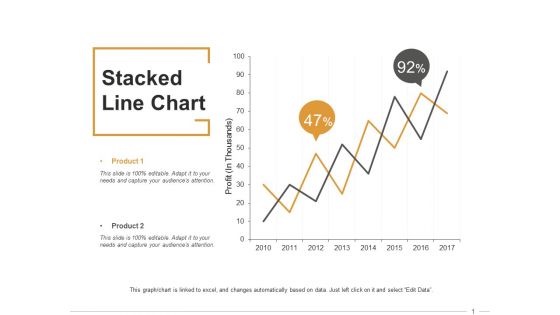
Stacked Line Chart Ppt PowerPoint Presentation Inspiration Format
This is a stacked line chart ppt powerpoint presentation inspiration format. This is a two stage process. The stages in this process are finance, marketing, management, investment, analysis.
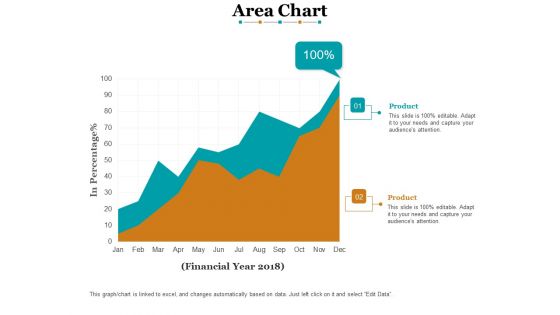
Area Chart Finance Ppt PowerPoint Presentation Model Ideas
This is a area chart finance ppt powerpoint presentation model ideas. This is a two stage process. The stages in this process are finance, marketing, analysis, business, investment.
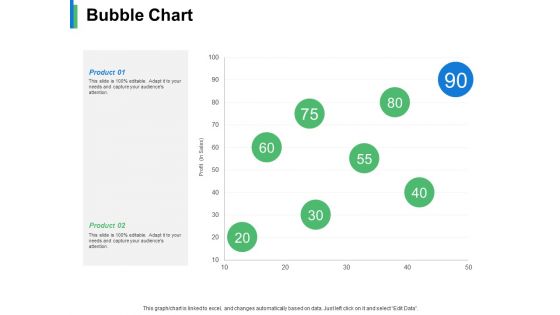
Bubble Chart Product Ppt PowerPoint Presentation Infographics Backgrounds
This is a bubble chart product ppt powerpoint presentation infographics backgrounds. This is a two stage process. The stages in this process are business, management, strategy, marketing, sales.
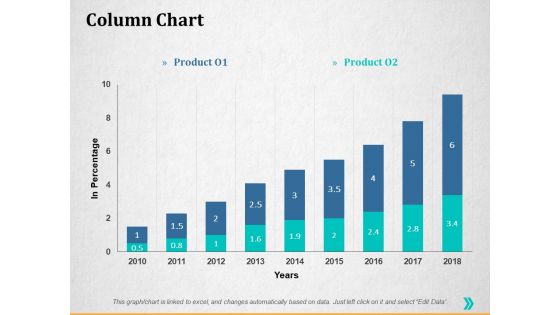
Column Chart Ppt PowerPoint Presentation Infographics Graphics Template
This is a column chart ppt powerpoint presentation infographics graphics template. This is a two stage process. The stages in this process are percentage, product, business, management, marketing.
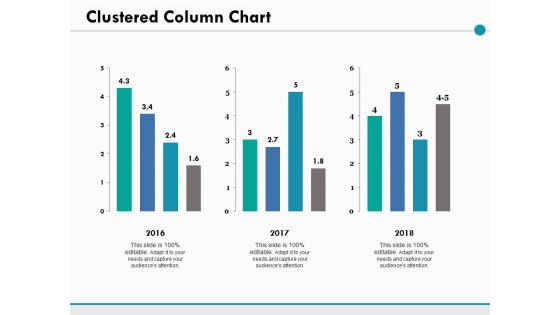
Clustered Column Chart Ppt PowerPoint Presentation Ideas Picture
This is a clustered column chart ppt powerpoint presentation ideas picture. This is a three stage process. The stages in this process are percentage, product, management, marketing.
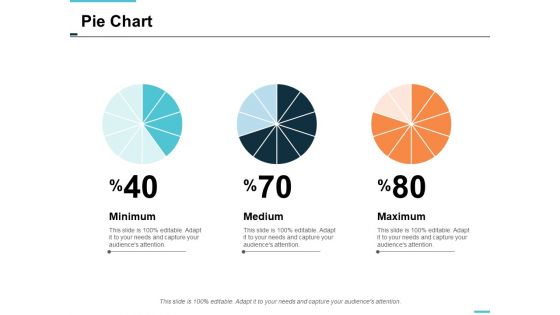
pie chart finance ppt powerpoint presentation styles skills
This is a pie chart finance ppt powerpoint presentation styles skills. This is a three stage process. The stages in this process are finance, marketing, management, investment, analysis.

Combo Chart Finance Ppt PowerPoint Presentation Portfolio Guidelines
This is a combo chart finance ppt powerpoint presentation portfolio guidelines. This is a three stage process. The stages in this process are finance, marketing, management, investment, analysis.
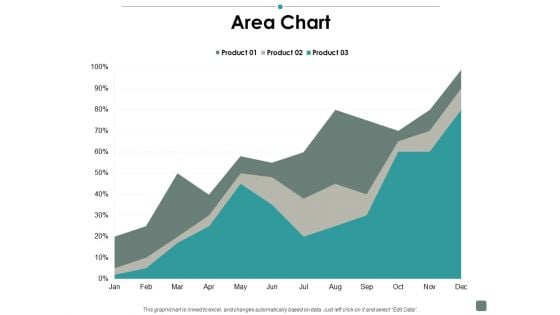
Area Chart Contribution Ppt PowerPoint Presentation Gallery Structure
This is a area chart contribution ppt powerpoint presentation gallery structure. This is a three stage process. The stages in this process are business, management, strategy, analysis, marketing.
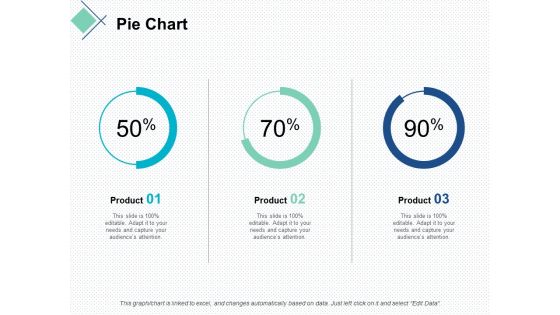
pie chart finance marketing ppt powerpoint presentation slides demonstration
This is a pie chart finance marketing ppt powerpoint presentation slides demonstration. This is a stage process. The stages in this process are finance, marketing, management, investment, analysis.
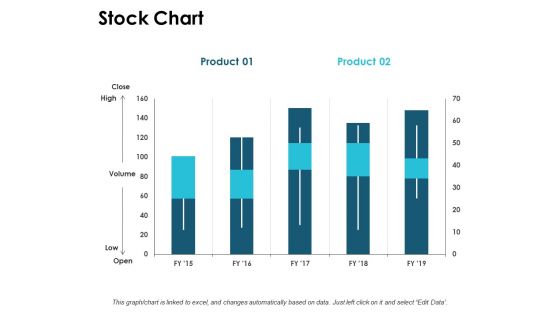
Stock Chart Graph Ppt PowerPoint Presentation Ideas Demonstration
This is a stock chart graph ppt powerpoint presentation ideas demonstration. This is a three stage process. The stages in this process are finance, marketing, management, investment, analysis.
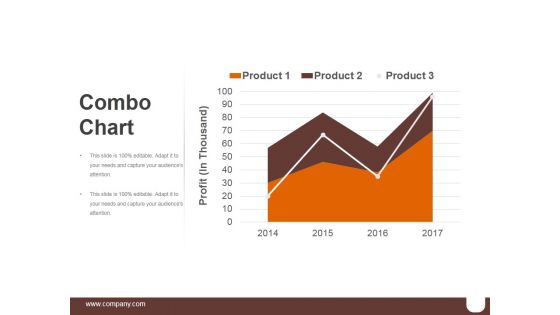
Combo Chart Template 2 Ppt PowerPoint Presentation Graphics
This is a combo chart template 2 ppt powerpoint presentation graphics. This is a three stage process. The stages in this process are business, marketing, finance, growth, management.
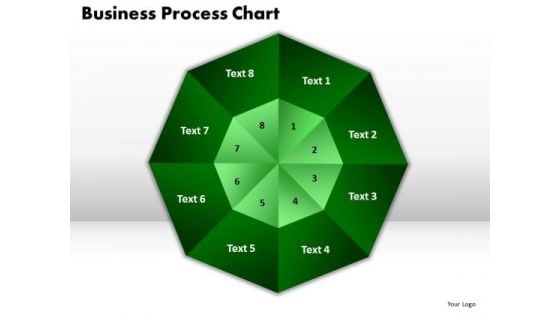
PowerPoint Template Business Process Chart Marketing Ppt Slides
PowerPoint Template Business Process Chart Marketing PPT Slides-The template offers an excellent background to build up the various stages of your business process. This PowerPoint Process Chart shows the eight Different Layers which are to be followed in any business. This Business Diagram can be used in Marketing, Banking, and Management etc. This Diagram explains eight different topics.-PowerPoint Template Business Process Chart Marketing PPT Slides Implement plans with our PowerPoint Template Business Process Chart Marketing Ppt Slides. Download without worries with our money back guaranteee.
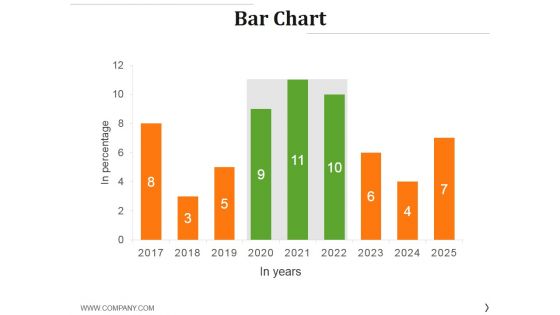
Bar Chart Ppt PowerPoint Presentation Styles Graphics Example
This is a bar chart ppt powerpoint presentation styles graphics example. This is a nine stage process. The stages in this process are graph, growth, success, business, finance.
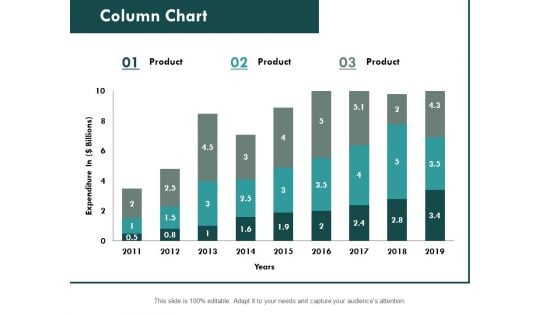
Column Chart Graph Ppt PowerPoint Presentation Slides File Formats
This is a combo chart bar ppt powerpoint presentation slides portfolio. This is a three stage process. The stages in this process are finance, marketing, analysis, investment, million.
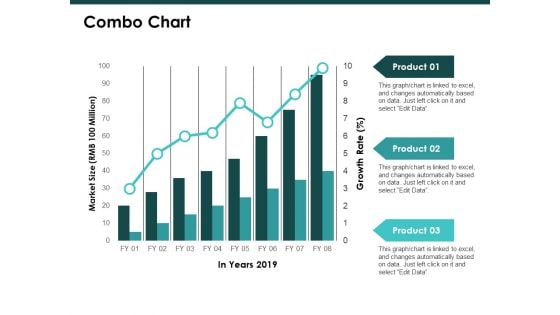
Combo Chart Graph Ppt PowerPoint Presentation Inspiration Template
This is a combo chart graph ppt powerpoint presentation inspiration template. This is a three stage process. The stages in this process are finance, marketing, management, investment, analysis.
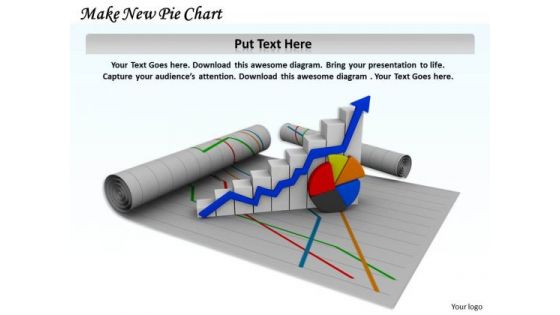
Stock Photo Make New Pie Chart PowerPoint Template
Be A Donor Of Great Ideas. Display Your Charity On Our Stock Photo Make New Pie Chart Powerpoint Template Powerpoint Templates. Make A Donation Of Your Ideas. Our Marketing Powerpoint Templates Will Convey Your Charitable Attitude.

3d Regular Implementation 7 Steps Flow Chart Template PowerPoint Slides
We present our 3d regular implementation 7 steps flow chart template PowerPoint Slides. Use our Business PowerPoint Templates because, The lessons have been analyzed, studied and conclusions drawn. Use our Arrows PowerPoint Templates because, Our Template designs are State of the Art. Use our Shapes PowerPoint Templates because; Highlight the key components of your entire manufacturing/ business process. Use our Abstract PowerPoint Templates because, Demonstrate to your audience how the best and most refined ideas pass through. Use our Process and Flows PowerPoint Templates because, to go for Gold and not just silver. Use these PowerPoint slides for presentations relating to analysis, art, blank, blue, business, categories, chart, chief, circle, clip, clipart, corporate, design, diagram, directors, element, executive, financial, graph, icon, illustration, implementation, isolated, managers, media, network, relations, role, sales, segments, set. The prominent colors used in the PowerPoint template are Blue, Gray, and Black Introduce changes with our 3d Regular Implementation 7 Steps Flow Chart Template PowerPoint Slides. Download without worries with our money back guaranteee.
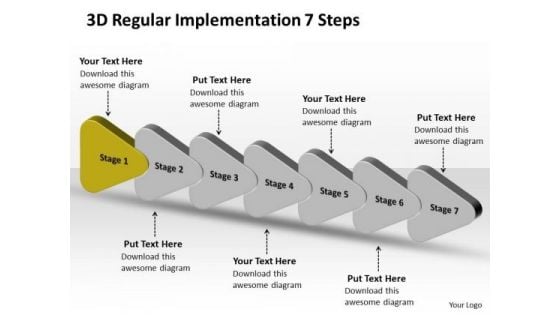
3d Regular Implementation 7 Steps Flow Chart PowerPoint Templates
We present our 3d regular implementation 7 steps flow chart PowerPoint templates. Use our Business PowerPoint Templates because, Emphasize on the relevance and importance of all milestones along the way. Use our Arrows PowerPoint Templates because, you have a great training programmer in mind to upgrade the skills of your staff. Use our Shapes PowerPoint Templates because; in any endeavor people matter most. Use our Abstract PowerPoint Templates because; Lay down the fundamentals to build upon. Use our Process and Flows PowerPoint Templates because, the vision of being the market leader is clear to you. Use these PowerPoint slides for presentations relating to analysis, art, blank, blue, business, categories, chart, chief, circle, clip, clipart, corporate, design, diagram, directors, element, executive, financial, graph, icon, illustration, implementation, isolated, managers, media, network, relations, role, sales, segments, set. The prominent colors used in the PowerPoint template are Green, Gray, and Black Reorganize your team with our 3d Regular Implementation 7 Steps Flow Chart PowerPoint Templates. Download without worries with our money back guaranteee.
Column Chart Marketing Ppt Powerpoint Presentation Icon Diagrams
This is a column chart marketing ppt powerpoint presentation icon diagrams. This is a three stage process. The stages in this process are finance, marketing, management, investment, analysis.
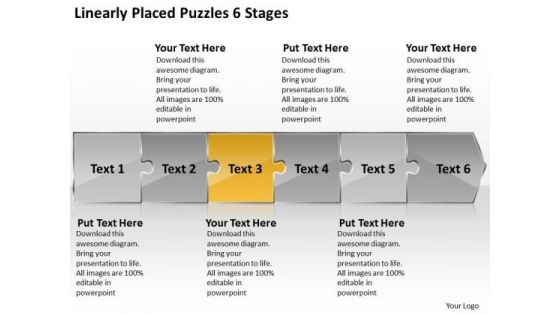
Linearly Placed Puzzles 6 Stages Flow Chart Template PowerPoint Slides
We present our linearly placed puzzles 6 stages flow chart template PowerPoint Slides.Use our Arrows PowerPoint Templates because,With the help of our Slides you can Illustrate how each element flows seamlessly onto the next stage. Use our Symbol PowerPoint Templates because,You can Determine your targets and sequence them as per your priorities. Use our Leadership PowerPoint Templates because,This diagram can be used to illustrate the logical path or system Use our Abstract PowerPoint Templates because, Activities which in themselves have many inherent business oppurtunities. Use our Business PowerPoint Templates because, Spell out your advertising plans to increase market share. The feedback has been positive and productiveUse these PowerPoint slides for presentations relating to Arrow, Background, Business, Chart, Diagram, Financial, Graphic, Gray, Icon, Illustration, Management, Orange, Perspective, Planning, Process, Stages, Steps, Text. The prominent colors used in the PowerPoint template are Yellow, Gray, White Summarize plans with our Linearly Placed Puzzles 6 Stages Flow Chart Template PowerPoint Slides. Download without worries with our money back guaranteee.
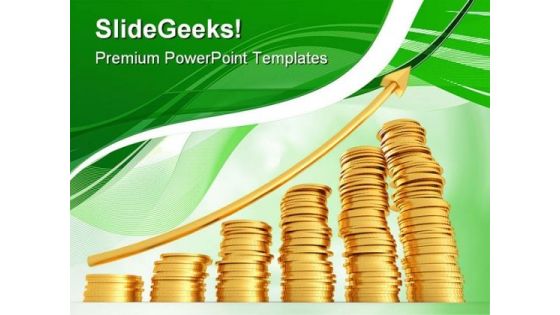
Money Chart Finance PowerPoint Templates And PowerPoint Backgrounds 0611
Microsoft PowerPoint Template and Background with financial diagram consisting of conceptual golden coins Get a firm handle on your discussion with our Money Chart Finance PowerPoint Templates And PowerPoint Backgrounds 0611. Try us out and see what a difference our templates make.
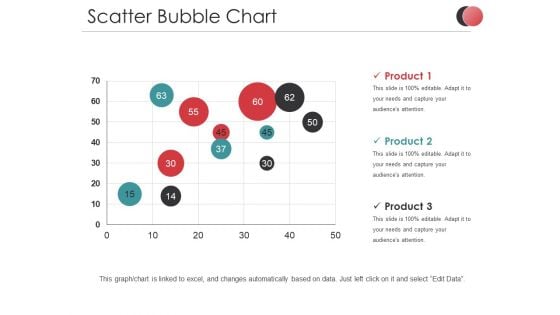
Scatter Bubble Chart Ppt PowerPoint Presentation Infographic Template Diagrams
This is a scatter bubble chart ppt powerpoint presentation infographic template diagrams. This is a three stage process. The stages in this process are product, business, marketing, finance.
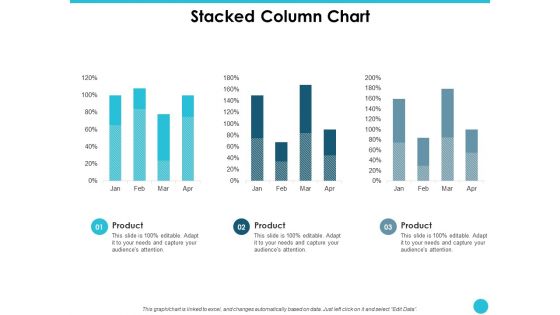
Stacked Column Chart Ppt PowerPoint Presentation Professional Diagrams
This is a stacked column chart ppt powerpoint presentation professional diagrams. This is a three stage process. The stages in this process are percentage, product, management, marketing.
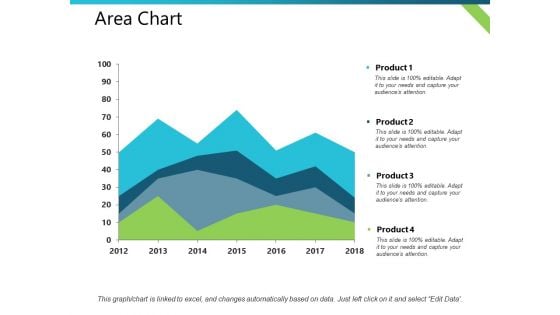
Area Chart Product Finance Ppt PowerPoint Presentation Guide
This is a area chart product finance ppt powerpoint presentation guide. This is a four stage process. The stages in this process are business, management, financial, marketing, sales.
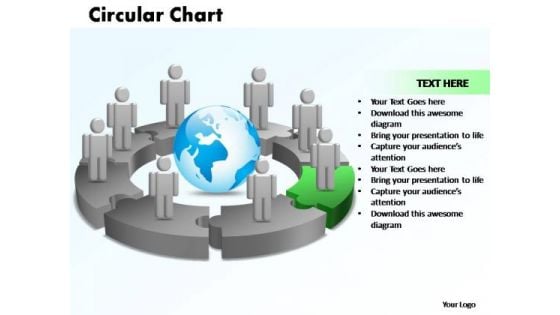
PowerPoint Designs Circular Chart With Globe Ppt Theme
PowerPoint Designs Circular Chart With Globe PPT Theme-The Circle of Life - a concept emmbedded in our minds and hence easy to comprehend. Life and Business is made up of processes comprising stages that flow from one to another. An excellent graphic to attract the attention of and understanding by your audience to improve earnings.-PowerPoint Designs Circular Chart With Globe PPT Theme Depend on no one with our PowerPoint Designs Circular Chart With Globe Ppt Theme. You will come out on top.
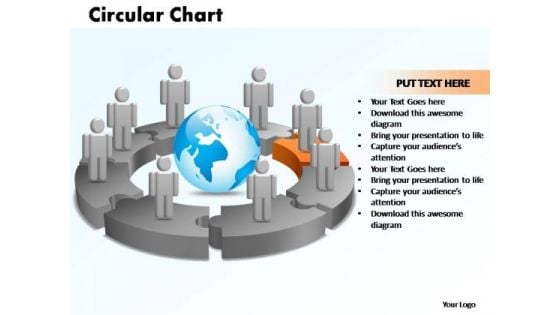
PowerPoint Designs Circular Chart With Globe Ppt Themes
PowerPoint Designs Circular Chart With Globe PPT Themes-The Circle of Life - a concept emmbedded in our minds and hence easy to comprehend. Life and Business is made up of processes comprising stages that flow from one to another. An excellent graphic to attract the attention of and understanding by your audience to improve earnings.-PowerPoint Designs Circular Chart With Globe PPT Themes Enthral your listeners with your suggestions. Keep them clued in with our PowerPoint Designs Circular Chart With Globe Ppt Themes.
Scatter Chart Ppt PowerPoint Presentation Icon Background Images
This is a scatter chart ppt powerpoint presentation icon background images. This is a one stage process. The stages in this process are percentage, product, business, marketing, management.
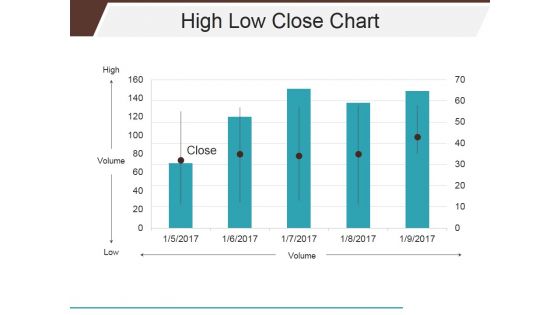
High Low Close Chart Ppt PowerPoint Presentation Infographics Shapes
This is a high low close chart ppt powerpoint presentation infographics shapes. This is a five stage process. The stages in this process are close, volume, high, low.
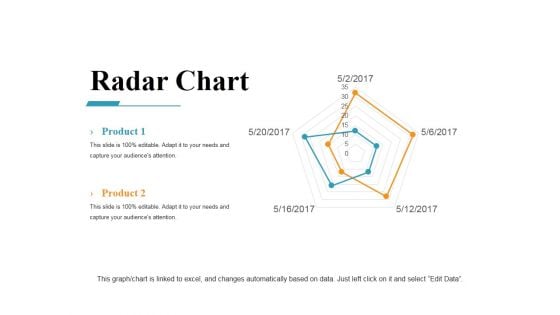
Radar Chart Ppt PowerPoint Presentation Ideas Master Slide
This is a radar chart ppt powerpoint presentation ideas master slide. This is a five stage process. The stages in this process are radar, business, marketing, strategy, finance.
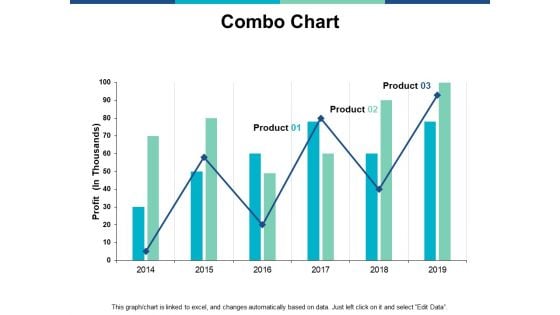
Combo Chart Graph Ppt PowerPoint Presentation Infographics Guide
This is a combo chart graph ppt powerpoint presentation infographics guide. This is a two stage process. The stages in this process are marketing, business, management, planning, strategy.
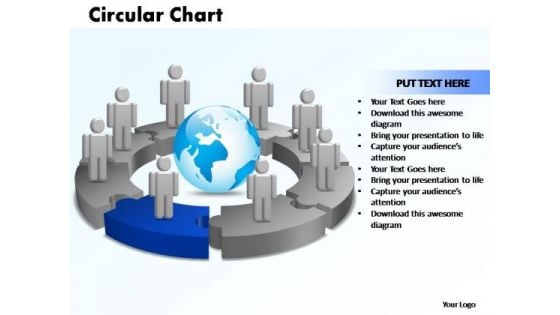
PowerPoint Designs Circular Chart With Globe Ppt Design
PowerPoint Designs Circular Chart With Globe PPT Design-The Circle of Life - a concept emmbedded in our minds and hence easy to comprehend. Life and Business is made up of processes comprising stages that flow from one to another. An excellent graphic to attract the attention of and understanding by your audience to improve earnings.-PowerPoint Designs Circular Chart With Globe PPT Design List your core competencies with our PowerPoint Designs Circular Chart With Globe Ppt Design. They will make you look good.
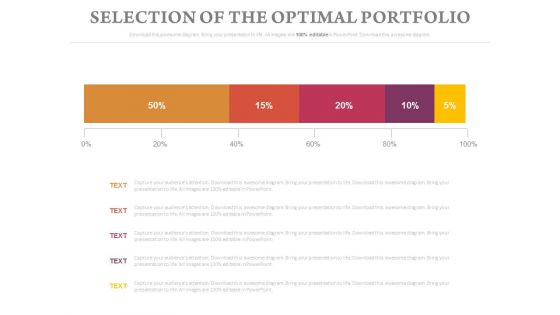
Selection Of The Optimal Portfolio Chart Ppt Slides
This is a selection of the optimal portfolio chart ppt slides. This is a five stage process. The stages in this process are business, finance, marketing.
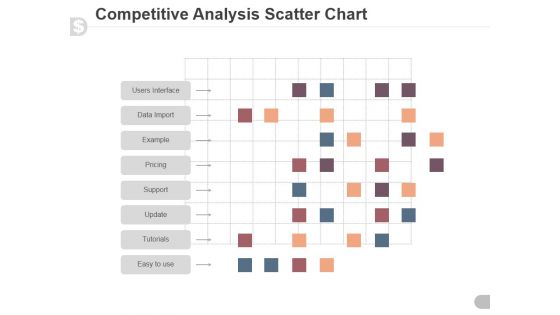
Competitive Analysis Scatter Chart Ppt PowerPoint Presentation Samples
This is a competitive analysis scatter chart ppt powerpoint presentation samples. This is a six stage process. The stages in this process are competitive, analysis, business, marketing, management.


 Continue with Email

 Home
Home


