Revenue Chart
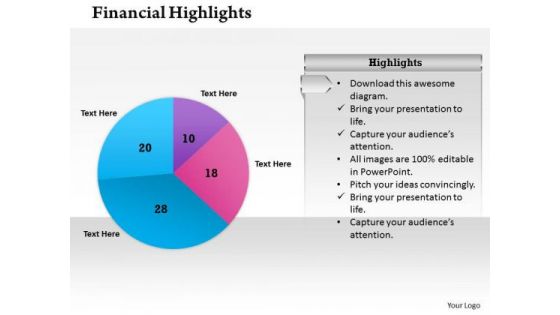
Sales Diagram Pie Chart For Financial Result Business Diagram
Knock On The Door To Success With Our Sales Diagram Pie Chart For Financial Result Business Diagram Powerpoint Templates. Be Assured Of Gaining Entry. Give Them A Dose Of Your Ability. It Will Go Down Well With Our Sales Diagram Pie Chart For Financial Result Business Diagram Powerpoint Templates.
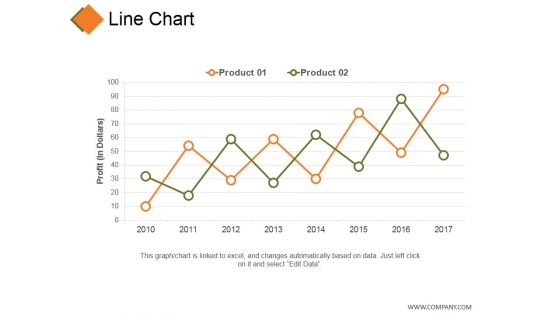
Line Chart Ppt PowerPoint Presentation Visual Aids Inspiration
This is a line chart ppt powerpoint presentation visual aids inspiration. This is a two stage process. The stages in this process are product, profit, growth, decline, success.
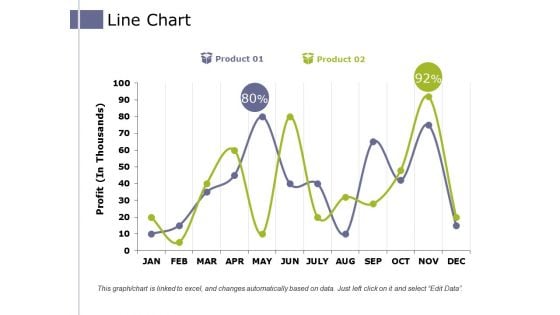
Line Chart Ppt PowerPoint Presentation Pictures Example Introduction
This is a line chart ppt powerpoint presentation pictures example introduction. This is a two stage process. The stages in this process are product, profit, business, growth, success.
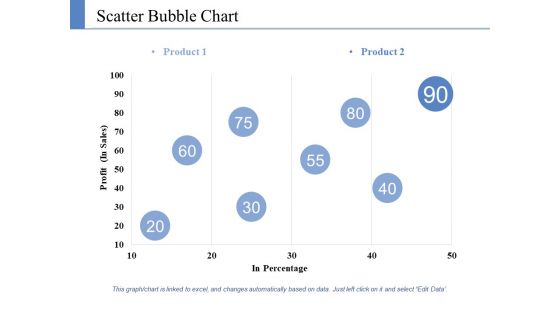
Scatter Bubble Chart Ppt PowerPoint Presentation Styles Information
This is a scatter bubble chart ppt powerpoint presentation styles information. This is a two stage process. The stages in this process are product, profit, in percentage.
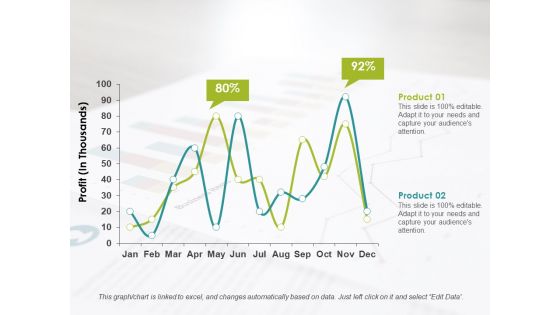
Line Chart Ppt PowerPoint Presentation Infographics Format Ideas
This is a line chart ppt powerpoint presentation infographics format ideas. This is a two stage process. The stages in this process are product, profit, business.
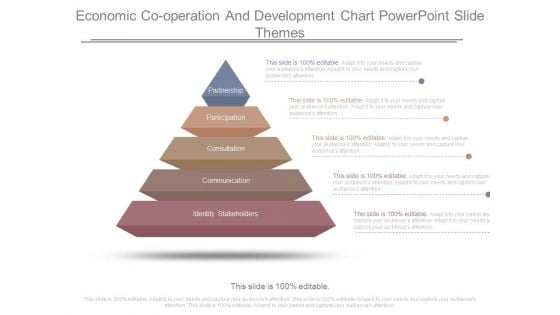
Economic Cooperation And Development Chart Powerpoint Slide Themes
This is a economic cooperation and development chart powerpoint slide themes. This is a five stage process. The stages in this process are partnership, participation, consultation, communication, identify, stakeholders.
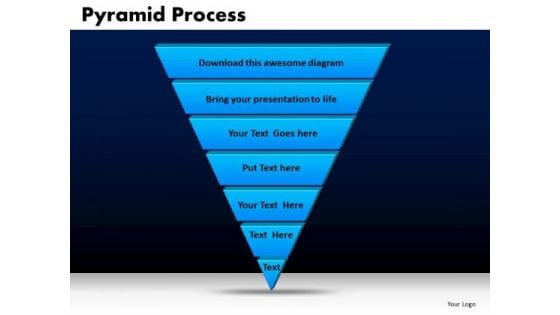
Business Triangles PowerPoint Templates Chart Pyramid Process Ppt Slides
Business Triangles PowerPoint Templates Chart Pyramid Process PPT Slides-A Pyramid Diagram may be defined as representation of data in the form of a triangle separated by horizontal lines. The widest section may contain the general topic while the narrowest section may contain a much more specific topic. -Business Triangles PowerPoint Templates Chart Pyramid Process PPT Slides-This template can be used for presentations relating to 3d, Bar, Business, Chart, Class, Conceptual, Corner, FInance, Graph, Graphic, Hierarchy, Investment, Layer, Level, Performance, Planner, Priority, Progress, Pyramid, Render, Status, Strategy, System, Triangle Earn the credits you do deserve. Answer the critics with our Business Triangles PowerPoint Templates Chart Pyramid Process Ppt Slides.
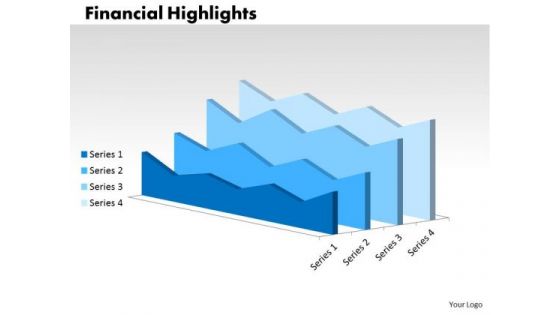
Strategy Diagram Growth Analysis Chart Diagram Consulting Diagram
Double Up Our Strategy Diagram Growth Analysis Chart Diagram Consulting Diagram Powerpoint Templates With Your Thoughts. They Will Make An Awesome Pair. When In Doubt Use Our Strategy Diagram Growth Analysis Chart Diagram Consulting Diagram Powerpoint Templates. The Way Ahead Will Become Crystal Clear.
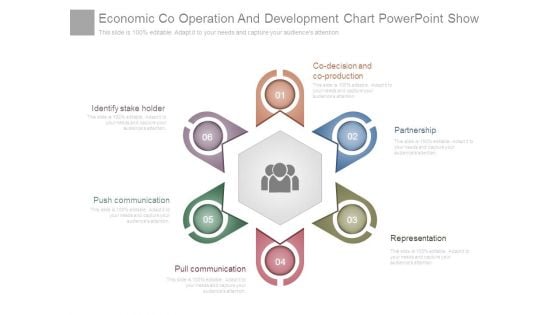
Economic Co Operation And Development Chart Powerpoint Show
This is a economic co operation and development chart powerpoint show. This is a six stage process. The stages in this process are co decision and co production, partnership, representation, pull communication, push communication, identify stake holder.
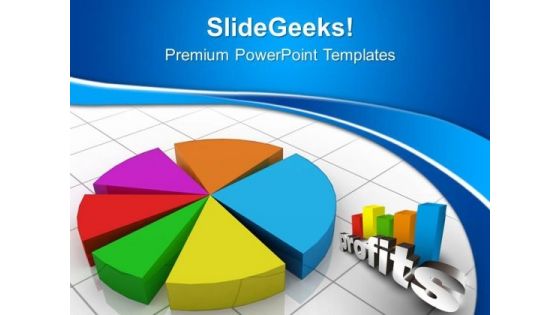
Pie Chart Marketing Business PowerPoint Templates And PowerPoint Themes 0612
Pie Chart Marketing Business PowerPoint Templates And PowerPoint Themes Business PPT Templates-Pie graph marketing, business, finance, sales, success, marketing Succeed admirably with our Pie Chart Marketing Business PowerPoint Templates And PowerPoint Themes 0612. Download without worries with our money back guaranteee.
Bar Chart Icon For Financial Ratios Comparison Elements PDF
Presenting bar chart icon for financial ratios comparison elements pdf to dispense important information. This template comprises four stages. It also presents valuable insights into the topics including bar chart icon for financial ratios comparison. This is a completely customizable PowerPoint theme that can be put to use immediately. So, download it and address the topic impactfully.
Financial Arrows Chart Business PowerPoint Backgrounds And Templates 1210
Microsoft PowerPoint Template and Background with fine image 3d of financial business graph Decrease wastage with our Financial Arrows Chart Business PowerPoint Backgrounds And Templates 1210. Download without worries with our money back guaranteee.
Chart Comparison Icon For Financial Ratios Template PDF
Persuade your audience using this chart comparison icon for financial ratios template pdf. This PPT design covers three stages, thus making it a great tool to use. It also caters to a variety of topics including chart comparison icon for financial ratios. Download this PPT design now to present a convincing pitch that not only emphasizes the topic but also showcases your presentation skills.
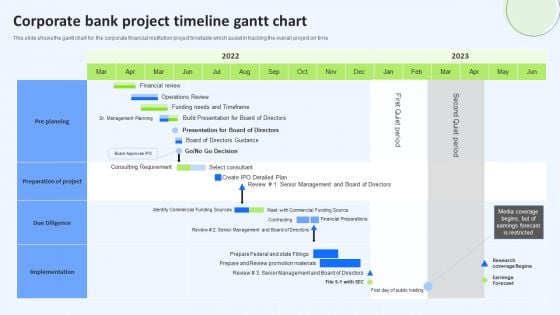
Corporate Bank Project Timeline Gantt Chart Infographics PDF
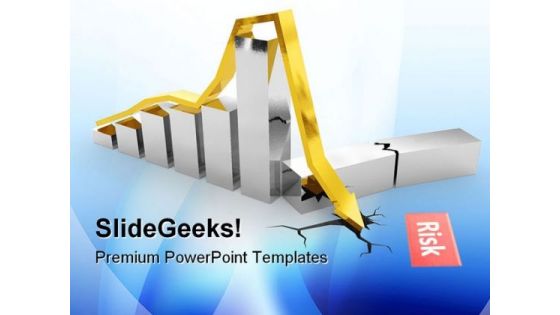
Financial Crisis Chart Business PowerPoint Templates And PowerPoint Backgrounds 0811
Microsoft PowerPoint Template and Background with steel crisis chart with golden arrow dropped into crack Give a fillip to your plans with our Financial Crisis Chart Business PowerPoint Templates And PowerPoint Backgrounds 0811. They will get that extra attention you seek.
Ppt Linear Flow Business PowerPoint Theme Process Management Chart Templates
PPT linear flow business powerpoint theme process management chart Templates-Use this disarms to have a general understanding of representing an information system process. This diagram will enhance the essence of your viable ideas-PPT linear flow business powerpoint theme process management chart Templates-3d, Arrow, Background, Banner, Business, Chart, Colorful, Diagram, Direction, Element, Financial, Flow, Gradient, Illustration, Isolated, Mirrored, Placeholder, Presentation, Process, Steps Give a fillip to your plans with our Ppt Linear Flow Business PowerPoint Theme Process Management Chart Templates. They will get that extra attention you seek.

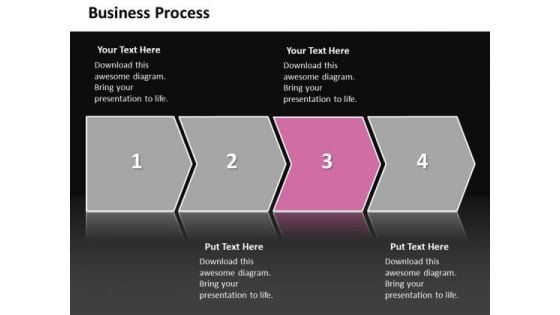
Ppt Consecutive Work Flow Chart PowerPoint Business Communication Diagram Templates
PPT consecutive work flow chart powerpoint business communication diagram Templates-Visually support your Microsoft office PPT Presentation with our above Diagram illustrating first stage using green arrow piece. This way, you can use the idea of a jigsaw quickly and easily in your presentation. Use this Diagram to illustrate your method, piece by piece, and interlock the whole process in the minds of your audience.-PPT consecutive work flow chart powerpoint business communication diagram Templates-3d, Arrow, Background, Banner, Business, Chart, Colorful, Diagram, Direction, Element, Financial, Flow, Gradient, Illustration, Isolated, Mirrored, Placeholder, Presentation, Process, Steps Our Ppt Consecutive Work Flow Chart PowerPoint Business Communication Diagram Templates afford you different approaches. Cope with constantly changing demands.
Compensation Statement Icon In Incentive Programs Chart Brochure PDF
Presenting Compensation Statement Icon In Incentive Programs Chart Brochure PDF to dispense important information. This template comprises three stages. It also presents valuable insights into the topics including Compensation Statement Icon, Incentive Programs Chart. This is a completely customizable PowerPoint theme that can be put to use immediately. So, download it and address the topic impactfully.
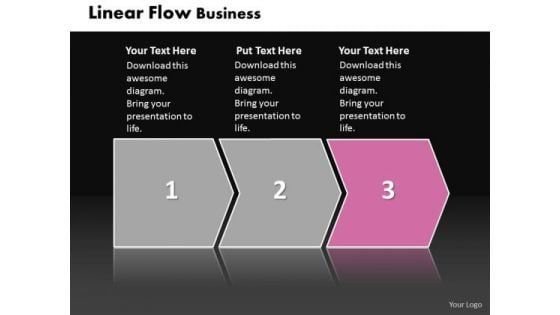
Ppt Linear Flow Business PowerPoint Presentation Communication Chart Templates
PPT linear flow business powerpoint presentation communication chart Templates-This Linear Flow diagram can be used to provide a clear representation of any business function. Highlight the depth of your thoughts with our attractive PPT design-PPT linear flow business powerpoint presentation communication chart Templates-3d, Arrow, Background, Banner, Business, Chart, Colorful, Diagram, Direction, Element, Financial, Flow, Gradient, Illustration, Isolated, Mirrored, Placeholder, Presentation, Process, Steps We guarantee a top notch presentationwith our Ppt Linear Flow Business PowerPoint Presentation Communication Chart Templates. You'll deliver your best presentation yet.

Consulting Diagram Process Chart 12 Stages Strategy Diagram
Get The Doers Into Action. Activate Them With Our Consulting Diagram Process Chart 12 Stages Strategy Diagram Powerpoint Templates. Put Your Money On Our Consulting Diagram Process Chart 12 Stages Strategy Diagram Powerpoint Templates. Your Ideas Will Rake In The Dollars.
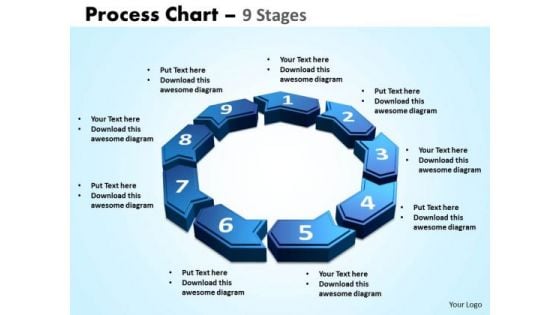
Business Framework Model Process Chart 9 Stages Business Diagram
Get The Doers Into Action. Activate Them With Our Business Framework Model Process Chart 9 Stages Business Diagram Powerpoint Templates. Put Your Money On Our Business Framework Model Process Chart 9 Stages Business Diagram Powerpoint Templates. Your Ideas Will Rake In The Dollars.
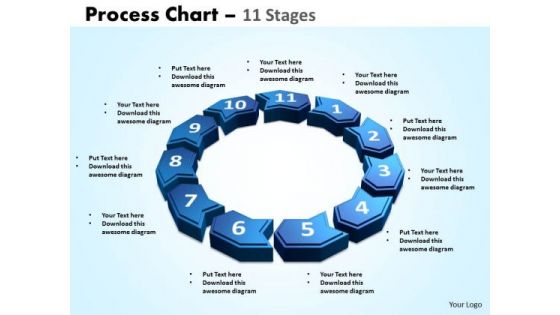
Strategic Management Process Chart 11 Stages Consulting Diagram
Get The Doers Into Action. Activate Them With Our Strategic Management Process Chart 11 Stages Consulting Diagram Powerpoint Templates. Put Your Money On Our Strategic Management Process Chart 11 Stages Consulting Diagram Powerpoint Templates. Your Ideas Will Rake In The Dollars.
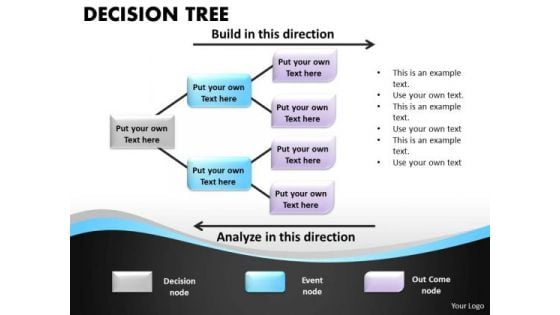
Business Cycle Diagram Decision Tree Process Chart Strategic Management
Get The Doers Into Action. Activate Them With Our Business Cycle Diagram Decision Tree Process Chart Strategic Management Powerpoint Templates. Put Your Money On Our Business Cycle Diagram Decision Tree Process Chart Strategic Management Powerpoint Templates. Your Ideas Will Rake In The Dollars.
Price Catalogue Chart Icon Of Product Comparison Slides PDF
Presenting price catalogue chart icon of product comparison slides pdf to dispense important information. This template comprises three stages. It also presents valuable insights into the topics including price catalogue chart icon of product comparison. This is a completely customizable PowerPoint theme that can be put to use immediately. So, download it and address the topic impactfully.
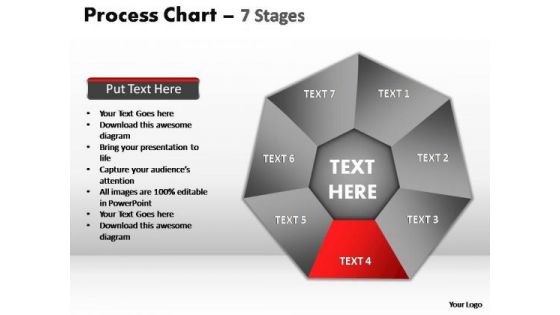
PowerPoint Slide Designs Teamwork Process Chart Ppt Backgrounds
PowerPoint Slide Designs Teamwork process chart PPT Backgrounds-These Fabulous PowerPoint slides and PowerPoint templates have been delicately designed by our professional team to leave long-lasting impressions on your audiences Perfect your presentations with our PowerPoint Slide Designs Teamwork Process Chart Ppt Backgrounds. Download without worries with our money back guaranteee.
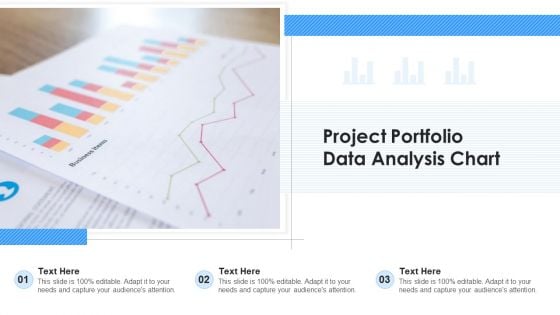
Project Portfolio Data Analysis Chart Ppt Ideas Gallery PDF
Presenting project portfolio data analysis chart ppt ideas gallery pdf to dispense important information. This template comprises three stages. It also presents valuable insights into the topics including project portfolio data analysis chart. This is a completely customizable PowerPoint theme that can be put to use immediately. So, download it and address the topic impactfully.
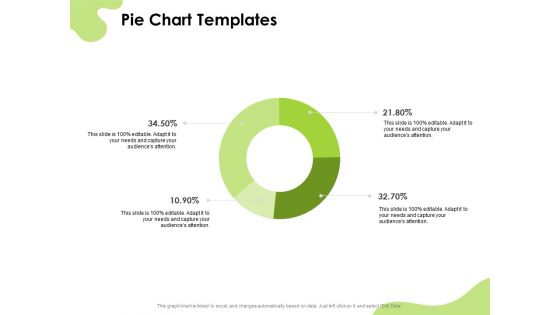
Reach Your Target Audience Pie Chart Ppt Show Model PDF
This is a reach your target audience pie chart ppt show model pdf template with various stages. Focus and dispense information on four stages using this creative set, that comes with editable features. It contains large content boxes to add your information on topics like pie chart. You can also showcase facts, figures, and other relevant content using this PPT layout. Grab it now.
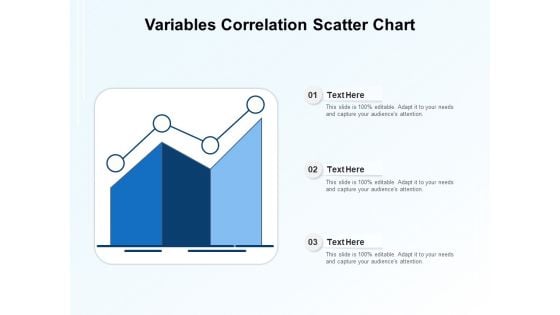
Variables Correlation Scatter Chart Ppt PowerPoint Presentation Model Smartart PDF
Presenting variables correlation scatter chart ppt powerpoint presentation model smartart pdf to dispense important information. This template comprises three stages. It also presents valuable insights into the topics including variables correlation scatter chart. This is a completely customizable PowerPoint theme that can be put to use immediately. So, download it and address the topic impactfully.
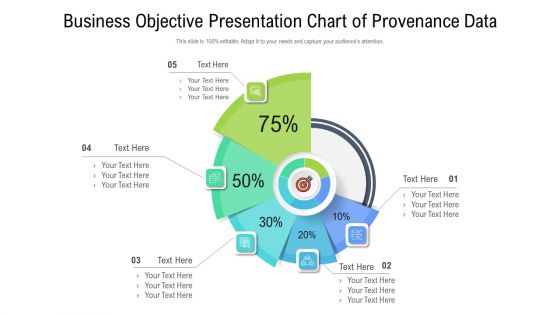
Business Objective Presentation Chart Of Provenance Data Download PDF
Presenting business objective presentation chart of provenance data download pdf to dispense important information. This template comprises five stages. It also presents valuable insights into the topics including business objective presentation chart of provenance data. This is a completely customizable PowerPoint theme that can be put to use immediately. So, download it and address the topic impactfully.

Statistical Data Analysis Chart Of Collected Data Formats PDF
Presenting statistical data analysis chart of collected data formats pdf to dispense important information. This template comprises four stages. It also presents valuable insights into the topics including statistical data analysis chart of collected data. This is a completely customizable PowerPoint theme that can be put to use immediately. So, download it and address the topic impactfully.
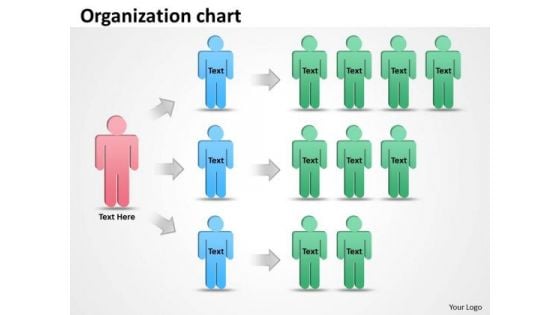
Business Finance Strategy Development Organization Staff Chart Business Cycle Diagram
Your Grasp Of Economics Is Well Known. Help Your Audience Comprehend Issues With Our Business Finance Strategy Development Organization staff chart Business Cycle Diagram Powerpoint Templates. Strike A Bargain With Our Business Finance Strategy Development Organization staff chart Business Cycle Diagram Powerpoint Templates. Your Thoughts Will Get A Winning Deal.

Profit Bar Chart Business PowerPoint Backgrounds And Templates 1210
Microsoft PowerPoint Template and Background with Business success bar graph rendered in 3D Our Profit Bar Chart Business PowerPoint Backgrounds And Templates 1210 are clearly eye catching. One look and you will not want to even blink.
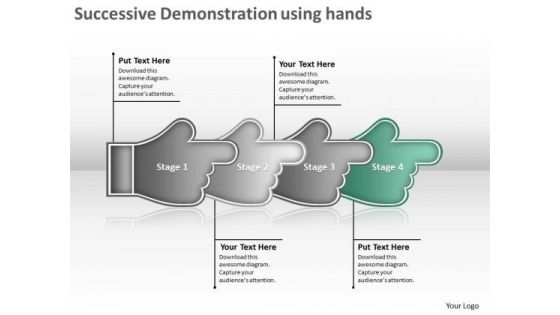
Successive Demonstration Using Hands Flow Chart Creator PowerPoint Templates
We present our successive demonstration using hands flow chart creator PowerPoint templates. Use our Symbol PowerPoint Templates because, are the tools that helped most of us evolve. Use our Business PowerPoint Templates because, Marketing Strategy Business Template:- Maximizing sales of your product is the intended destination. Use our Metaphor PowerPoint Templates because, Profit fairly earned is what you believe in. Use our Abstract PowerPoint Templates because, Forward thinking is the way to go. Use our Process and Flows PowerPoint Templates because, Original thinking is the need of the hour. Use these PowerPoint slides for presentations relating to Description using hands steps, Business, Collection, Connection, Cursor, Decoration, Design, Dimensional, Direction, Element, Icon, Illustration, Information, Modern, Motion, Paper, Perspective, Plastic, Pointer, Pointing, Process, Recycle, Recycling, Reflective, Set, Shape, Shiny, Sign, Symbol, Technology. The prominent colors used in the PowerPoint template are Green, Gray, and Black Drive your organization with our Successive Demonstration Using Hands Flow Chart Creator PowerPoint Templates. Download without worries with our money back guaranteee.
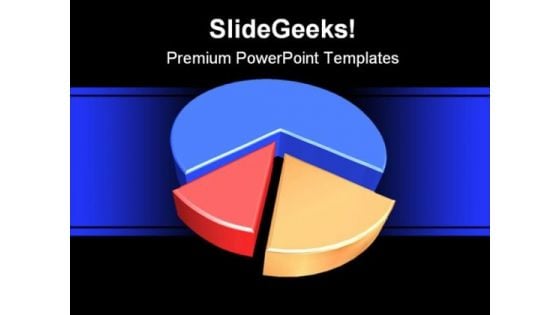
Pie Chart Business PowerPoint Themes And PowerPoint Slides 0411
Microsoft PowerPoint Theme and Slide with rendering of pie graph on white Slide Measure your team's success with our Pie Chart Business PowerPoint Themes And PowerPoint Slides 0411. You will be at the top of your game.
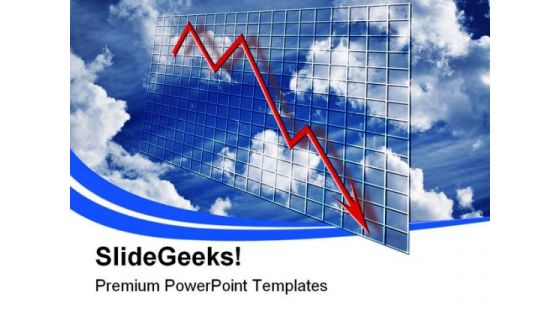
Crisis Chart Business PowerPoint Templates And PowerPoint Backgrounds 0811
Microsoft PowerPoint Template and Background with graph declining over time concept financial decline or credit crisis crunch over grid and clouds with cloudy sky Failsafe systems are difficult to design. Get to the bottom of it with our Crisis Chart Business PowerPoint Templates And PowerPoint Backgrounds 0811.
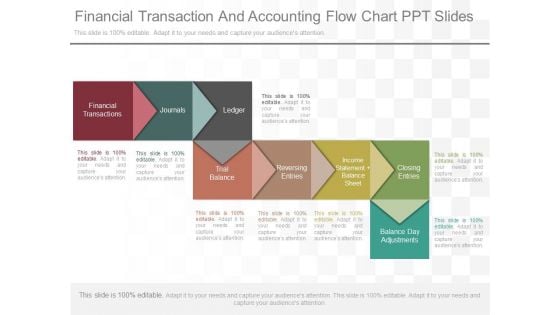
Financial Transaction And Accounting Flow Chart Ppt Slides
This is a financial transaction and accounting flow chart ppt slides. This is a eight stage process. The stages in this process are financial transactions, journals, ledger, trial balance, reversing entries, income statement balance sheet, closing entries, balance day adjustments.
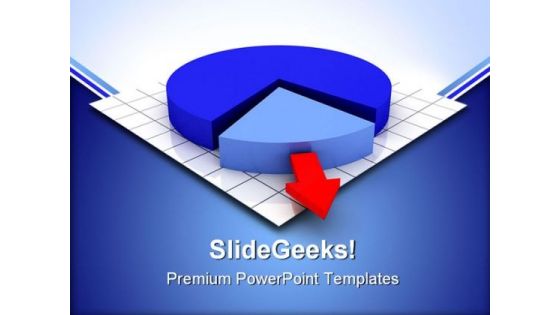
Pie Chart Business PowerPoint Themes And PowerPoint Slides 0511
Microsoft PowerPoint Slide and Theme with a pie chart with one segment being removed Our Pie Chart Business PowerPoint Themes And PowerPoint Slides 0511 save time creating a mind blowing presentation. With our money back guarantee you have nothing to lose.
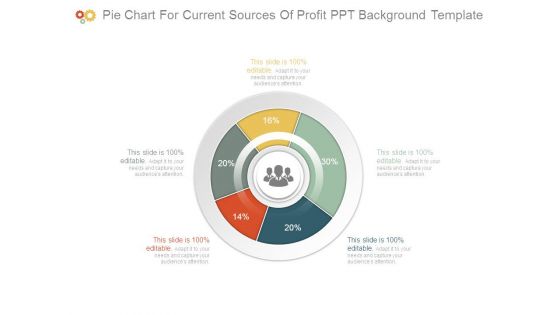
Pie Chart For Current Sources Of Profit Ppt Background Template
This is a pie chart for current sources of profit ppt background template. This is a five stage process. The stages in this process are finance, success, business, marketing, percentage, donut.
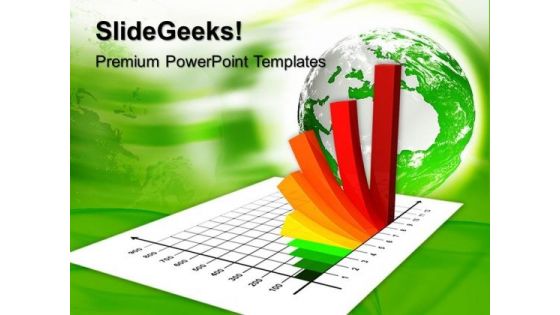
Growth Chart Business PowerPoint Templates And PowerPoint Themes 1012
Growth Chart Business PowerPoint Templates And PowerPoint Themes 1012-The above template displays a diagram of a colorful business chart outgoing. This image has been professionally designed to emphasize business concept. It signifies chart, finance, future, growth, profit, progress, statistics and success. Adjust the above image in your PPT presentations to visually support your content in your Marketing and Financial PPT slideshows. Our PPT images are so ideally designed that it reveals the very basis of our PPT template are an effective tool to make your clients understand.-Growth Chart Business PowerPoint Templates And PowerPoint Themes 1012-This PowerPoint template can be used for presentations relating to-Business growth and success graph, finance, business, success, competition, arrows Our Growth Chart Business PowerPoint Templates And PowerPoint Themes 1012 will get you all animated. You will become eager to assert your views.
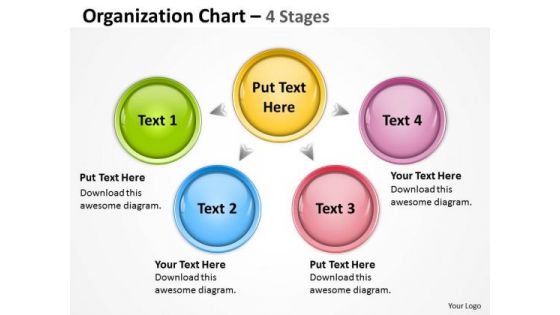
Business Finance Strategy Development Organization Chart Mba Models And Frameworks
Rake In The Dough With Your Ideas. Profits Will Rise With Our Business Finance Strategy Development Organization Chart MBA models and frameworks Powerpoint Templates. Dowse The Flames With Our Business Finance Strategy Development Organization Chart MBA models and frameworks Powerpoint Templates. Put Out The Fire Before It Starts.
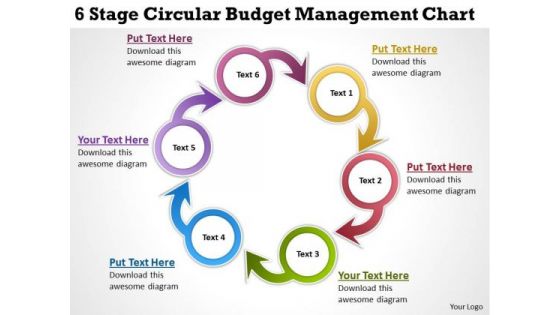
Business Diagram Templates 6 Stage Circular Budget Management Chart PowerPoint
We present our business diagram templates 6 stage circular budget management chart PowerPoint.Use our Circle Charts PowerPoint Templates because Our PowerPoint Templates and Slides will Activate the energies of your audience. Get their creative juices flowing with your words. Download and present our Business PowerPoint Templates because Our PowerPoint Templates and Slides will Activate the energies of your audience. Get their creative juices flowing with your words. Present our Shapes PowerPoint Templates because you should Whip up a frenzy with our PowerPoint Templates and Slides. They will fuel the excitement of your team. Use our Process and Flows PowerPoint Templates because You are an avid believer in ethical practices. Highlight the benefits that accrue with our PowerPoint Templates and Slides. Use our Arrows PowerPoint Templates because Our PowerPoint Templates and Slides will definately Enhance the stature of your presentation. Adorn the beauty of your thoughts with their colourful backgrounds.Use these PowerPoint slides for presentations relating to Arrow, Blue, Business, Chart, Circle, Complex, Concept, Data, Diagram, Financial, Graph, Graphic, Green, Icon, Illustration, Isolated, Model, Pink, Process, Purple, Red, Round, Set, Shape, Vector, Wheel, White, Yellow. The prominent colors used in the PowerPoint template are Yellow, Red, Blue. Engage our Business Diagram Templates 6 Stage Circular Budget Management Chart PowerPoint and experience the difference. Get accustomed to consistent brilliance.
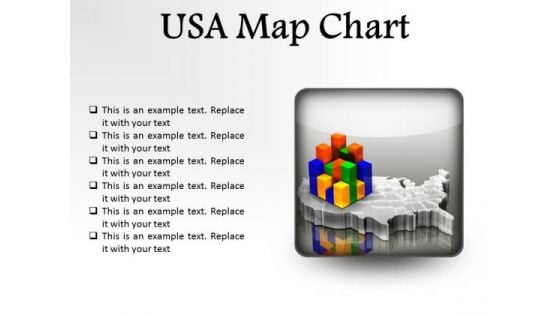
Usa Map Chart Americana PowerPoint Presentation Slides S
Microsoft PowerPoint Slides and Backgrounds with of a multicolored bar chart sitting on top of a transparent extruded map of the united states on a medium gray reflective surface Reposition yourself with our Usa Map Chart Americana PowerPoint Presentation Slides S. Download without worries with our money back guaranteee.
Business Profit Growth Chart Vector Icon Ppt File Brochure PDF
Persuade your audience using this business profit growth chart vector icon ppt file brochure pdf. This PPT design covers three stages, thus making it a great tool to use. It also caters to a variety of topics including business profit growth chart vector icon. Download this PPT design now to present a convincing pitch that not only emphasizes the topic but also showcases your presentation skills.
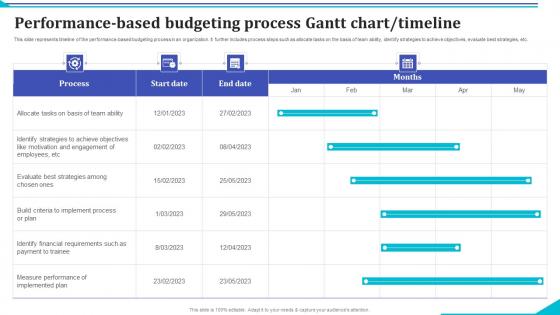
Performance Based Budgeting Process Gantt Chart Timeline Rules Pdf
This slide represents timeline of the performance based budgeting process in an organization. It further includes process steps such as allocate tasks on the basis of team ability, identify strategies to achieve objectives, evaluate best strategies, etc.Showcasing this set of slides titled Performance Based Budgeting Process Gantt Chart Timeline Rules Pdf The topics addressed in these templates are Build Criteria, Implement Process, Identify Financial Requirements, Payment Trainee All the content presented in this PPT design is completely editable. Download it and make adjustments in color, background, font etc. as per your unique business setting. This slide represents timeline of the performance based budgeting process in an organization. It further includes process steps such as allocate tasks on the basis of team ability, identify strategies to achieve objectives, evaluate best strategies, etc.
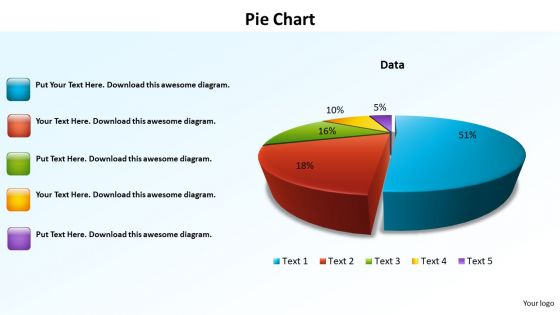
PowerPoint Templates Data Driven Pie Chart Ppt Themes
PowerPoint Templates Data Driven Pie Chart PPT Themes-The Circle of Life - a concept emmbedded in our minds and hence easy to comprehend. Life and Business is made up of processes comprising stages that flow from one to another. An excellent graphic to attract the attention of and understanding by your audience to improve earnings. Document growth with our PowerPoint Templates Data Driven Pie Chart Ppt Themes. Download without worries with our money back guaranteee.
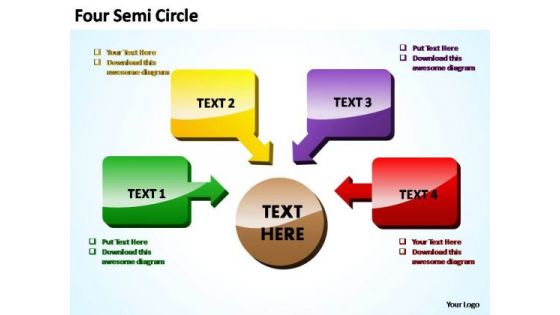
PowerPoint Templates Chart Four Steps To Meet Target Ppt Slide
PowerPoint Templates Chart Four steps to meet Target PPT Slide-The Circle of Life - a concept emmbedded in our minds and hence easy to comprehend. Life and Business is made up of processes comprising stages that flow from one to another. An excellent graphic to attract the attention of and understanding by your audience to improve earnings. Consult experts with our PowerPoint Templates Chart Four Steps To Meet Target Ppt Slide. Download without worries with our money back guaranteee.
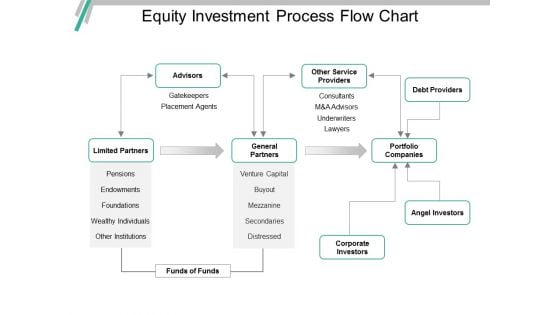
Equity Investment Process Flow Chart Ppt PowerPoint Presentation Ideas
This is a equity investment process flow chart ppt powerpoint presentation ideas. This is a three stage process. The stages in this process are investment, funding, private equity, venture capital.
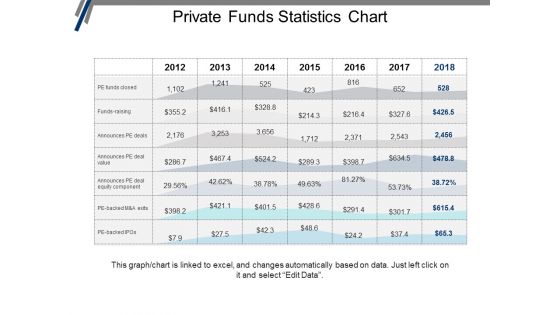
Private Funds Statistics Chart Ppt PowerPoint Presentation Portfolio Graphics Design
This is a private funds statistics chart ppt powerpoint presentation portfolio graphics design. This is a seven stage process. The stages in this process are investment, funding, private equity, venture capital.

Business Chart Success PowerPoint Templates And PowerPoint Backgrounds 0211
Microsoft PowerPoint Template and Background with growing gold graph with a red arrow pointing upward Advise teams with our Business Chart Success PowerPoint Templates And PowerPoint Backgrounds 0211. Download without worries with our money back guaranteee.
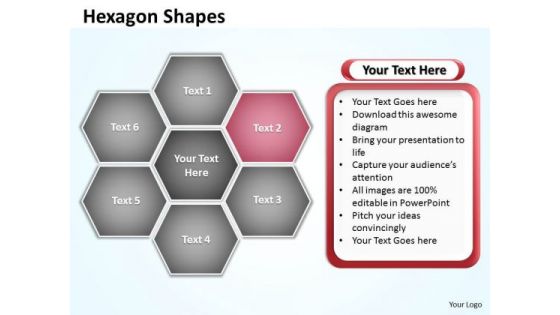
Ppt Hexagon Angles Shaped Chart Editable PowerPoint Templates 2007
PPT hexagon angles shaped chart editable powerpoint templates 2007-Use this Hexagon diagram to explain complex and difficult business strategic planning & staff development. This is an amazing tool to ensure that strategic planning sessions contribute to teambuilding, and are interesting too.-PPT hexagon angles shaped chart editable powerpoint templates 2007-Abstract, Background, Design, Digital, Elements, Graphic, Grey, Hexagon, Illustration, Light, Modern, Perspective, Triangles, Shapes, Shiny, Style, Technology, Template, Vector, Vertical, Virtual, Wallpaper, Web Our Ppt Hexagon Angles Shaped Chart Editable PowerPoint Templates 2007 impress people. With our money back guarantee you have nothing to lose.
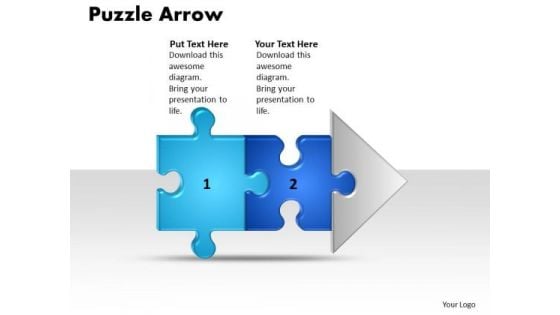
Ppt Linear Work Flow Chart PowerPoint 2 Stages Style1 Templates
PPT linear work flow chart powerpoint 2 stages style1 Templates-This PowerPoint puzzle diagram template is used to show interrelated ideas or concepts. This diagram is useful in just about any type of presentation-PPT linear work flow chart powerpoint 2 stages style1 Templates-Amusement, Arrow, Board, Cardboard, Children, Deficient, Direction, Diversion, Entertainment, Game, Illustration, Image, Jigsaw, Logo, Lots, Many, Paper, Perspective, Pieces, Play, Puzzle, Vector Design goals with our Ppt Linear Work Flow Chart PowerPoint 2 Stages Style1 Templates. Download without worries with our money back guaranteee.
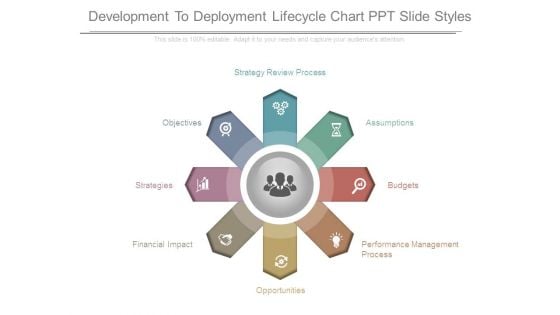
Development To Deployment Lifecycle Chart Ppt Slide Styles
This is a development to deployment lifecycle chart ppt slide styles. This is a eight stage process. The stages in this process are performance management process, opportunities, financial impact, strategies, objectives, strategy review process, assumptions, budgets.
Mountain Chart With Social Media Icons Powerpoint Slides
The above PPT template displays mountain chart with social media icons. This PowerPoint template has been designed to exhibit users of social media. Download this PPT slide to attract the attention of your audience.
Scatter Bubble Chart Ppt PowerPoint Presentation Icon Elements
This is a scatter bubble chart ppt powerpoint presentation icon elements. This is a six stage process. The stages in this process are highest profit, profit, financial year, product.
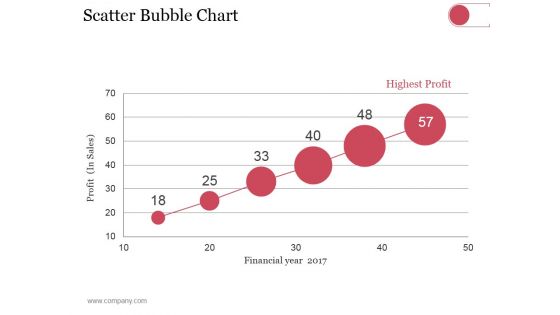
Scatter Bubble Chart Ppt PowerPoint Presentation Summary Pictures
This is a scatter bubble chart ppt powerpoint presentation summary pictures. This is a six stage process. The stages in this process are highest profit, financial year, profit in sales.

Scatter Bubble Chart Ppt PowerPoint Presentation Professional Graphics Pictures
This is a scatter bubble chart ppt powerpoint presentation professional graphics pictures. This is a one stage process. The stages in this process are profit in sales, financial year, highest profit, product.
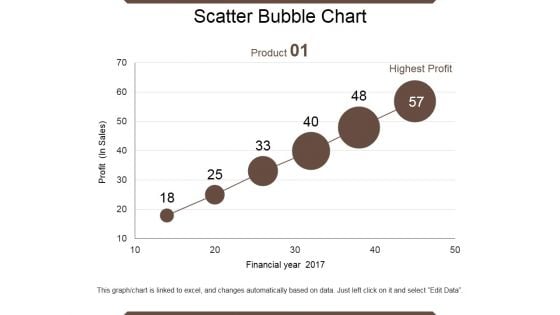
Scatter Bubble Chart Ppt PowerPoint Presentation Summary Files
This is a scatter bubble chart ppt powerpoint presentation summary files. This is a six stage process. The stages in this process are product, financial year, profit, highest profit.
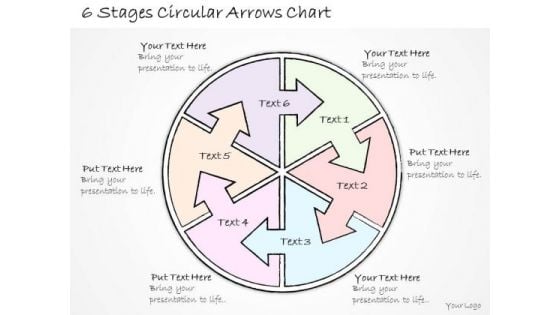
Ppt Slide 6 Stages Circular Arrows Chart Marketing Plan
Get The Doers Into Action. Activate Them With Our PPT Slide 6 Stages Circular Arrows Chart Marketing Plan Powerpoint Templates. Put Your Money On Our Business Plan Powerpoint Templates. Your Ideas Will Rake In The Dollars.
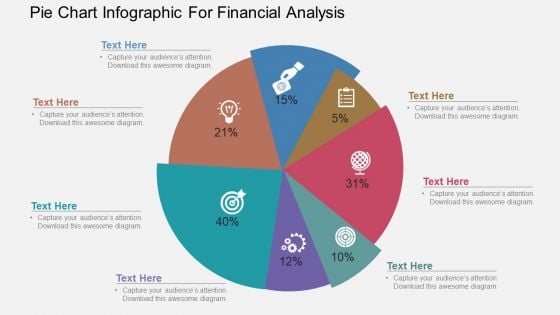
Pie Chart Infographic For Financial Analysis Powerpoint Template
Our above PowerPoint template has been designed with pie chart infographic. This slide is suitable to present financial analysis. Use this business diagram to present your work in a more smart and precise manner.
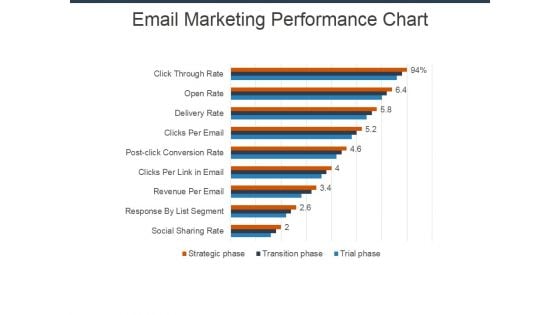
Email Marketing Performance Chart Ppt Powerpoint Presentation Pictures Show
This is a email marketing performance chart ppt powerpoint presentation pictures show. This is a nine stage process. The stages in this process are finance, planning, marketing, business, management, strategy.


 Continue with Email

 Home
Home


