Revenue Chart
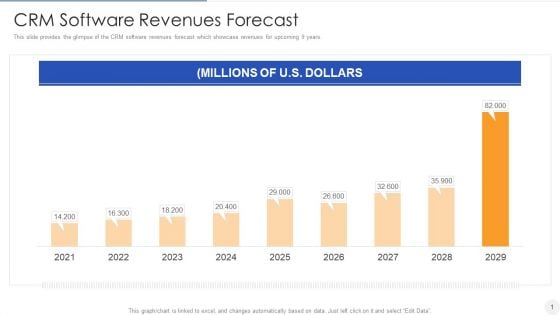
CRM Software Revenues Forecast Template PDF
Deliver an awe inspiring pitch with this creative crm software revenues forecast template pdf bundle. Topics like crm software revenues forecast can be discussed with this completely editable template. It is available for immediate download depending on the needs and requirements of the user.
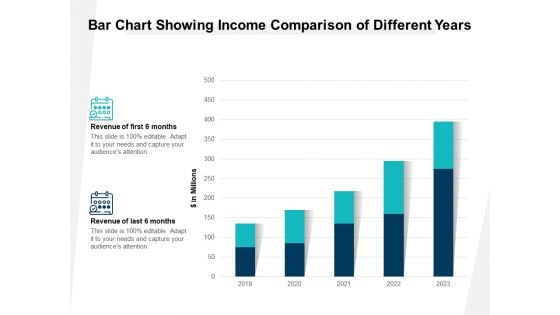
Bar Chart Showing Income Comparison Of Different Years Ppt PowerPoint Presentation Gallery Ideas PDF
Presenting this set of slides with name bar chart showing income comparison of different years ppt powerpoint presentation gallery ideas pdf. The topics discussed in these slides are revenue of first 6 months, revenue of last 6 months. This is a completely editable PowerPoint presentation and is available for immediate download. Download now and impress your audience.
Growing Online Revenues PowerPoint Ppt Templates
Growing Online Revenues PowerPoint PPT templates-These high quality powerpoint pre-designed slides and powerpoint templates have been carefully created by our professional team to help you impress your audience. All slides have been created and are 100% editable in powerpoint. Each and every property of any graphic - color, size, orientation, shading, outline etc. can be modified to help you build an effective powerpoint presentation. Any text can be entered at any point in the powerpoint template or slide. Simply DOWNLOAD, TYPE and PRESENT!These PowerPoint designs and slide layouts can be used to in presentations relating to --Achievement, analysis, arrow, bank, banking, bar, business, capital, chart, coin, concept, credit, currency, deposit, diagram, earn, earnings, economics, finance, financial, gain, gold, golden, graph, growth, idea, interest, investment, isolated, make, marketing, monetary, money, company,computer,funding,grid,growing,green,growth,precut,statistics,succeed,tradc, savings, stack, strategy, success Our Growing Online Revenues PowerPoint Ppt Templates will be your alter ego. They will exemplify your thoughts.
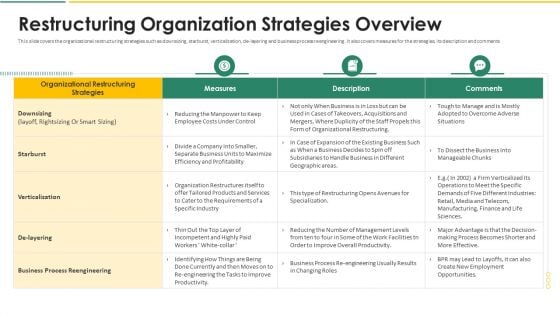
Organization Chart And Corporate Model Transformation Restructuring Organization Strategies Overview Information PDF
This slide covers the over all risk identification for business such as revenue improvement, cost reduction, cost of risk mitigation while restructuring the organization. Deliver and pitch your topic in the best possible manner with this organization chart and corporate model transformation restructuring organization strategies overview information pdf. Use them to share invaluable insights on revenue improvement, cost reduction, cost of risk mitigation and impress your audience. This template can be altered and modified as per your expectations. So, grab it now.
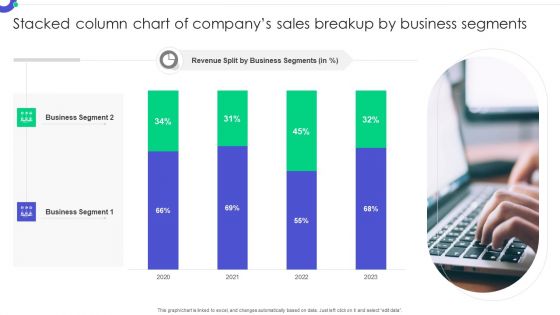
Stacked Column Chart Of Companys Sales Breakup By Business Segments Rules PDF
Pitch your topic with ease and precision using this Stacked Column Chart Of Companys Sales Breakup By Business Segments Rules PDF. This layout presents information on Business Segment, Revenue Split, Business Segments. It is also available for immediate download and adjustment. So, changes can be made in the color, design, graphics or any other component to create a unique layout.
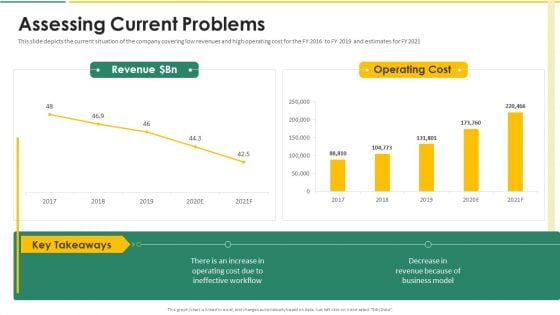
Organization Chart And Corporate Model Transformation Assessing Current Problems Information PDF
This slide depicts the current situation of the company covering low revenues and high operating cost for the FY 2016 to FY 2019 and estimates for FY 2021. Deliver an awe inspiring pitch with this creative organization chart and corporate model transformation assessing current problems information pdf bundle. Topics like revenue dollar bn, operating cost can be discussed with this completely editable template. It is available for immediate download depending on the needs and requirements of the user.
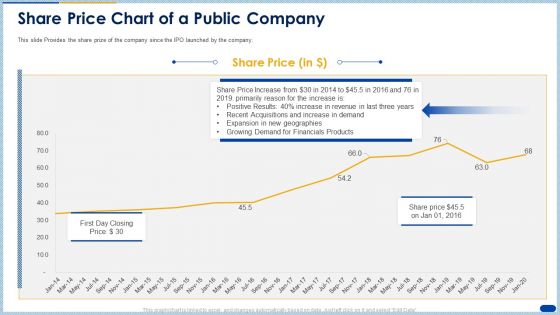
Raising Capital Banking Organizations Post Initial Offering Share Price Chart Of A Public Company Slides PDF
This slide Provides the share prize of the company since the IPO launched by the company. Deliver an awe inspiring pitch with this creative raising capital banking organizations post initial offering share price chart of a public company slides pdf bundle. Topics like growing demand, financials products, revenue can be discussed with this completely editable template. It is available for immediate download depending on the needs and requirements of the user.
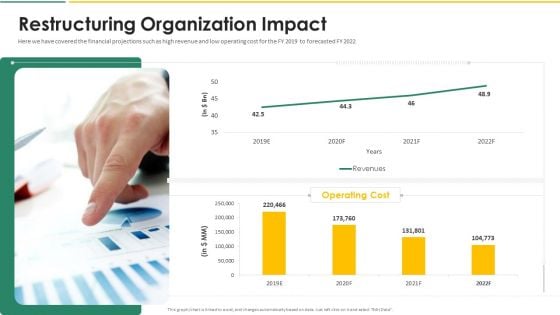
Organization Chart And Corporate Model Transformation Restructuring Organization Impact Structure PDF
Here we have covered the financial projections such as high revenue and low operating cost for the FY 2019 to forecasted FY 2022. Deliver and pitch your topic in the best possible manner with this organization chart and corporate model transformation restructuring organization impact structure pdf. Use them to share invaluable insights on restructuring organization impact and impress your audience. This template can be altered and modified as per your expectations. So, grab it now.
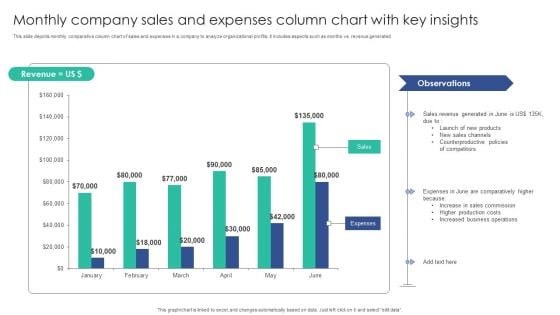
Monthly Company Sales And Expenses Column Chart With Key Insights Mockup PDF
This slide depicts monthly comparative column chart of sales and expenses in a company to analyze organizational profits. It includes aspects such as months vs. revenue generatedPitch your topic with ease and precision using this Monthly Company Sales And Expenses Column Chart With Key Insights Mockup PDF. This layout presents information on Sales Channels, Counterproductive Policies, Sales Commission. It is also available for immediate download and adjustment. So, changes can be made in the color, design, graphics or any other component to create a unique layout.
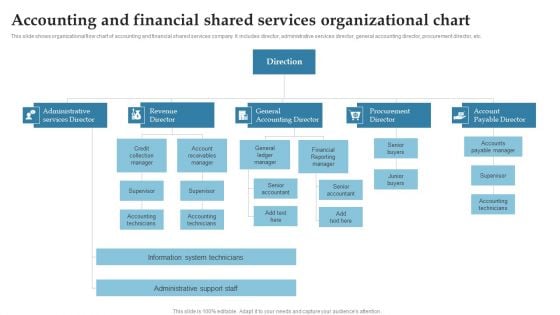
Accounting And Financial Shared Services Organizational Chart Ppt Styles Example PDF
This slide shows organizational flow chart of accounting and financial shared services company. It includes director, administrative services director, general accounting director, procurement director, etc. Persuade your audience using this Accounting And Financial Shared Services Organizational Chart Ppt Styles Example PDF. This PPT design covers seven stages, thus making it a great tool to use. It also caters to a variety of topics including Revenue Director, General Accounting Director, Procurement Director, Account Payable Director. Download this PPT design now to present a convincing pitch that not only emphasizes the topic but also showcases your presentation skills.
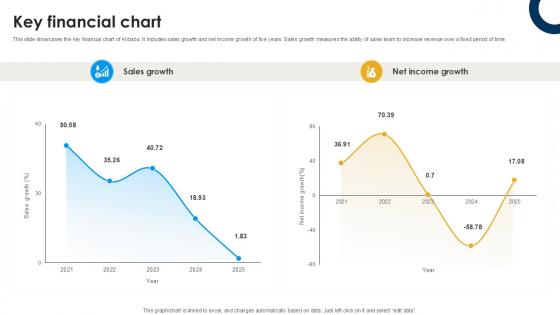
Key Financial Chart International Trade Of Products And Services PPT Template CP SS V
This slide showcases the key financial chart of Alibaba. It includes sales growth and net income growth of five years. Sales growth measures the ability of sales team to increase revenue over a fixed period of time. This modern and well-arranged Key Financial Chart International Trade Of Products And Services PPT Template CP SS V provides lots of creative possibilities. It is very simple to customize and edit with the Powerpoint Software. Just drag and drop your pictures into the shapes. All facets of this template can be edited with Powerpoint, no extra software is necessary. Add your own material, put your images in the places assigned for them, adjust the colors, and then you can show your slides to the world, with an animated slide included. This slide showcases the key financial chart of Alibaba. It includes sales growth and net income growth of five years. Sales growth measures the ability of sales team to increase revenue over a fixed period of time.
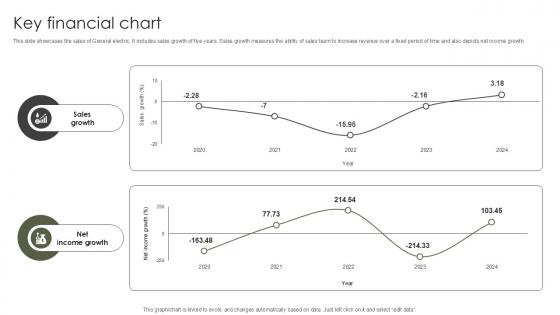
Key Financial Chart Military Aircraft Engine Manufacturing PPT Presentation CP SS V
This slide showcases the sales of General electric. It includes sales growth of five years. Sales growth measures the ability of sales team to increase revenue over a fixed period of time and also depicts net income growth. Explore a selection of the finest Key Financial Chart Military Aircraft Engine Manufacturing PPT Presentation CP SS V here. With a plethora of professionally designed and pre-made slide templates, you can quickly and easily find the right one for your upcoming presentation. You can use our Key Financial Chart Military Aircraft Engine Manufacturing PPT Presentation CP SS V to effectively convey your message to a wider audience. Slidegeeks has done a lot of research before preparing these presentation templates. The content can be personalized and the slides are highly editable. Grab templates today from Slidegeeks. This slide showcases the sales of General electric. It includes sales growth of five years. Sales growth measures the ability of sales team to increase revenue over a fixed period of time and also depicts net income growth.
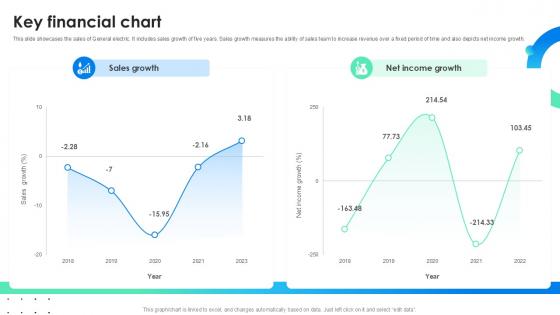
Key Financial Chart Global Energy Company Profile PPT Example CP SS V
This slide showcases the sales of General electric. It includes sales growth of five years. Sales growth measures the ability of sales team to increase revenue over a fixed period of time and also depicts net income growth. Explore a selection of the finest Key Financial Chart Global Energy Company Profile PPT Example CP SS V here. With a plethora of professionally designed and pre-made slide templates, you can quickly and easily find the right one for your upcoming presentation. You can use our Key Financial Chart Global Energy Company Profile PPT Example CP SS V to effectively convey your message to a wider audience. Slidegeeks has done a lot of research before preparing these presentation templates. The content can be personalized and the slides are highly editable. Grab templates today from Slidegeeks. This slide showcases the sales of General electric. It includes sales growth of five years. Sales growth measures the ability of sales team to increase revenue over a fixed period of time and also depicts net income growth.
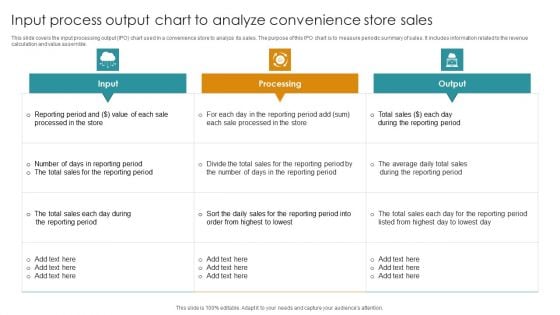
Input Process Output Chart To Analyze Convenience Store Sales Microsoft PDF
This slide covers the input processing output IPO chart used in a convenience store to analyze its sales. The purpose of this IPO chart is to measure periodic summary of sales. It includes information related to the revenue calculation and value assemble. Pitch your topic with ease and precision using this Input Process Output Chart To Analyze Convenience Store Sales Microsoft PDF. This layout presents information on Input, Processing, Output. It is also available for immediate download and adjustment. So, changes can be made in the color, design, graphics or any other component to create a unique layout.

Key Financial Chart Digital Marketings Strategies PPT PowerPoint CP SS V
This slide showcases the sales of Aerospace company. It includes sales growth and net income growth of five years. Sales growth measures the ability of sales team to increase revenue over a fixed period of time. Coming up with a presentation necessitates that the majority of the effort goes into the content and the message you intend to convey. The visuals of a PowerPoint presentation can only be effective if it supplements and supports the story that is being told. Keeping this in mind our experts created Key Financial Chart Digital Marketings Strategies PPT PowerPoint CP SS V to reduce the time that goes into designing the presentation. This way, you can concentrate on the message while our designers take care of providing you with the right template for the situation. This slide showcases the sales of Aerospace company. It includes sales growth and net income growth of five years. Sales growth measures the ability of sales team to increase revenue over a fixed period of time.
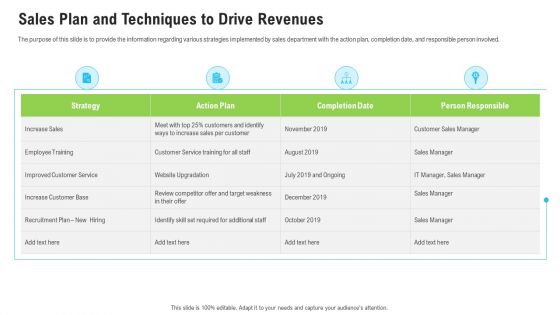
Sales Department Strategies Increase Revenues Sales Plan And Techniques To Drive Revenues Template PDF
The purpose of this slide is to provide the information regarding various strategies implemented by sales department with the action plan, completion date, and responsible person involved. Deliver and pitch your topic in the best possible manner with this sales department strategies increase revenues sales plan and techniques to drive revenues template pdf. Use them to share invaluable insights on improved customer service, increase customer base, increase sales and impress your audience. This template can be altered and modified as per your expectations. So, grab it now.
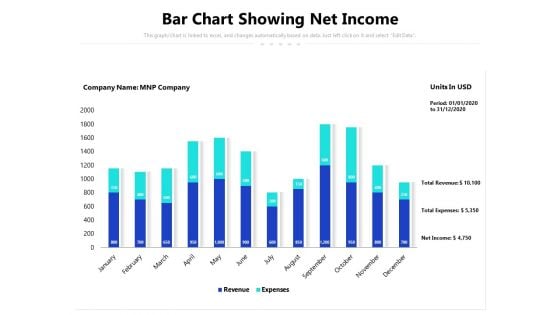
Bar Chart Showing Net Income Ppt PowerPoint Presentation File Grid PDF
Presenting this set of slides with name bar chart showing net income ppt powerpoint presentation file grid pdf. The topics discussed in these slides are net income, expenses, total revenue. This is a completely editable PowerPoint presentation and is available for immediate download. Download now and impress your audience.
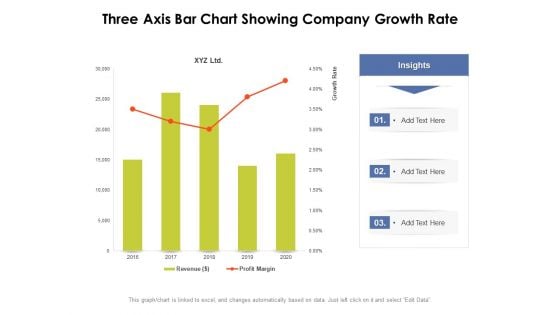
Three Axis Bar Chart Showing Company Growth Rate Ppt PowerPoint Presentation Summary Graphics Pictures PDF
Presenting this set of slides with name three axis bar chart showing company growth rate ppt powerpoint presentation summary graphics pictures pdf. The topics discussed in these slides are insights, growth rate, revenue, profit margin, 2016 to 2020. This is a completely editable PowerPoint presentation and is available for immediate download. Download now and impress your audience.
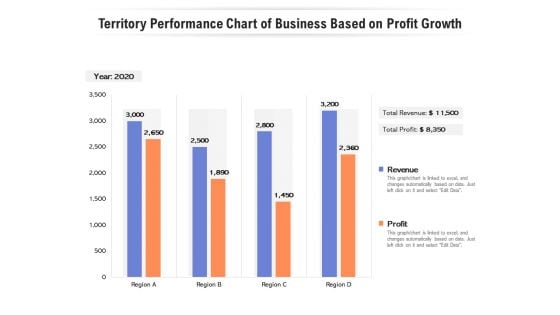
Territory Performance Chart Of Business Based On Profit Growth Ppt PowerPoint Presentation Show Aids PDF
Presenting this set of slides with name territory performance chart of business based on profit growth ppt powerpoint presentation show aids pdf. The topics discussed in these slides are revenue, profit, 2020. This is a completely editable PowerPoint presentation and is available for immediate download. Download now and impress your audience.
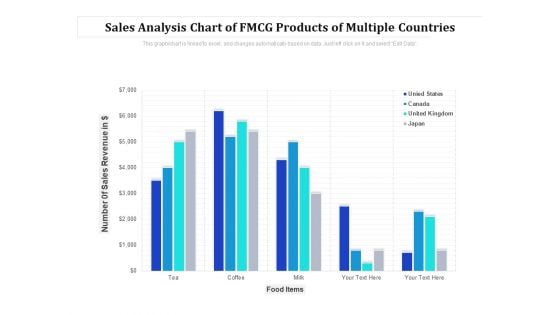
Sales Analysis Chart Of Fmcg Products Of Multiple Countries Ppt PowerPoint Presentation Pictures Show PDF
Showcasing this set of slides titled sales analysis chart of fmcg products of multiple countries ppt powerpoint presentation pictures show pdf. The topics addressed in these templates are number sales revenue, food items. All the content presented in this PPT design is completely editable. Download it and make adjustments in color, background, font etc. as per your unique business setting.
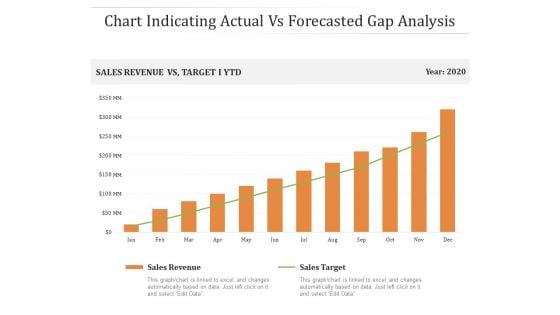
Chart Indicating Actual Vs Forecasted Gap Analysis Ppt PowerPoint Presentation Gallery Slides PDF
Presenting this set of slides with name chart indicating actual vs forecasted gap analysis ppt powerpoint presentation gallery slides pdf. The topics discussed in these slides are sales, target, revenue. This is a completely editable PowerPoint presentation and is available for immediate download. Download now and impress your audience.
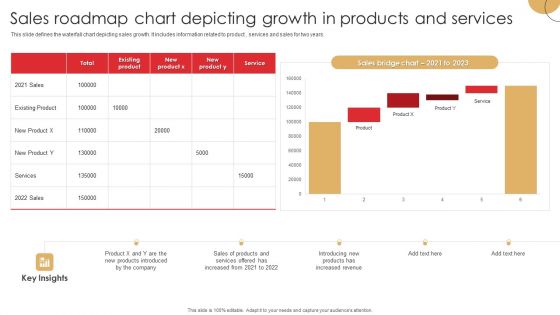
Sales Roadmap Chart Depicting Growth In Products And Services Ideas PDF
This slide defines the waterfall chart depicting sales growth. It includes information related to product , services and sales for two years.Pitch your topic with ease and precision using this Sales Roadmap Chart Depicting Growth In Products And Services Ideas PDF. This layout presents information on Products Introduced, Increased Revenue, Services Offered. It is also available for immediate download and adjustment. So, changes can be made in the color, design, graphics or any other component to create a unique layout.
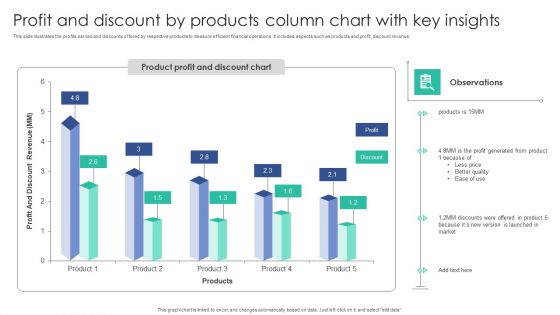
Profit And Discount By Products Column Chart With Key Insights Template PDF
This slide illustrates the profits earned and discounts offered by respective products to measure efficient financial operations. It includes aspects such as products and profit, discount revenue.Showcasing this set of slides titled Profit And Discount By Products Column Chart With Key Insights Template PDF. The topics addressed in these templates are Product Profit, Generated Product, Version Launched. All the content presented in this PPT design is completely editable. Download it and make adjustments in color, background, font etc. as per your unique business setting.
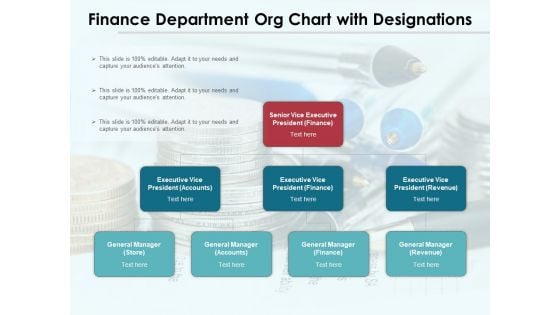
Finance Department Org Chart With Designations Ppt PowerPoint Presentation Professional Show PDF
Presenting finance department org chart with designations ppt powerpoint presentation professional show pdf to dispense important information. This template comprises one stages. It also presents valuable insights into the topics including finance, accounts, revenue, store. This is a completely customizable PowerPoint theme that can be put to use immediately. So, download it and address the topic impactfully.
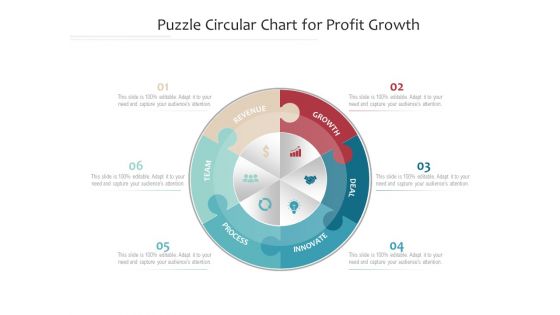
Puzzle Circular Chart For Profit Growth Ppt PowerPoint Presentation Show Themes PDF
Presenting this set of slides with name puzzle circular chart for profit growth ppt powerpoint presentation show themes pdf. This is a six stage process. The stages in this process are growth, deal, innovate, process, team, revenue. This is a completely editable PowerPoint presentation and is available for immediate download. Download now and impress your audience.
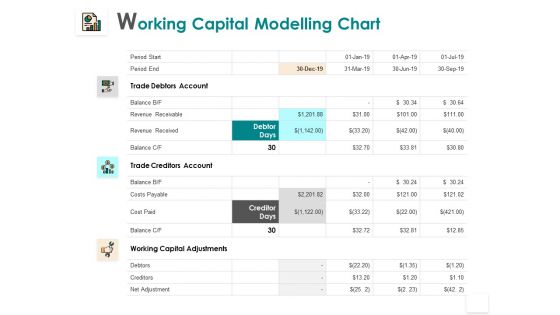
Working Capital Modelling Chart Adjustments Adjustment Ppt PowerPoint Presentation Inspiration Rules
Presenting this set of slides with name working capital modelling chart adjustments adjustment ppt powerpoint presentation inspiration rules. The topics discussed in these slides are costs, revenue, adjustments, debtors, creditors. This is a completely editable PowerPoint presentation and is available for immediate download. Download now and impress your audience.
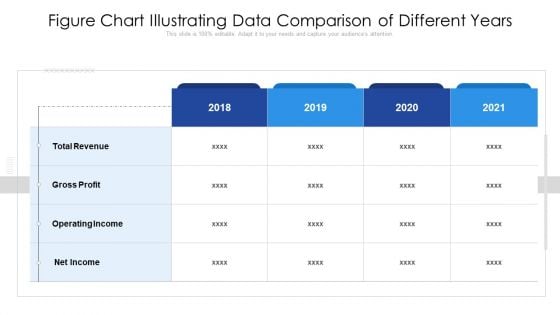
Figure Chart Illustrating Data Comparison Of Different Years Ppt PowerPoint Presentation File Inspiration PDF
Pitch your topic with ease and precision using this figure chart illustrating data comparison of different years ppt powerpoint presentation file inspiration pdf. This layout presents information on gross profit, total revenue, operating income. It is also available for immediate download and adjustment. So, changes can be made in the color, design, graphics or any other component to create a unique layout.
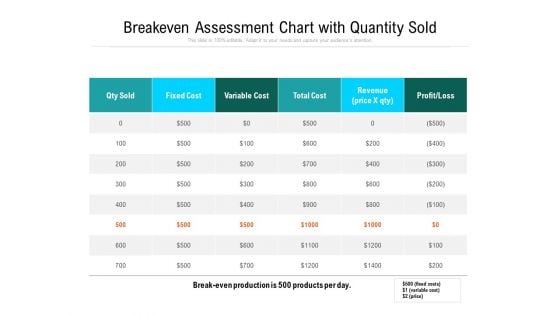
Breakeven Assessment Chart With Quantity Sold Ppt PowerPoint Presentation Summary Themes PDF
Pitch your topic with ease and precision using this breakeven assessment chart with quantity sold ppt powerpoint presentation summary themes pdf. This layout presents information on fixed cost, variable cost, revenue, profit loss. It is also available for immediate download and adjustment. So, changes can be made in the color, design, graphics or any other component to create a unique layout.
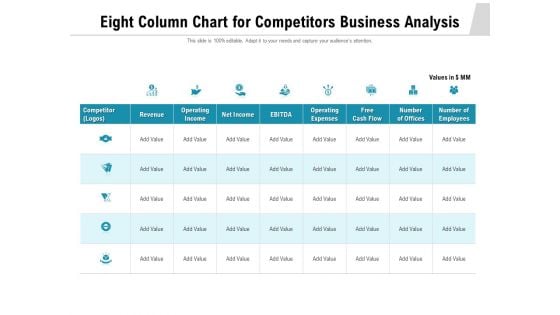
Eight Column Chart For Competitors Business Analysis Ppt PowerPoint Presentation Gallery Format PDF
Showcasing this set of slides titled eight column chart for competitors business analysis ppt powerpoint presentation gallery format pdf. The topics addressed in these templates are revenue, operating income, net income. All the content presented in this PPT design is completely editable. Download it and make adjustments in colour, background, font etc. as per your unique business setting.
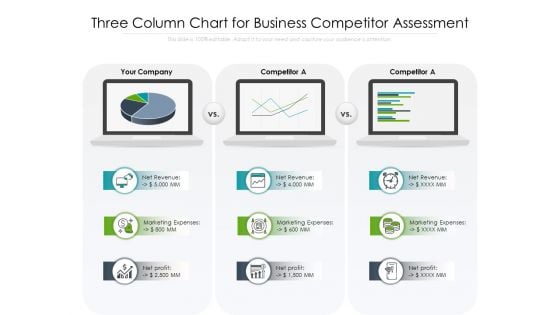
Three Column Chart For Business Competitor Assessment Ppt PowerPoint Presentation Layouts Clipart Images PDF
Showcasing this set of slides titled three column chart for business competitor assessment ppt powerpoint presentation layouts clipart images pdf. The topics addressed in these templates are marketing expenses, net profit, net revenue, competitor. All the content presented in this PPT design is completely editable. Download it and make adjustments in color, background, font etc. as per your unique business setting.
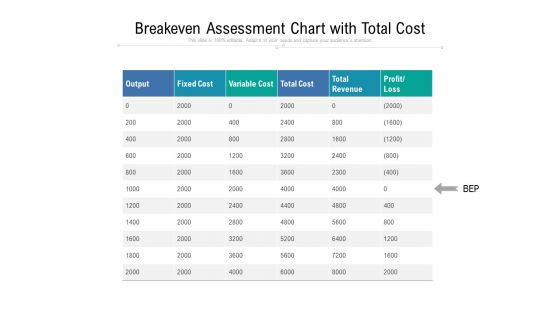
Breakeven Assessment Chart With Total Cost Ppt PowerPoint Presentation File Picture PDF
Showcasing this set of slides titled breakeven assessment chart with total cost ppt powerpoint presentation file picture pdf. The topics addressed in these templates are fixed cost, variable cost, total revenue, total cost, profit loss. All the content presented in this PPT design is completely editable. Download it and make adjustments in color, background, font etc. as per your unique business setting.
9 Stages Puzzle Circular Chart With Icons Ppt PowerPoint Presentation Model Slides PDF
Presenting this set of slides with name 9 stages puzzle circular chart with icons ppt powerpoint presentation model slides pdf. This is a nine stage process. The stages in this process are organize, revenue, success, target, leader, analyze, time, idea, innovate. This is a completely editable PowerPoint presentation and is available for immediate download. Download now and impress your audience.
Statistics Chart Indicating RD Expenditure Ppt PowerPoint Presentation Icon Example PDF
Presenting this set of slides with name statistics chart indicating rd expenditure ppt powerpoint presentation icon example pdf. The topics discussed in these slides are revenue, expenditure, competitor. This is a completely editable PowerPoint presentation and is available for immediate download. Download now and impress your audience.
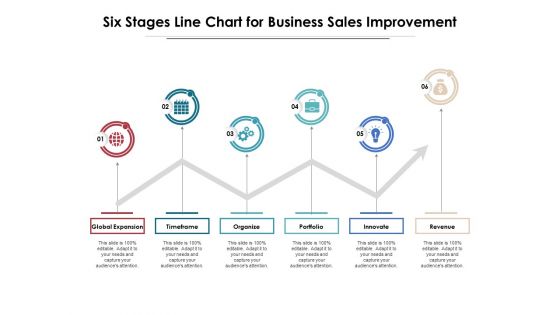
Six Stages Line Chart For Business Sales Improvement Ppt PowerPoint Presentation Inspiration Outline PDF
Presenting six stages line chart for business sales improvement ppt powerpoint presentation inspiration outline pdf to dispense important information. This template comprises six stages. It also presents valuable insights into the topics including global expansion, timeframe, organize, portfolio, innovate, revenue. This is a completely customizable PowerPoint theme that can be put to use immediately. So, download it and address the topic impactfully.
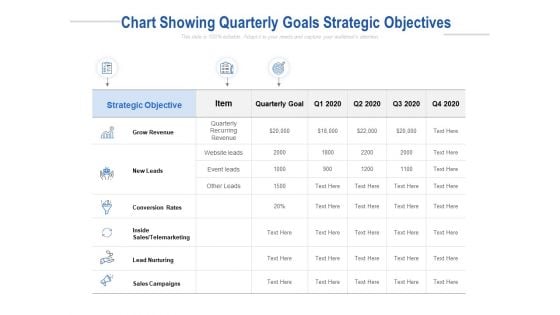
Chart Showing Quarterly Goals Strategic Objectives Ppt PowerPoint Presentation Outline Ideas
Presenting this set of slides with name chart showing quarterly goals strategic objectives ppt powerpoint presentation outline ideas. The topics discussed in these slides are conversion rates, grow revenue, sales campaigns. This is a completely editable PowerPoint presentation and is available for immediate download. Download now and impress your audience.
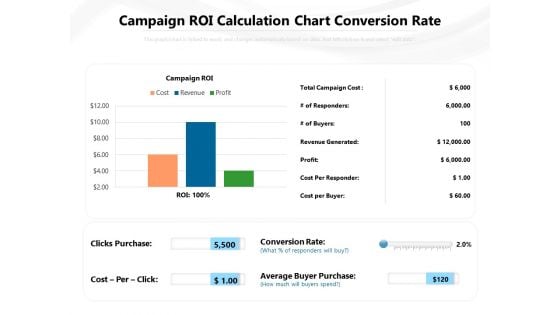
Campaign ROI Calculation Chart Conversion Rate Ppt PowerPoint Presentation Gallery Design Ideas PDF
Presenting this set of slides with name campaign roi calculation chart conversion rate ppt powerpoint presentation gallery design ideas pdf. The topics discussed in these slides are revenue, cost, campaign. This is a completely editable PowerPoint presentation and is available for immediate download. Download now and impress your audience.
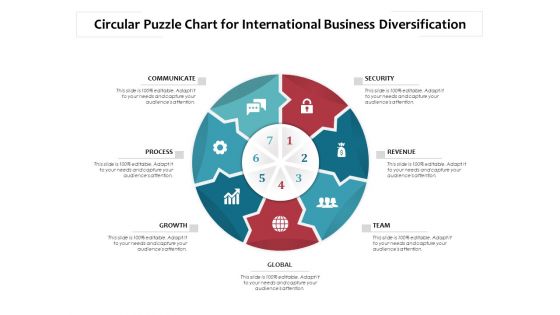
Circular Puzzle Chart For International Business Diversification Ppt PowerPoint Presentation Layouts Guidelines PDF
Presenting this set of slides with name circular puzzle chart for international business diversification ppt powerpoint presentation layouts guidelines pdf. This is a seven stage process. The stages in this process are security, revenue, team, global, growth, process, communicate. This is a completely editable PowerPoint presentation and is available for immediate download. Download now and impress your audience.
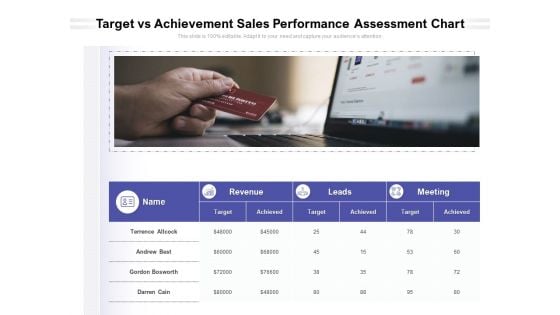
Target Vs Achievement Sales Performance Assessment Chart Ppt PowerPoint Presentation File Display PDF
Presenting this set of slides with name target vs achievement sales performance assessment chart ppt powerpoint presentation file display pdf. This is a three stage process. The stages in this process are revenue, leads, target. This is a completely editable PowerPoint presentation and is available for immediate download. Download now and impress your audience.
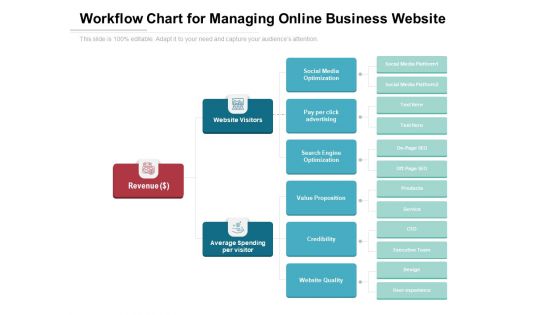
Workflow Chart For Managing Online Business Website Ppt PowerPoint Presentation File Graphics Download PDF
Presenting this set of slides with name workflow chart for managing online business website ppt powerpoint presentation file graphics download pdf. This is a three stage process. The stages in this process are website visitors, average, revenue. This is a completely editable PowerPoint presentation and is available for immediate download. Download now and impress your audience.
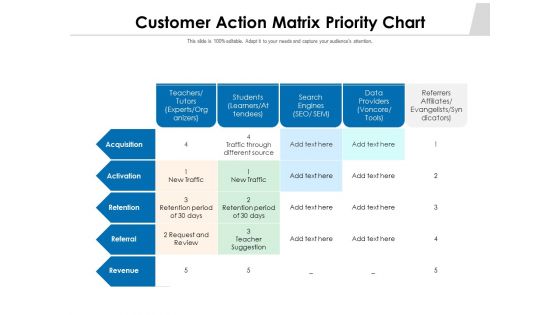
Customer Action Matrix Priority Chart Ppt PowerPoint Presentation Gallery Slides PDF
Showcasing this set of slides titled customer action matrix priority chart ppt powerpoint presentation gallery slides pdf. The topics addressed in these templates are acquisition, retention, revenue. All the content presented in this PPT design is completely editable. Download it and make adjustments in color, background, font etc. as per your unique business setting.
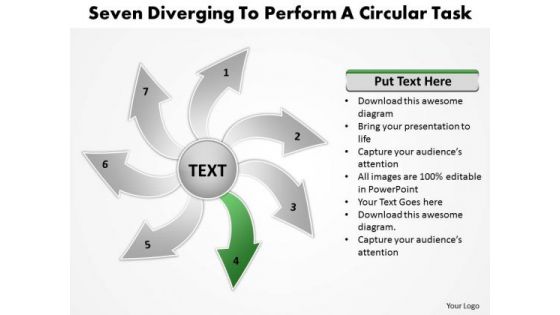
Seven Diverging Steps To Perform Circular Task Flow Chart PowerPoint Slides
We present our seven diverging steps to perform circular task Flow Chart PowerPoint Slides.Download our Flow Charts PowerPoint Templates because with the help of our Slides you can Illustrate the means to prevent or control them using our imaginative templates. Download our Business PowerPoint Templates because this template can project the path to sucess that you have charted. Download and present our Arrows PowerPoint Templates because this graphics helps you to prove how they mesh to motivate the company team and provide the steam to activate the composite machine. Use our Shapes PowerPoint Templates because others respect the intrinsic value of your words. Download and present our Process and Flows PowerPoint Templates because Our PowerPoint Templates and Slides will provide weight to your words. They will bring out the depth of your thought process.Use these PowerPoint slides for presentations relating to Arrow, Business, Chart, Circular, Concept, Diagram, Informative, Internet, Market, Marketing, Member, Performance, Process, Profit, Profitable, Project, Refer, Referral, Referring, Revenue, Socialize, Steps, Strategy, Web, Websites. The prominent colors used in the PowerPoint template are Green, White, Gray. People tell us our seven diverging steps to perform circular task Flow Chart PowerPoint Slides look good visually. People tell us our Concept PowerPoint templates and PPT Slides will impress their bosses and teams. The feedback we get is that our seven diverging steps to perform circular task Flow Chart PowerPoint Slides are Great. Presenters tell us our Circular PowerPoint templates and PPT Slides are Wonderful. Customers tell us our seven diverging steps to perform circular task Flow Chart PowerPoint Slides are Vintage. The feedback we get is that our Chart PowerPoint templates and PPT Slides effectively help you save your valuable time. Make them feel up to it with our Seven Diverging Steps To Perform Circular Task Flow Chart PowerPoint Slides. Assure them with your words.
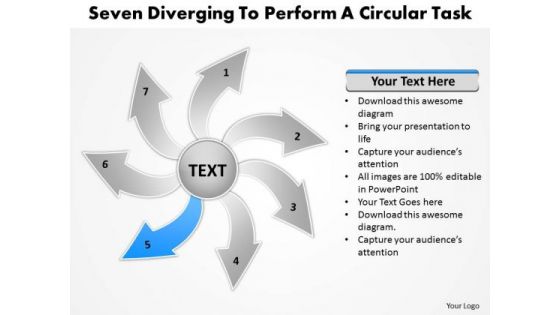
Seven Diverging Steps To Perform A Circular Task Flow Chart PowerPoint Slide
We present our seven diverging steps to perform a circular task Flow Chart PowerPoint Slide.Present our Flow Charts PowerPoint Templates because presenting your views using our innovative slides, will be assured of leaving a lasting impression. Download and present our Business PowerPoint Templates because this template can project the path to sucess that you have charted. Use our Arrows PowerPoint Templates because this is a wonderful graphics to see the smiles of happiness spread as your audience realizes the value of your words. Download and present our Shapes PowerPoint Templates because our cleverly selected background hues are guaranteed to achieve this aim. Present our Process and Flows PowerPoint Templates because firing the arrows to emblazon the desired path will let you achieve anticipated results.Use these PowerPoint slides for presentations relating to Arrow, Business, Chart, Circular, Concept, Diagram, Informative, Internet, Market, Marketing, Member, Performance, Process, Profit, Profitable, Project, Refer, Referral, Referring, Revenue, Socialize, Steps, Strategy, Web, Websites. The prominent colors used in the PowerPoint template are Blue, Gray, White. People tell us our seven diverging steps to perform a circular task Flow Chart PowerPoint Slide are second to none. People tell us our Circular PowerPoint templates and PPT Slides will save the presenter time. The feedback we get is that our seven diverging steps to perform a circular task Flow Chart PowerPoint Slide are Wonderful. Presenters tell us our Internet PowerPoint templates and PPT Slides are aesthetically designed to attract attention. We guarantee that they will grab all the eyeballs you need. Customers tell us our seven diverging steps to perform a circular task Flow Chart PowerPoint Slide will save the presenter time. The feedback we get is that our Circular PowerPoint templates and PPT Slides are Lush. Do not allow any distractions. Our Seven Diverging Steps To Perform A Circular Task Flow Chart PowerPoint Slide do away with those far away looks.
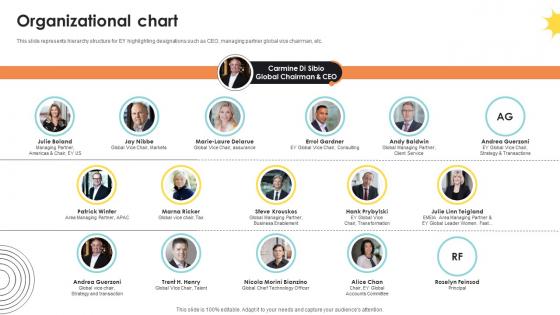
Organizational Chart Professional Services And Tax Advisory Company Profile CP SS V
This slide represents hierarchy structure for EY highlighting designations such as CEO, managing partner global vice chairman, etc.Make sure to capture your audiences attention in your business displays with our gratis customizable Organizational Chart Professional Services And Tax Advisory Company Profile CP SS V. These are great for business strategies, office conferences, capital raising or task suggestions. If you desire to acquire more customers for your tech business and ensure they stay satisfied, create your own sales presentation with these plain slides. This slide represents hierarchy structure for EY highlighting designations such as CEO, managing partner global vice chairman, etc.

Business Chart Showing CAGR Trend Analysis Ppt PowerPoint Presentation Professional Slides
Presenting this set of slides with name business chart showing cagr trend analysis ppt powerpoint presentation professional slides. The topics discussed in these slides are total revenues, gross profit, operating income, net income. This is a completely editable PowerPoint presentation and is available for immediate download. Download now and impress your audience.
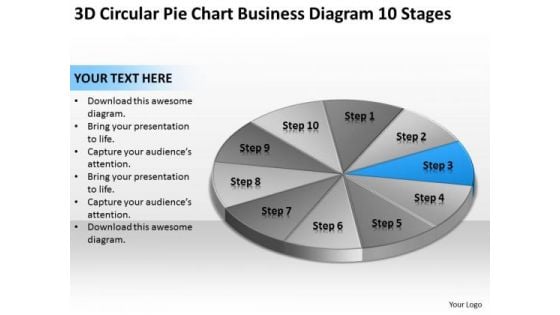
Chart Business Diagram 10 Stages Ppt Non Profit Plan Template PowerPoint Slides
We present our chart business diagram 10 stages ppt non profit plan template PowerPoint Slides.Use our Process and Flows PowerPoint Templates because You should Ascend the ladder of success with ease. Our PowerPoint Templates and Slides will provide strong and sturdy steps. Use our Circle Charts PowerPoint Templates because you should Whip up a frenzy with our PowerPoint Templates and Slides. They will fuel the excitement of your team. Use our Business PowerPoint Templates because Timeline crunches are a fact of life. Meet all deadlines using our PowerPoint Templates and Slides. Download and present our Marketing PowerPoint Templates because Our PowerPoint Templates and Slides are topically designed to provide an attractive backdrop to any subject. Download and present our Shapes PowerPoint Templates because you can Add colour to your speech with our PowerPoint Templates and Slides. Your presentation will leave your audience speechless.Use these PowerPoint slides for presentations relating to Chart, pie, graph, market, economics, economy, target, business, concept, success, diagram, circle, percentage, graphic, finance, revenue, element, analysis, report, marketing, modern, illustration, icon, earnings,, growth, ratio, progress, credit, commerce, statistic. The prominent colors used in the PowerPoint template are Blue , Gray, Black. Everyday there is a new way. Stay contemporary with our Chart Business Diagram 10 Stages Ppt Non Profit Plan Template PowerPoint Slides.
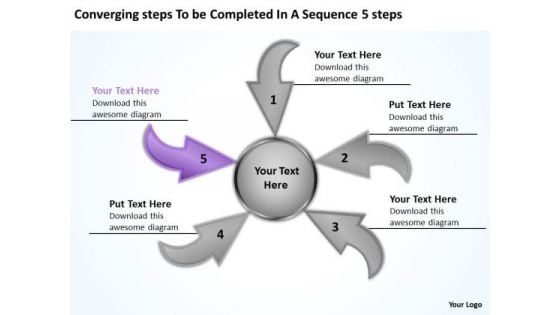
Steps To Be Completed In A Sequence 5 Circular Flow Chart PowerPoint Slides
We present our steps to be completed in a sequence 5 Circular Flow Chart PowerPoint Slides.Present our Arrows PowerPoint Templates because the Gear train is a basic element of living and daily business. Download and present our Process and Flows PowerPoint Templates because business ethics is an essential element in your growth. Present our Flow Charts PowerPoint Templates because you have the ideas, you have got a brainwave. Present our Business PowerPoint Templates because you can Flutter your wings and enchant the world. Impress them with the innate attractiveness of your thoughts and words. Use our Shapes PowerPoint Templates because watching them will strengthen your companys sinews.Use these PowerPoint slides for presentations relating to Arrow, Business, Chart, Circular, Concept, Diagram, Informative, Internet, Market, Marketing, Member, Performance, Process, Profit, Profitable, Project, Refer, Referral, Referring, Revenue, Socialize, Steps, Strategy, Web, Websites. The prominent colors used in the PowerPoint template are Purple, Gray, Black. People tell us our steps to be completed in a sequence 5 Circular Flow Chart PowerPoint Slides are Excellent. People tell us our Diagram PowerPoint templates and PPT Slides are Fun. The feedback we get is that our steps to be completed in a sequence 5 Circular Flow Chart PowerPoint Slides are Whimsical. Presenters tell us our Market PowerPoint templates and PPT Slides look good visually. Customers tell us our steps to be completed in a sequence 5 Circular Flow Chart PowerPoint Slides are Enchanting. The feedback we get is that our Concept PowerPoint templates and PPT Slides are Magnificent. Schedule meetings with our Steps To Be Completed In A Sequence 5 Circular Flow Chart PowerPoint Slides. Download without worries with our money back guaranteee.
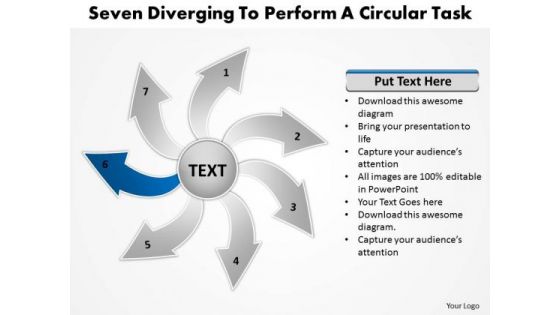
Seven Diverging Steps To Perform A Circular Task Flow Chart PowerPoint Slides
We present our seven diverging steps to perform a circular task Flow Chart PowerPoint Slides.Use our Flow Charts PowerPoint Templates because they are Designed to attract the attention of your audience. Present our Business PowerPoint Templates because this template helps to pierce through the doubts of your audience. Download and present our Arrows PowerPoint Templates because you can Educate your team with the attention to be paid. Download and present our Shapes PowerPoint Templates because like your thoughts arrows are inherently precise and true. Download and present our Process and Flows PowerPoint Templates because they represent the proress in our lives.Use these PowerPoint slides for presentations relating to Arrow, Business, Chart, Circular, Concept, Diagram, Informative, Internet, Market, Marketing, Member, Performance, Process, Profit, Profitable, Project, Refer, Referral, Referring, Revenue, Socialize, Steps, Strategy, Web, Websites. The prominent colors used in the PowerPoint template are Blue navy, Gray, White. People tell us our seven diverging steps to perform a circular task Flow Chart PowerPoint Slides are Elegant. People tell us our Informative PowerPoint templates and PPT Slides are Efficient. The feedback we get is that our seven diverging steps to perform a circular task Flow Chart PowerPoint Slides are Striking. Presenters tell us our Market PowerPoint templates and PPT Slides are Romantic. Customers tell us our seven diverging steps to perform a circular task Flow Chart PowerPoint Slides provide great value for your money. Be assured of finding the best projection to highlight your words. The feedback we get is that our Internet PowerPoint templates and PPT Slides are Striking. You are due to debut on the dais. Ensure an auspicious entry into this environment with our Seven Diverging Steps To Perform A Circular Task Flow Chart PowerPoint Slides
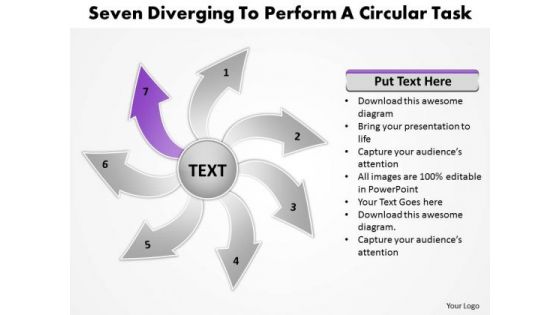
Steps To Perform A Circular Task Relative Arrow Chart PowerPoint Templates
We present our steps to perform a circular task Relative Arrow Chart PowerPoint templates.Download and present our Business PowerPoint Templates because the fruits of your labour are beginning to show.Enlighten them on the great plans you have for their enjoyment. Use our Shapes PowerPoint Templates because this diagram helps you to explain your strategy to co-ordinate activities of these seperate groups. Download our Arrows PowerPoint Templates because you know the path so show the way. Use our Flow Charts PowerPoint Templates because there is a very good saying that prevention is better than cure, either way you have a store of knowledge for sure. Use our Process and Flows PowerPoint Templates because you can Enlighten them with your brilliant understanding of mental health.Use these PowerPoint slides for presentations relating to Arrow, Business, Chart, Circular, Concept, Diagram, Informative, Internet, Market, Marketing, Member, Performance, Process, Profit, Profitable, Project, Refer, Referral, Referring, Revenue, Socialize, Steps, Strategy, Web, Websites. The prominent colors used in the PowerPoint template are Purple, Gray, White. People tell us our steps to perform a circular task Relative Arrow Chart PowerPoint templates are Majestic. People tell us our Internet PowerPoint templates and PPT Slides are Tranquil. The feedback we get is that our steps to perform a circular task Relative Arrow Chart PowerPoint templates are Playful. Presenters tell us our Concept PowerPoint templates and PPT Slides are Versatile. Customers tell us our steps to perform a circular task Relative Arrow Chart PowerPoint templates are topically designed to provide an attractive backdrop to any subject. The feedback we get is that our Circular PowerPoint templates and PPT Slides are designed by a team of presentation professionals. Identify likely ares of failure. Alert your team with our Steps To Perform A Circular Task Relative Arrow Chart PowerPoint Templates.
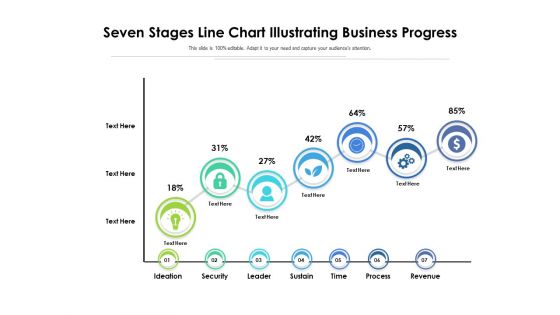
Seven Stages Line Chart Illustrating Business Progress Ppt PowerPoint Presentation Styles Professional PDF
Persuade your audience using this seven stages line chart illustrating business progress ppt powerpoint presentation styles professional pdf. This PPT design covers seven stages, thus making it a great tool to use. It also caters to a variety of topics including ideation, security, leader, sustain, time, process, revenue. Download this PPT design now to present a convincing pitch that not only emphasizes the topic but also showcases your presentation skills.
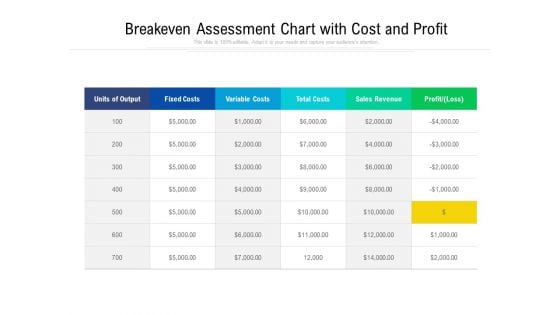
Breakeven Assessment Chart With Cost And Profit Ppt PowerPoint Presentation Styles Elements PDF
Pitch your topic with ease and precision using this breakeven assessment chart with cost and profit ppt powerpoint presentation styles elements pdf. This layout presents information on fixed costs, variable costs, total costs, sales revenue, profit loss It is also available for immediate download and adjustment. So, changes can be made in the color, design, graphics or any other component to create a unique layout.
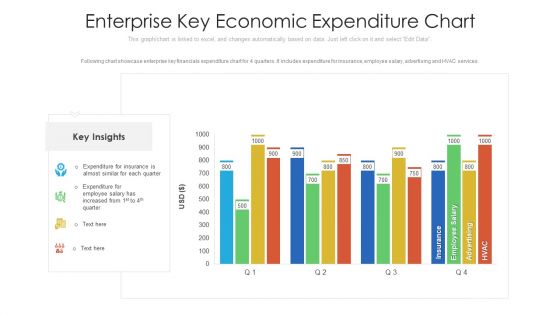
Enterprise Key Economic Expenditure Chart Ppt PowerPoint Presentation File Designs Download PDF
Following chart showcase enterprise key financials expenditure chart for 4 quarters. It includes expenditure for insurance, employee salary, advertising and HVAC services. Pitch your topic with ease and precision using this enterprise key economic expenditure chart ppt powerpoint presentation file designs download pdf. This layout presents information on enterprise key economic expenditure chart. It is also available for immediate download and adjustment. So, changes can be made in the color, design, graphics or any other component to create a unique layout.
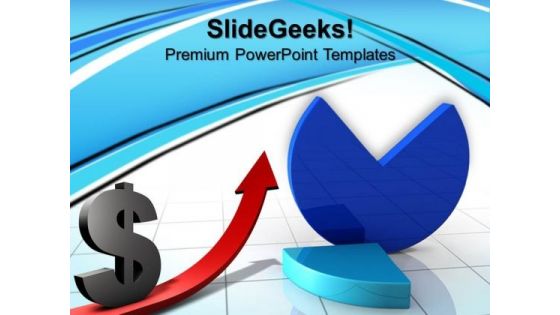
Pie Chart With Dollar Success PowerPoint Templates And PowerPoint Themes 0612
Pie Chart With Dollar Success PowerPoint Templates And PowerPoint Themes 0612-Microsoft Powerpoint Templates and Background with pie chart with dollar Observe growth with our Pie Chart With Dollar Success PowerPoint Templates And PowerPoint Themes 0612. Download without worries with our money back guaranteee.
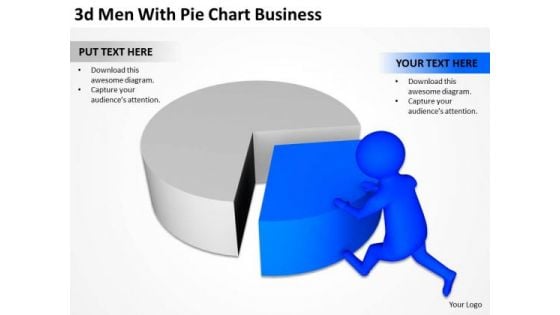
Top Business People 3d Man With Pie Chart New PowerPoint Presentation Templates
We present our top business people 3d man with pie chart new powerpoint presentation templates.Present our Circle Charts PowerPoint Templates because You can Be the star of the show with our PowerPoint Templates and Slides. Rock the stage with your ideas. Present our Business PowerPoint Templates because Our PowerPoint Templates and Slides will Activate the energies of your audience. Get their creative juices flowing with your words. Download our People PowerPoint Templates because our PowerPoint Templates and Slides will give your ideas the shape. Use our Shapes PowerPoint Templates because It will mark the footprints of your journey. Illustrate how they will lead you to your desired destination. Download our Success PowerPoint Templates because You can Channelise the thoughts of your team with our PowerPoint Templates and Slides. Urge them to focus on the goals you have set.Use these PowerPoint slides for presentations relating to 3d,active, analysis, business, cartoon, character, chart, commerce, company, data,diagram, earning, economy, figures, financial, forecast, gain, goal, graph, growth,guy, income, investment, male, man, market, money, monthly, number, person,pie, planning, positive, profit, profitable, progress, pushing, report, research,results, revenue, sale, sheet, spreadsheet, statement, statistics, stock, table. The prominent colors used in the PowerPoint template are Blue , Gray, Black. We assure you our top business people 3d man with pie chart new powerpoint presentation templates provide you with a vast range of viable options. Select the appropriate ones and just fill in your text. You can be sure our character PowerPoint templates and PPT Slides will make the presenter successul in his career/life. Use our top business people 3d man with pie chart new powerpoint presentation templates will make the presenter successul in his career/life. We assure you our chart PowerPoint templates and PPT Slides will get their audience's attention. Use our top business people 3d man with pie chart new powerpoint presentation templates will make you look like a winner. Professionals tell us our chart PowerPoint templates and PPT Slides will generate and maintain the level of interest you desire. They will create the impression you want to imprint on your audience. Convincing an audience can be demanding. Assert your credibilitywith our Top Business People 3d Man With Pie Chart New PowerPoint Presentation Templates.

Pie Chart With Dollar Sign Finance PowerPoint Templates And PowerPoint Themes 0712
Pie Chart With Dollar Sign Finance PowerPoint Templates And PowerPoint Themes Power Point-Microsoft Powerpoint Templates and Background with pie chart with dollar There are no exceptions for our Pie Chart With Dollar Sign Finance PowerPoint Templates And PowerPoint Themes 0712. Each and every one gives you a firm base.
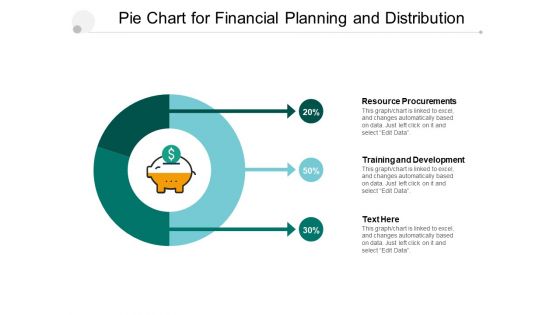
Pie Chart For Financial Planning And Distribution Ppt PowerPoint Presentation File Deck
Presenting this set of slides with name pie chart for financial planning and distribution ppt powerpoint presentation file deck. The topics discussed in these slides are pie chart, finance, donut chart. This is a completely editable PowerPoint presentation and is available for immediate download. Download now and impress your audience.
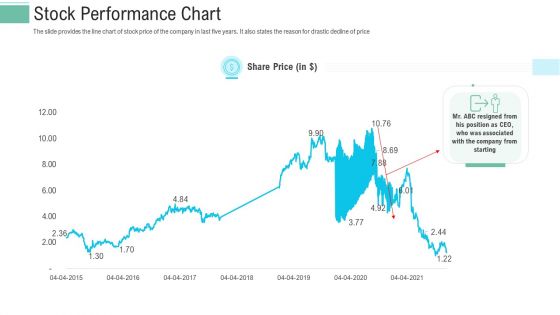
Pitch Presentation Raise Money Spot Market Stock Performance Chart Ppt Portfolio Rules PDF
The slide provides the line chart of stock price of the company in last five years. It also states the reason for drastic decline of price. Deliver and pitch your topic in the best possible manner with this pitch presentation raise money spot market stock performance chart ppt portfolio rules pdf. Use them to share invaluable insights on stock performance chart and impress your audience. This template can be altered and modified as per your expectations. So, grab it now.

Goal Pie Chart Concept Business PowerPoint Templates And PowerPoint Themes 0712
Goal Pie Chart Concept Business PowerPoint Templates And PowerPoint Themes 0712-Microsoft Powerpoint Templates and Background with pie chart concept Lecture teams with our Goal Pie Chart Concept Business PowerPoint Templates And PowerPoint Themes 0712. Download without worries with our money back guaranteee.
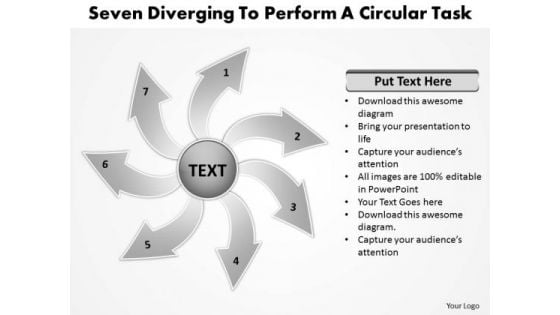
Seven Diverging Steps To Perform A Circular Task Motion Chart PowerPoint Slides
We present our seven diverging steps to perform a circular task Motion Chart PowerPoint Slides.Download our Flow Charts PowerPoint Templates because they pinpoint the core values of your organisation. Use our Business PowerPoint Templates because The foundation of the structure of your business is resilient and dependable. Convey this confidence to your colleagues and assure them of a great and enduring future. Download our Arrows PowerPoint Templates because it explains the goals of each team and how you intend for each slice to contribute to the entire cake. Download our Shapes PowerPoint Templates because the NASA Space programme took mankind to the moon and so much more. Like them you too can look far beyond normal boundaries. Show them that in your mind the sky is certainly not the limit. Use our Process and Flows PowerPoint Templates because business ethics is an essential element in your growth.Use these PowerPoint slides for presentations relating to Arrow, Business, Chart, Circular, Concept, Diagram, Informative, Internet, Market, Marketing, Member, Performance, Process, Profit, Profitable, Project, Refer, Referral, Referring, Revenue, Socialize, Steps, Strategy, Web, Websites. The prominent colors used in the PowerPoint template are Gray, White, Black. People tell us our seven diverging steps to perform a circular task Motion Chart PowerPoint Slides are Magnificent. People tell us our Circular PowerPoint templates and PPT Slides are Delightful. The feedback we get is that our seven diverging steps to perform a circular task Motion Chart PowerPoint Slides are effectively colour coded to prioritise your plans They automatically highlight the sequence of events you desire. Presenters tell us our Circular PowerPoint templates and PPT Slides are Festive. Customers tell us our seven diverging steps to perform a circular task Motion Chart PowerPoint Slides are Clever. The feedback we get is that our Internet PowerPoint templates and PPT Slides are aesthetically designed to attract attention. We guarantee that they will grab all the eyeballs you need. Your ideas will flower with our Seven Diverging Steps To Perform A Circular Task Motion Chart PowerPoint Slides. Your brilliance will begin to bloom.
Business Graph With Pie Chart Marketing PowerPoint Templates Ppt Backgrounds For Slides 0513
Establish your dominion with our Business Graph With Pie Chart Marketing PowerPoint Templates PPT Backgrounds For Slides. Rule the stage with your thoughts. Your ideas demand attention. Our Marketing PowerPoint Templates will get it done. Your listeners will never doodle. Our Pie charts PowerPoint Templates PowerPoint Templates will hold their concentration. Get enthusiastic with our Business Graph With Pie Chart Marketing PowerPoint Templates Ppt Backgrounds For Slides 0513. Encourage your team to better performances.

Pie Chart Displays More Income Business Growth PowerPoint Templates Ppt Backgrounds For Slides 0513
Draw ahead of others with our Pie Chart Displays More Income Business Growth PowerPoint Templates PPT Backgrounds For Slides. Cross the line and win the race. Draw out the best in you with our Pie charts PowerPoint Templates. Let your inner brilliance come to the surface. Draw out the talents of your team. Use our Finance PowerPoint Templates to give them an incentive. Create an absorbing atmosphere with our Pie Chart Displays More Income Business Growth PowerPoint Templates Ppt Backgrounds For Slides 0513. Ensure your audience remains attentive.


 Continue with Email

 Home
Home


