Revenue Dashboard
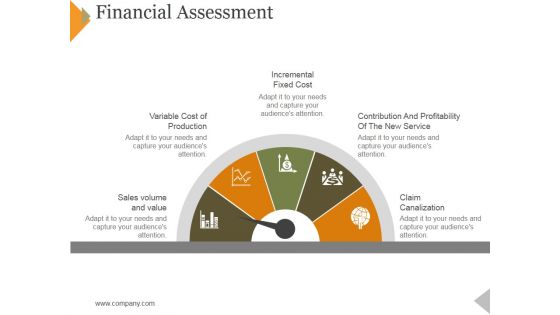
Financial Assessment Ppt PowerPoint Presentation Infographic Template Graphics Pictures
This is a financial assessment ppt powerpoint presentation infographic template graphics pictures. This is a five stage process. The stages in this process are incremental fixed cost, variable cost of production, volume and value, claim canalization.
Our Key Metrics Ppt PowerPoint Presentation Icon Slide
This is a our key metrics ppt powerpoint presentation icon slide. This is a five stage process. The stages in this process are cash flow, turnover, productivity, net income, customer satisfaction .
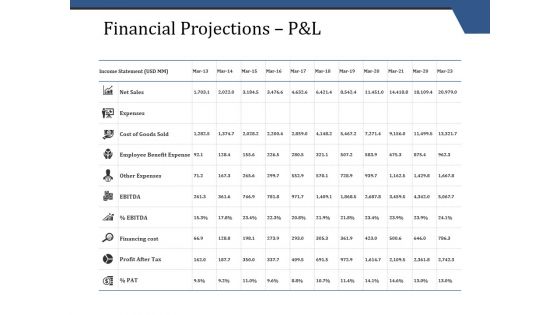
Financial Projections P And L Template 1 Ppt PowerPoint Presentation Portfolio Layouts
This is a financial projections p and l template 1 ppt powerpoint presentation portfolio layouts. This is a three stage process. The stages in this process are financial, marketing, investment, analysis, business.
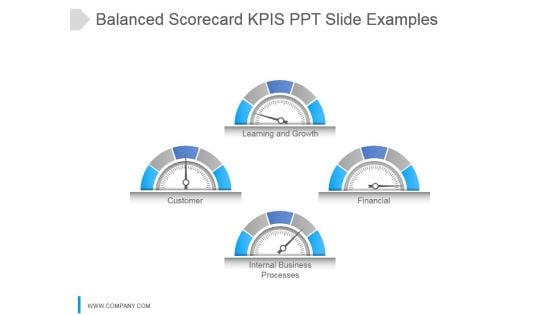
Balanced Scorecard Kpi S Ppt Slide Examples
This is a balanced scorecard kpi s ppt slide examples. This is a four stage process. The stages in this process are learning and growth, customer, financial, internal business processes.
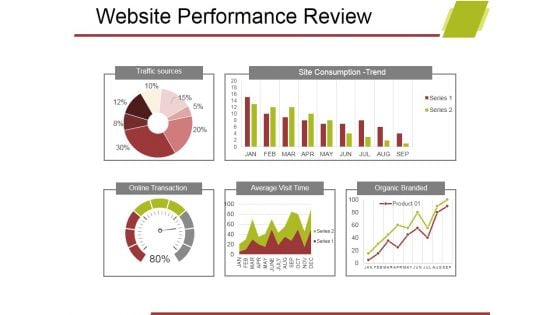
Website Performance Review Template 1 Ppt PowerPoint Presentation Portfolio Master Slide
This is a website performance review template 1 ppt powerpoint presentation portfolio master slide. This is a five stage process. The stages in this process are traffic sources, site consumption trend, online transaction, average visit time, organic branded.
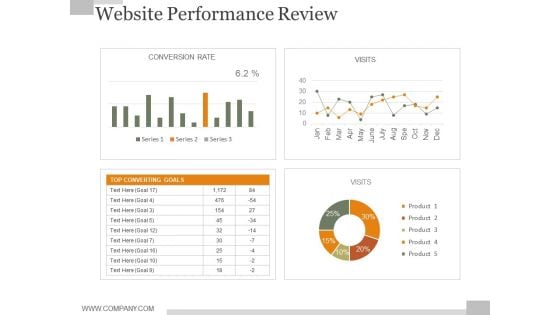
Website Performance Review Slide Ppt PowerPoint Presentation Example 2015
This is a website performance review slide ppt powerpoint presentation example 2015. This is a four stage process. The stages in this process are traffic source, online transaction, conversion rate, average visit time.
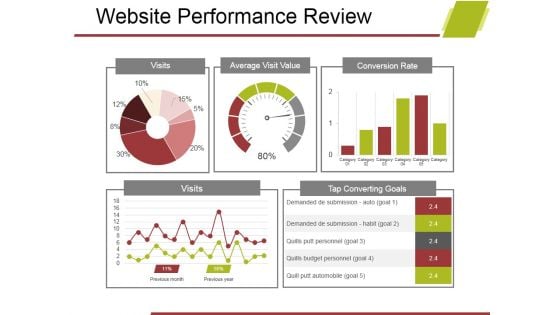
Website Performance Review Template 2 Ppt PowerPoint Presentation Model File Formats
This is a website performance review template 2 ppt powerpoint presentation model file formats. This is a five stage process. The stages in this process are visits, average visit value, conversion rate, visits, tap converting goals.
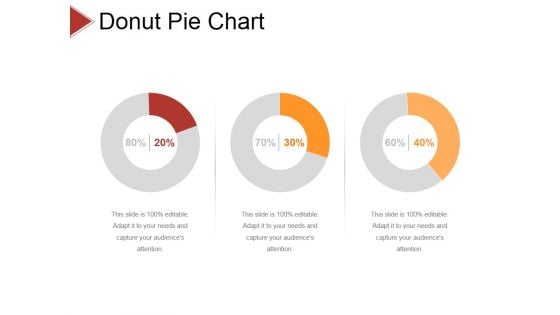
Donut Pie Chart Ppt PowerPoint Presentation Infographic Template Diagrams
This is a donut pie chart ppt powerpoint presentation infographic template diagrams. This is a three stage process. The stages in this process are business, strategy, analysis, pretention, comparison.
Enterprise Analysis Customer Satisfaction Ppt Icon Backgrounds PDF
This is a enterprise analysis customer satisfaction ppt icon backgrounds pdf template with various stages. Focus and dispense information on three stages using this creative set, that comes with editable features. It contains large content boxes to add your information on topics like overall satisfaction with service, satisfaction with value for money, overall satisfaction with relationship. You can also showcase facts, figures, and other relevant content using this PPT layout. Grab it now.
Deal Assessment Audit Process Customer Satisfaction Icons PDF
Presenting deal assessment audit process customer satisfaction icons pdf to provide visual cues and insights. Share and navigate important information on three stages that need your due attention. This template can be used to pitch topics like overall satisfaction with service, satisfaction with value for money, overall satisfaction with relationship. In addition, this PPT design contains high-resolution images, graphics, etc, that are easily editable and available for immediate download.

Digital Enterprise Management Content Ppt PowerPoint Presentation Layouts Graphics Design PDF
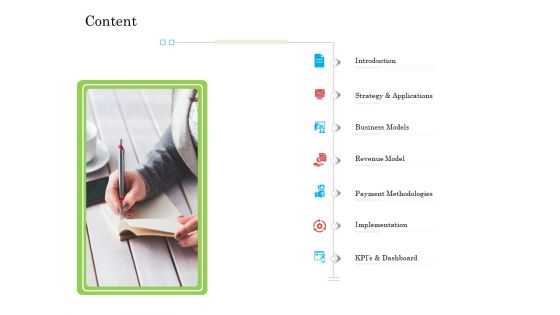
Presenting digital enterprise management content ppt powerpoint presentation layouts graphics design pdf to provide visual cues and insights. Share and navigate important information on seven stages that need your due attention. This template can be used to pitch topics like introduction, strategy and applications, business models, revenue model, payment methodologies, implementation, kpis and dashboard. In addition, this PPT design contains high-resolution images, graphics, etc, that are easily editable and available for immediate download.
Online Business Program Content Ppt Pictures Graphics PDF
Presenting online business program content ppt pictures graphics pdf to provide visual cues and insights. Share and navigate important information on seven stages that need your due attention. This template can be used to pitch topics like business models, revenue model, payment methodologies, strategy and applications, dashboard. In addition, this PPT design contains high-resolution images, graphics, etc, that are easily editable and available for immediate download.
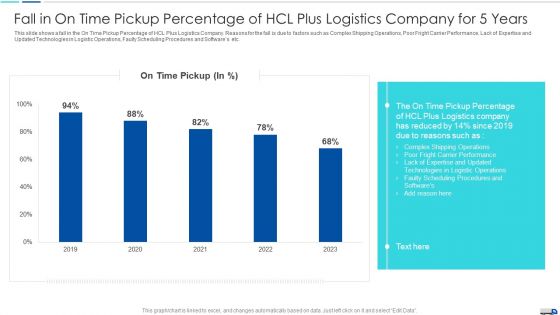
Initiatives To Produce Effective Concept For Logistic Firm Logistics And Supply Chain Brochure PDF
The slide shows a Logistics and Supply Chain Dashboard for HCL Plus Logistics showing total revenue and costs, fleet efficiency status, delivery status, average delivery time, total shipments, average loading time, average loading weight etc. Deliver an awe inspiring pitch with this creative initiatives to produce effective concept for logistic firm logistics and supply chain brochure pdf bundle. Topics like revenue, costs, profit can be discussed with this completely editable template. It is available for immediate download depending on the needs and requirements of the user.

Incremental Sales Kpi Measures Presentation Backgrounds
This is a incremental sales kpi measures presentation backgrounds. This is a four stage process. The stages in this process are marketing, promotion, sales revenue, social channels.
Kpi Tracking Software Services Ppt Powerpoint Graphics
This is a kpi tracking software services ppt powerpoint graphics. This is a three stage process. The stages in this process are operations, revenue, manufacturing.
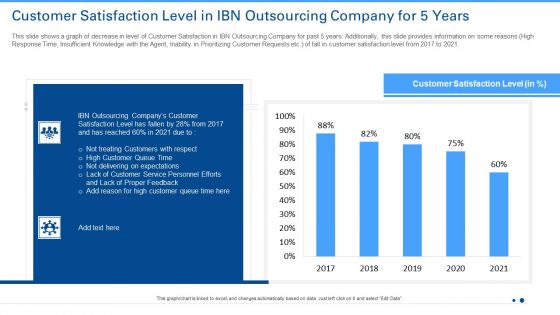
Customer Satisfaction Level In IBN Outsourcing Company For 5 Years Ppt Show Ideas PDF
This slide shows a Customer Attrition Rate Dashboard with KPIs such as Company Revenue , Customer Attrition Rate in 2021 , Annual Growth Rate , Average Customer Queue Time , Onboarding Process Effectiveness etc.Deliver and pitch your topic in the best possible manner with this customer satisfaction level in ibn outsourcing company for 5 years ppt show ideas pdf. Use them to share invaluable insights on customer satisfaction level, 2017 to 2021 and impress your audience. This template can be altered and modified as per your expectations. So, grab it now.
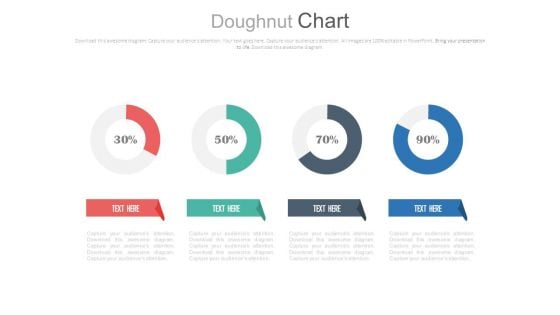
Four Circle Chart With Percentage Ratios Powerpoint Slides
This PowerPoint template has been designed with graphics of four circles and percentage ratios. You may use this dashboard slide design for topics like profit growth and financial planning. This PPT slide is powerful tool to describe your ideas.
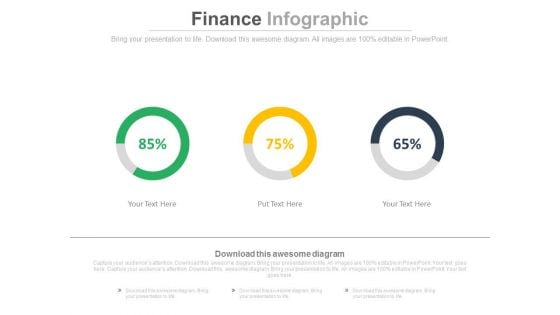
Linear Circles Percentage Analysis Charts Powerpoint Slides
This PowerPoint template has been designed with graphics of three circles and percentage ratios. You may use this dashboard slide design for topics like profit growth and financial planning. This PPT slide is powerful tool to describe your ideas.
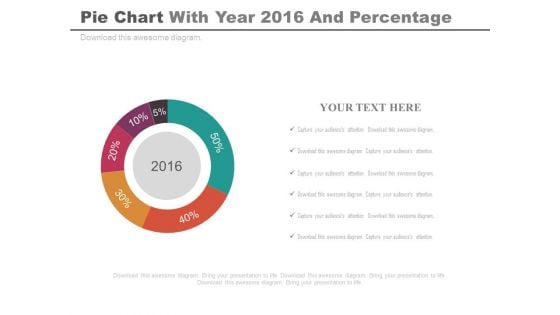
Pie Chart For Projected Profit Of 2016 Powerpoint Slides
Our above PPT slide displays graphics of Pie chart. This PowerPoint template may be used to display projected profit report of 2016. Download this template to leave permanent impression on your audience.
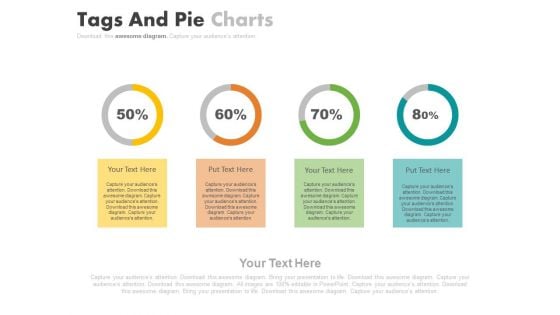
Four Steps For Financial Data Analysis Powerpoint Slides
This PowerPoint contains four circles with percentage values. Download this diagram slide to display financial data analysis. This template is editable, You can edit text, color, shade and style of this diagram as per you need.
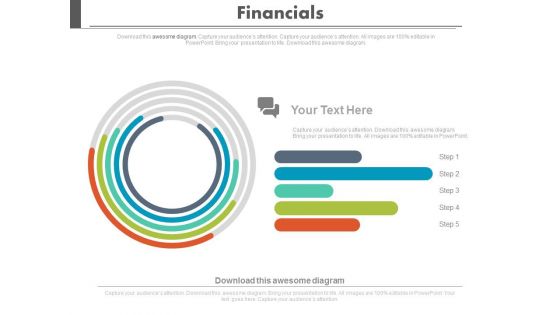
Financial Growth Analysis Circular Chart Powerpoint Slides
Visually support your presentation with our above template containing graphics of circular chart. This diagram slide helps to display financial growth analysis. Etch your views in the brains of your audience with this diagram slide.
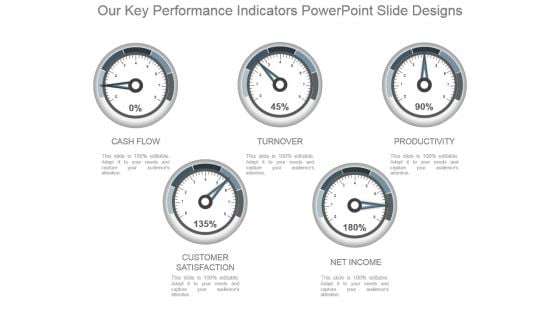
Our Key Performance Indicators Powerpoint Slide Designs
This is a our key performance indicators powerpoint slide designs. This is a five stage process. The stages in this process are cash flow, turnover, productivity, customer satisfaction, net income.
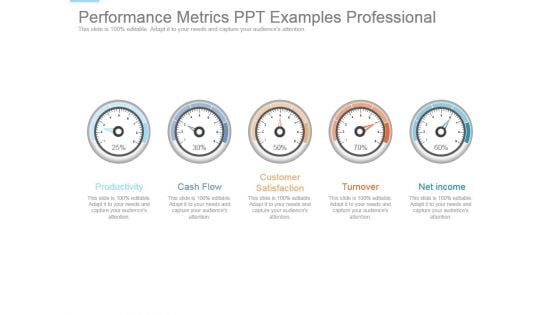
Performance Metrics Ppt Examples Professional
This is a performance metrics ppt examples professional. This is a five stage process. The stages in this process are productivity, cash flow, customer satisfaction, turnover, net income.
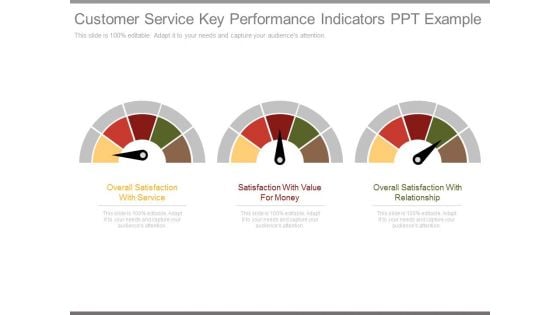
Customer Service Key Performance Indicators Ppt Example
This is a customer service key performance indicators ppt example. This is a three stage process. The stages in this process are overall satisfaction with service, satisfaction with value for money, overall satisfaction with relationship.
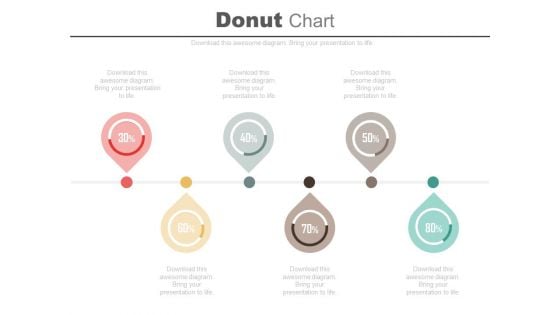
Six Pointers Percentage Timeline Diagram Powerpoint Slides
Profitability indicator ratios have been displayed this business slide. This PowerPoint template contains linear pointers timeline diagram. Use this professional diagram slide to build an exclusive presentation.
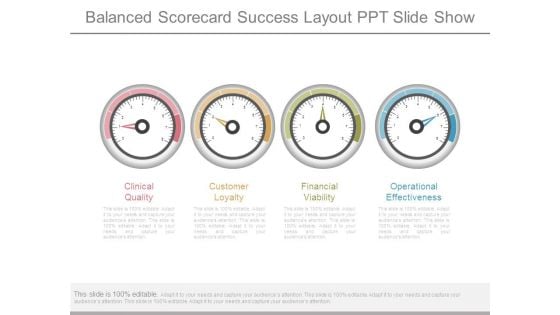
Balanced Scorecard Success Layout Ppt Slide Show
This is a balanced scorecard success layout ppt slide show. This is a four stage process. The stages in this process are clinical quality, customer loyalty, financial viability, operational effectiveness.
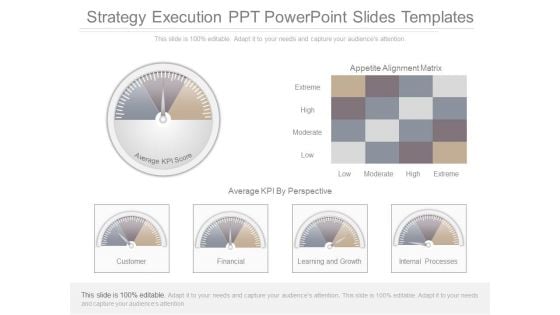
Strategy Execution Ppt Powerpoint Slides Templates
This is a strategy execution ppt powerpoint slides templates. This is a six stage process. The stages in this process are appetite alignment matrix, extreme, high, moderate, low, average kpi by prospective, customer, financial, learning and growth, internal processes, average kpi score.
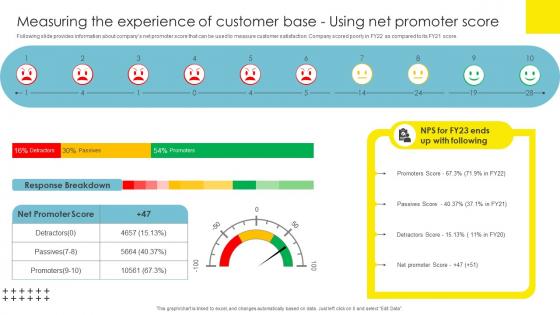
Measuring The Experience Of Strategic Brand Management Themes Pdf
Following slide provides information about companys net promoter score that can be used to measure customer satisfaction. Company scored poorly in FY22 as compared to its FY21 score. Make sure to capture your audiences attention in your business displays with our gratis customizable Measuring The Experience Of Strategic Brand Management Themes Pdf. These are great for business strategies, office conferences, capital raising or task suggestions. If you desire to acquire more customers for your tech business and ensure they stay satisfied, create your own sales presentation with these plain slides. Following slide provides information about companys net promoter score that can be used to measure customer satisfaction. Company scored poorly in FY22 as compared to its FY21 score.
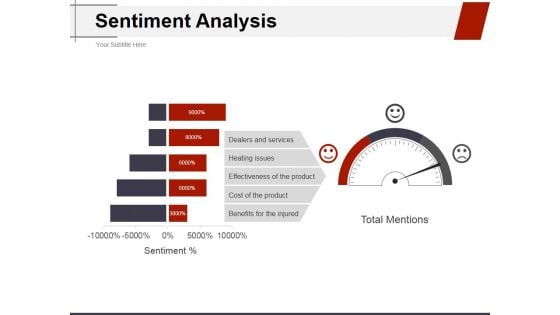
Sentiment Analysis Ppt PowerPoint Presentation Ideas Structure
This is a sentiment analysis ppt powerpoint presentation ideas structure. This is a three stage process. The stages in this process are dealers and services, heating issues, effectiveness of the product, cost of the product, benefits for the injured.
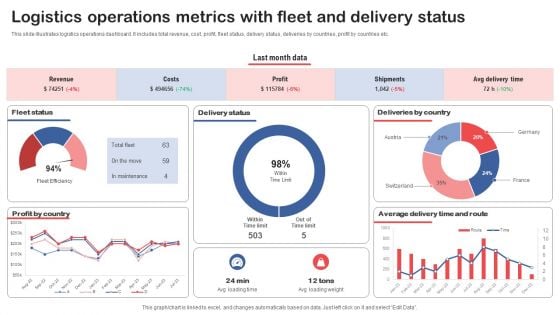
Logistics Operations Metrics With Fleet And Delivery Status Slides PDF
This slide illustrates logistics operations dashboard. It includes total revenue, cost, profit, fleet status, delivery status, deliveries by countries, profit by countries etc. Pitch your topic with ease and precision using this Logistics Operations Metrics With Fleet And Delivery Status Slides PDF. This layout presents information on Fleet Status, Delivery Status, Deliveries By Country. It is also available for immediate download and adjustment. So, changes can be made in the color, design, graphics or any other component to create a unique layout.
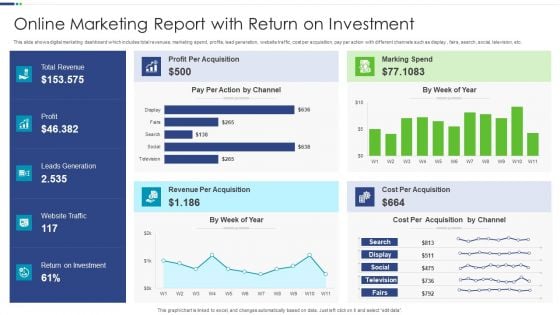
Online Marketing Report With Return On Investment Inspiration PDF
This slide shows digital marketing dashboard which includes total revenues, marketing spend, profits, lead generation, website traffic, cost per acquisition, pay per action with different channels such as display , fairs, search, social, television, etc.Showcasing this set of slides titled Online Marketing Report With Return On Investment Inspiration PDF The topics addressed in these templates are Leads Generation, Cost Acquisition, Return Investment All the content presented in this PPT design is completely editable. Download it and make adjustments in color, background, font etc. as per your unique business setting.
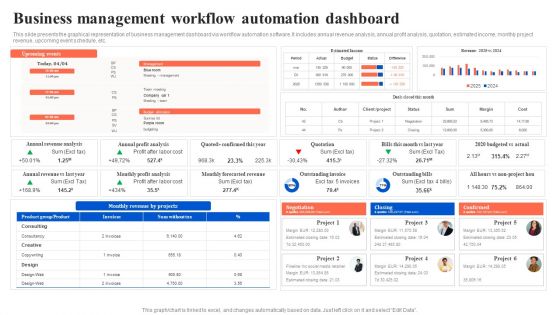
Workflow Automation For Optimizing Organizational Processes Business Management Workflow Infographics PDF
This slide presents the graphical representation of business management dashboard via workflow automation software. It includes annual revenue analysis, annual profit analysis, quotation, estimated income, monthly project revenue, upcoming event schedule, etc. Here you can discover an assortment of the finest PowerPoint and Google Slides templates. With these templates, you can create presentations for a variety of purposes while simultaneously providing your audience with an eye catching visual experience. Download Workflow Automation For Optimizing Organizational Processes Business Management Workflow Infographics PDF to deliver an impeccable presentation. These templates will make your job of preparing presentations much quicker, yet still, maintain a high level of quality. Slidegeeks has experienced researchers who prepare these templates and write high quality content for you. Later on, you can personalize the content by editing the Workflow Automation For Optimizing Organizational Processes Business Management Workflow Infographics PDF.
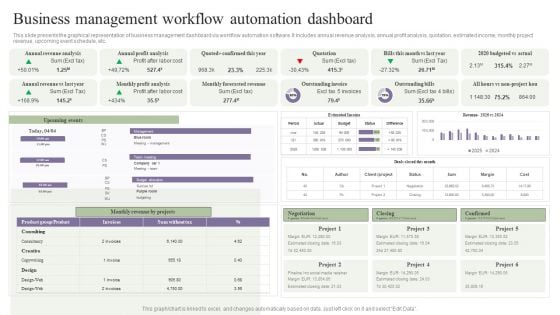
Deployment Of Process Automation To Increase Organisational Performance Business Management Workflow Themes PDF
This slide presents the graphical representation of business management dashboard via workflow automation software. It includes annual revenue analysis, annual profit analysis, quotation, estimated income, monthly project revenue, upcoming event schedule, etc. Presenting this PowerPoint presentation, titled Deployment Of Process Automation To Increase Organisational Performance Business Management Workflow Themes PDF, with topics curated by our researchers after extensive research. This editable presentation is available for immediate download and provides attractive features when used. Download now and captivate your audience. Presenting this Deployment Of Process Automation To Increase Organisational Performance Business Management Workflow Themes PDF. Our researchers have carefully researched and created these slides with all aspects taken into consideration. This is a completely customizable Deployment Of Process Automation To Increase Organisational Performance Business Management Workflow Themes PDF that is available for immediate downloading. Download now and make an impact on your audience. Highlight the attractive features available with our PPTs.
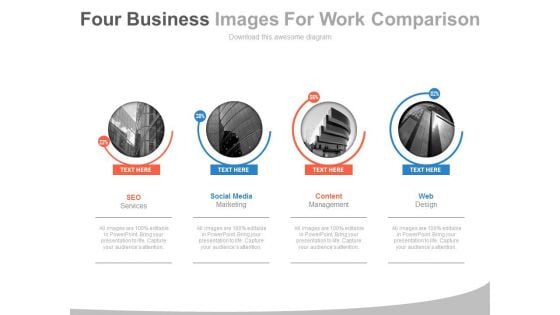
Four Companies With Web Services Powerpoint Slides
This PowerPoint template display graphics of four corporate buildings. You may use this PPT slide for financial and strategic analysis for web services companies. This dashboard slide may useful for multilevel status report creation and approval process.
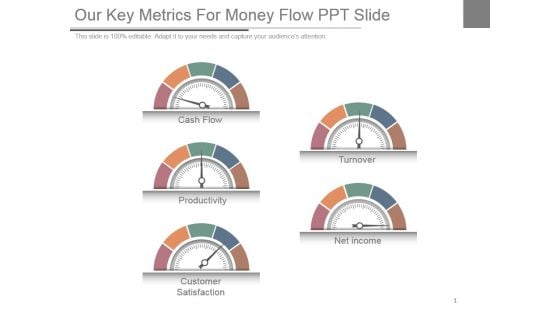
Our Key Metrics For Money Flow Ppt Slide
This is a our key metrics for money flow ppt slide. This is a five stage process. The stages in this process are cash flow, productivity, customer satisfaction, turnover, net income.
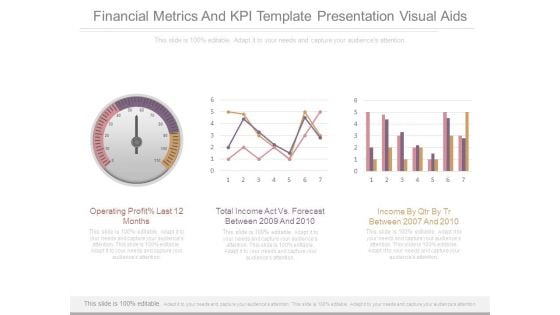
Financial Metrics And Kpi Template Presentation Visual Aids
This is a financial metrics and kpi template presentation visual aids. This is a three stage process. The stages in this process are operating profit last 12 months, total income act vs forecast between 2009 and 2010, income by qtr by tr between 2007 and 2010.
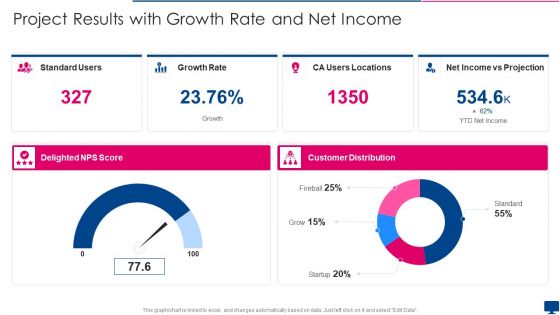
Project Results With Growth Rate And Net Income Inspiration PDF
Showcasing this set of slides titled project results with growth rate and net income inspiration pdf. The topics addressed in these templates are standard users, growth rate, ca users locations, net income, projection. All the content presented in this PPT design is completely editable. Download it and make adjustments in color, background, font etc. as per your unique business setting.
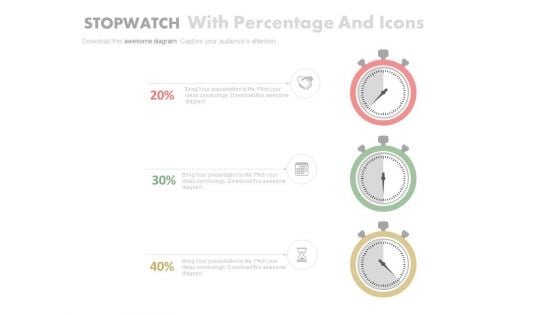
Three Stopwatches To Display Profit Trends Powerpoint Slides
This PowerPoint template has been designed with graphics of three stopwatches. Use this PPT slide to depict profit trends. Download this template to make impressive presentations.

Picture Of Working Overtime To Improve Income Ppt PowerPoint Presentation File Graphic Tips PDF
Presenting picture of working overtime to improve income ppt powerpoint presentation file graphic tips pdf to dispense important information. This template comprises three stages. It also presents valuable insights into the topics including picture of working overtime to improve income. This is a completely customizable PowerPoint theme that can be put to use immediately. So, download it and address the topic impactfully.
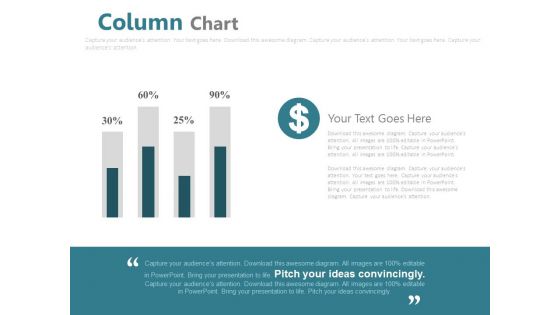
Column Chart For Financial Analysis Powerpoint Slides
This PowerPoint template has been designed with graphics of column chart with percentage values. You may use this business slide design for topics like financial analysis and planning. This PPT slide is powerful tool to describe your ideas.
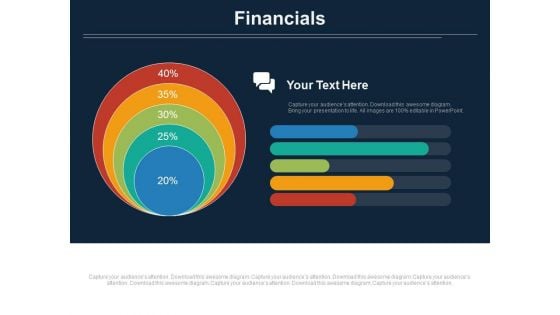
Concentric Chart With Five Financial Steps Powerpoint Slides
This PowerPoint slide contains diagram of concentric chart with five financial steps This professional slide helps to exhibit financial planning for business. Use this PowerPoint template to make impressive presentations.
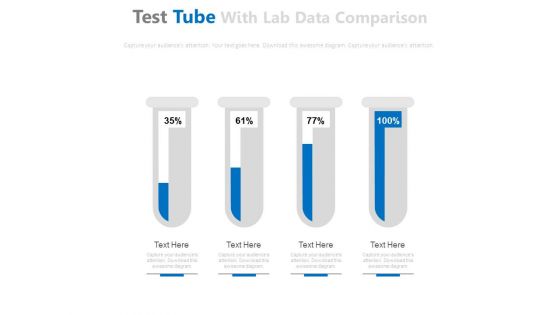
Test Tubes For Financial Ratio Analysis Powerpoint Slides
This PowerPoint template has been designed with graphics of test tubes. Use this PPT slide to depict financial ratio analysis. Download this PPT template to make impressive presentations.
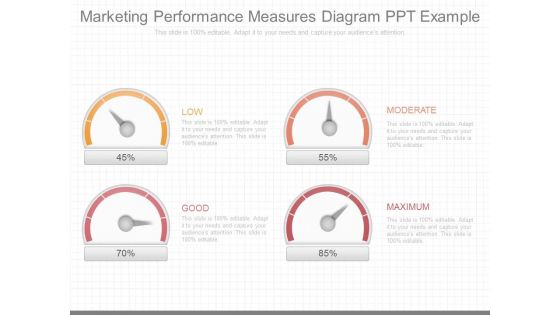
Marketing Performance Measures Diagram Ppt Example
This is a marketing performance measures diagram ppt example. This is a four stage process. The stages in this process are low, moderate, good, maximum.
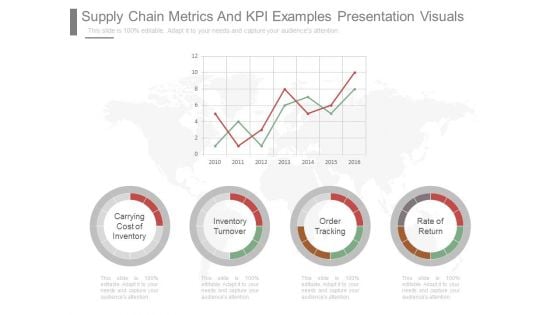
Supply Chain Metrics And Kpi Examples Presentation Visuals
This is a supply chain metrics and kpi examples presentation visuals. This is a four stage process. The stages in this process are carrying cost of inventory, inventory turnover, order tracking, rate of return.
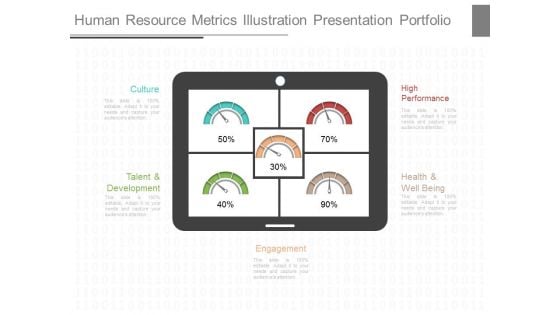
Human Resource Metrics Illustration Presentation Portfolio
This is a human resource metrics illustration presentation portfolio. This is a five stage process. The stages in this process are culture, high performance, talent and development, health and well being, engagement.
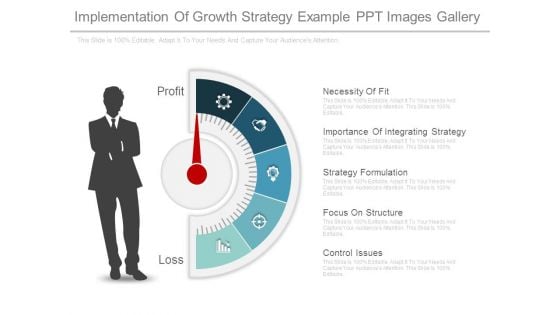
Implementation Of Growth Strategy Example Ppt Images Gallery
This is a implementation of growth strategy example ppt images gallery. This is a five stage process. The stages in this process are necessity of fit , importance of integrating strategy, strategy formulation, focus on structure, control issues, loss, profit.
Four Circles With Percentage Values And Icons Powerpoint Slides
This PowerPoint template displays info graphic diagram of linear circles. This diagram may be used to exhibit financial growth and analysis. Grab center stage with this slide and capture the attention of your audience.
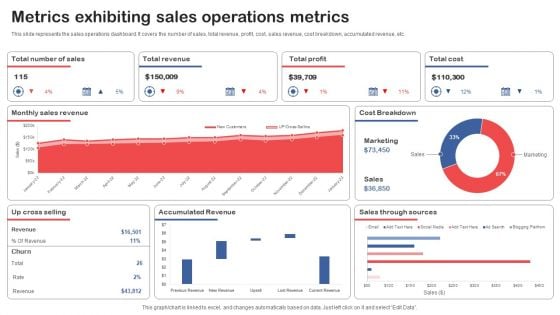
Metrics Exhibiting Sales Operations Metrics Topics PDF
This slide represents the sales operations dashboard. It covers the number of sales, total revenue, profit, cost, sales revenue, cost breakdown, accumulated revenue, etc. Showcasing this set of slides titled Metrics Exhibiting Sales Operations Metrics Topics PDF. The topics addressed in these templates are Total Revenue, Total Profit, Total Cost. All the content presented in this PPT design is completely editable. Download it and make adjustments in color, background, font etc. as per your unique business setting.
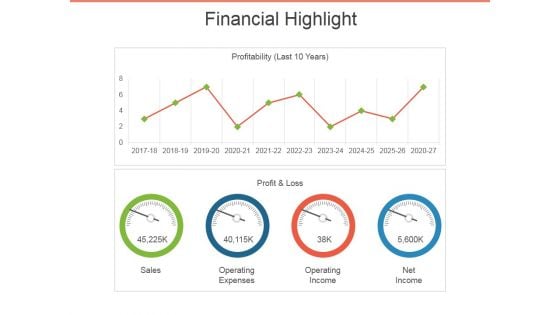
Financial Highlight Template 2 Ppt PowerPoint Presentation Outline Visuals
This is a financial highlight template 2 ppt powerpoint presentation outline visuals. This is a two stage process. The stages in this process are sales, profit and loss, operating expenses, operating income, net income.
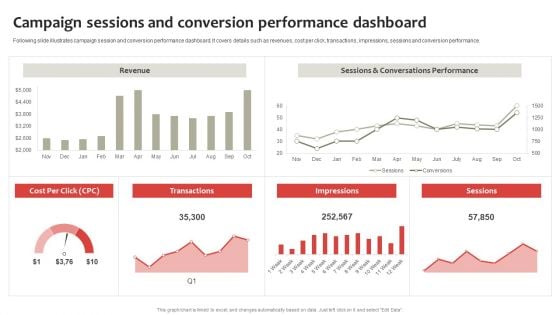
Strategic Plan To Establish And Promote Brand Awareness Campaign Sessions And Conversion Structure PDF
Following slide illustrates campaign session and conversion performance dashboard. It covers details such as revenues, cost per click, transactions, impressions, sessions and conversion performance. Find a pre designed and impeccable Strategic Plan To Establish And Promote Brand Awareness Campaign Sessions And Conversion Structure PDF. The templates can ace your presentation without additional effort. You can download these easy to edit presentation templates to make your presentation stand out from others. So, what are you waiting for Download the template from Slidegeeks today and give a unique touch to your presentation.
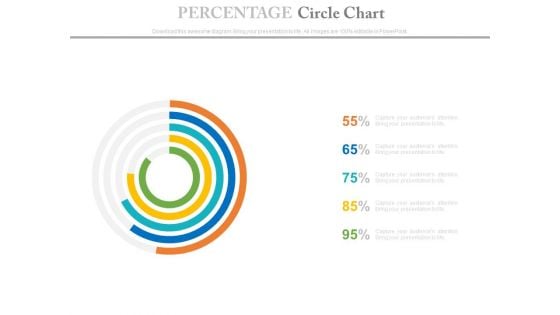
Percentage Data Circle Chart Powerpoint Slides
This PowerPoint template has been designed with circle chart. Download this PPT chart to depict financial ratio analysis. This PowerPoint slide is of great help in the business sector to make realistic presentations and provides effective way of presenting your newer thoughts.
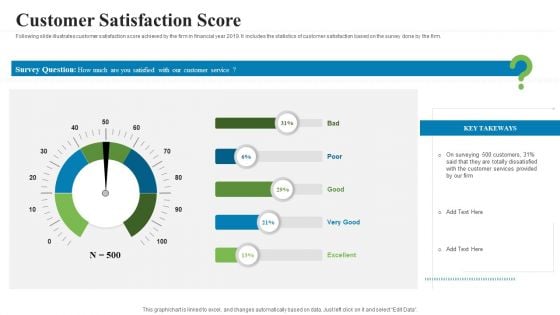
Creating Successful Advertising Campaign Customer Satisfaction Score Graphics PDF
Following slide illustrates customer satisfaction score achieved by the firm in financial year 2019. It includes the statistics of customer satisfaction based on the survey done by the firm. Deliver an awe inspiring pitch with this creative creating successful advertising campaign customer satisfaction score graphics pdf bundle. Topics like customer satisfaction score can be discussed with this completely editable template. It is available for immediate download depending on the needs and requirements of the user.
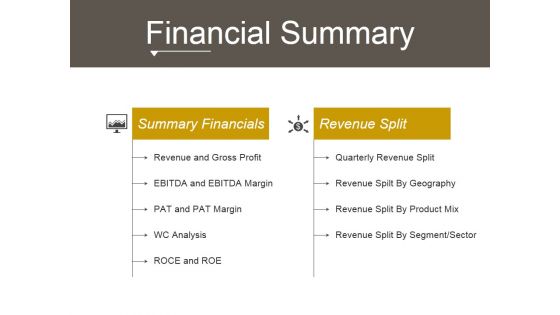
Financial Summary Ppt PowerPoint Presentation Information
This is a financial summary ppt powerpoint presentation information. This is a two stage process. The stages in this process are revenue and gross profit, quarterly revenue split, revenue spilt by geography, revenue split by product mix, revenue split by segment sector.
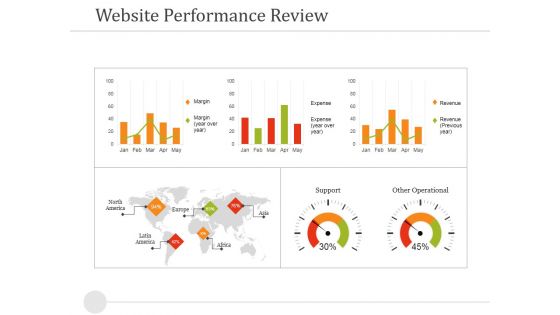
Website Performance Review Template 2 Ppt PowerPoint Presentation Gallery Objects
This is a website performance review template 2 ppt powerpoint presentation gallery objects. This is a three stage process. The stages in this process are margin, revenue, expense, support, other operational.
Monthly Sales Performance Tracking And Implementing Strategies To Improve Template Pdf
This slide showcases a dashboard presenting various metrics to measure and analyze sales performance for revenue growth. It includes key components such as number of sales, revenue, profit, cost, sales revenue, sales increment, cost analysis and cross sell.This Monthly Sales Performance Tracking And Implementing Strategies To Improve Template Pdf is perfect for any presentation, be it in front of clients or colleagues. It is a versatile and stylish solution for organizing your meetings. The product name features a modern design for your presentation meetings. The adjustable and customizable slides provide unlimited possibilities for acing up your presentation. Slidegeeks has done all the homework before launching the product for you. So, do not wait, grab the presentation templates today This slide showcases a dashboard presenting various metrics to measure and analyze sales performance for revenue growth. It includes key components such as number of sales, revenue, profit, cost, sales revenue, sales increment, cost analysis and cross sell.
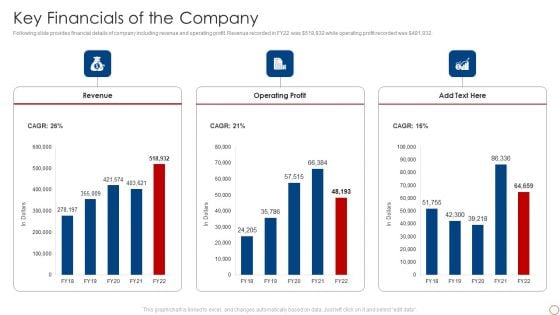
Kpis For Evaluating Business Sustainability Key Financials Of The Company Rules PDF
Following slide provides financial details of company including revenue and operating profit. Revenue recorded in FY22 was dollar 518,932 while operating profit recorded was dollar 481,932. Deliver and pitch your topic in the best possible manner with this Kpis For Evaluating Business Sustainability Financial Performance Indicator Dashboard Demonstration PDF. Use them to share invaluable insights on Revenue, Operating Profit and impress your audience. This template can be altered and modified as per your expectations. So, grab it now.
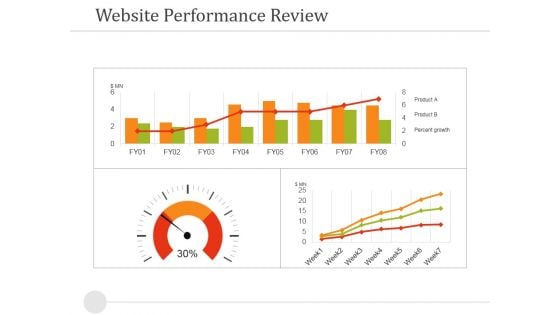
Website Performance Review Template 1 Ppt PowerPoint Presentation Portfolio Guide
This is a website performance review template 1 ppt powerpoint presentation portfolio guide. This is a four stage process. The stages in this process are website performance review, dashboard, business, marketing, finance.
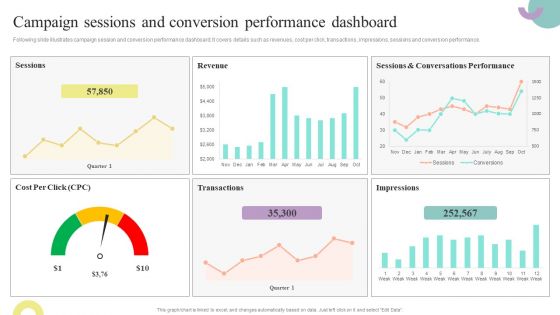
Comprehensive Guide To Enhance Campaign Sessions And Conversion Performance Portrait PDF
Following slide illustrates campaign session and conversion performance dashboard. It covers details such as revenues, cost per click, transactions, impressions, sessions and conversion performance. Slidegeeks is here to make your presentations a breeze with Comprehensive Guide To Enhance Campaign Sessions And Conversion Performance Portrait PDF With our easy-to-use and customizable templates, you can focus on delivering your ideas rather than worrying about formatting. With a variety of designs to choose from, youre sure to find one that suits your needs. And with animations and unique photos, illustrations, and fonts, you can make your presentation pop. So whether youre giving a sales pitch or presenting to the board, make sure to check out Slidegeeks first.
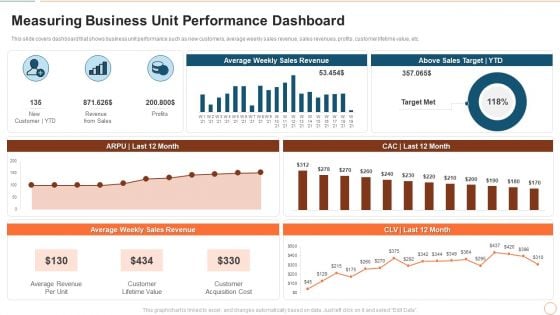
Illustrating Product Leadership Plan Incorporating Innovative Techniques Measuring Business Unit Professional PDF
This slide covers dashboard that shows business unit performance such as new customers, average weekly sales revenue, sales revenues, profits, customer lifetime value, etc. Deliver an awe inspiring pitch with this creative illustrating product leadership plan incorporating innovative techniques measuring business unit professional pdf bundle. Topics like average revenue per unit, customer lifetime value, customer acquisition cost can be discussed with this completely editable template. It is available for immediate download depending on the needs and requirements of the user.
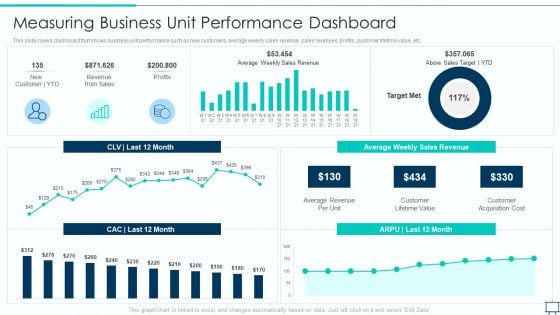
Formulating Competitive Plan Of Action For Effective Product Leadership Measuring Business Unit Slides PDF
This slide covers dashboard that shows business unit performance such as new customers, average weekly sales revenue, sales revenues, profits, customer lifetime value, etc. Deliver an awe inspiring pitch with this creative formulating competitive plan of action for effective product leadership measuring business unit slides pdf bundle. Topics like average revenue per unit, customer lifetime value, customer acquisition cost can be discussed with this completely editable template. It is available for immediate download depending on the needs and requirements of the user.


 Continue with Email

 Home
Home


