Revenue Dashboard
Social Media Customer Service Digital Signage In Internal Communication Channels Template Pdf
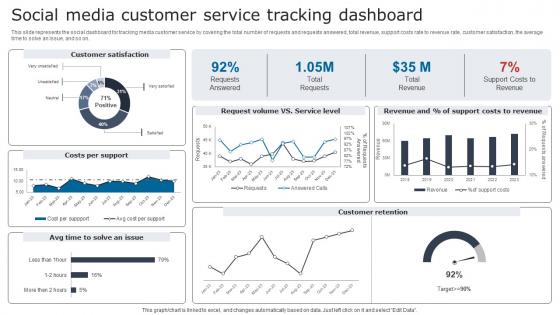
This slide represents the social dashboard for tracking media customer service by covering the total number of requests and requests answered, total revenue, support costs rate to revenue rate, customer satisfaction, the average time to solve an issue, and so on. If your project calls for a presentation, then Slidegeeks is your go to partner because we have professionally designed, easy to edit templates that are perfect for any presentation. After downloading, you can easily edit Social Media Customer Service Digital Signage In Internal Communication Channels Template Pdf and make the changes accordingly. You can rearrange slides or fill them with different images. Check out all the handy templates This slide represents the social dashboard for tracking media customer service by covering the total number of requests and requests answered, total revenue, support costs rate to revenue rate, customer satisfaction, the average time to solve an issue, and so on.
Product Line Market Performance Implementing Product Diversification PPT Sample Strategy SS V
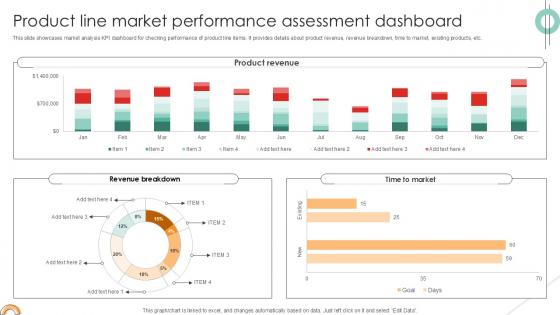
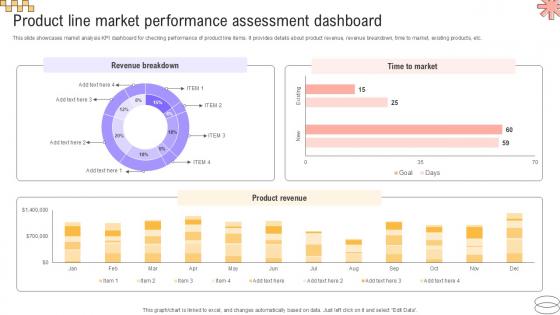
This slide showcases market analysis KPI dashboard for checking performance of product line items. It provides details about product revenue, revenue breakdown, time to market, existing products, etc. Do you know about Slidesgeeks Product Line Market Performance Implementing Product Diversification PPT Sample Strategy SS V. These are perfect for delivering any kind od presentation. Using it, create PowerPoint presentations that communicate your ideas and engage audiences. Save time and effort by using our pre-designed presentation templates that are perfect for a wide range of topic. Our vast selection of designs covers a range of styles, from creative to business, and are all highly customizable and easy to edit. Download as a PowerPoint template or use them as Google Slides themes. This slide showcases market analysis KPI dashboard for checking performance of product line items. It provides details about product revenue, revenue breakdown, time to market, existing products, etc.
Product Line Market Performance Implementing Geographic Extension PPT Slide Strategy SS V
This slide showcases market analysis KPI dashboard for checking performance of product line items. It provides details about product revenue, revenue breakdown, time to market, existing products, etc. Take your projects to the next level with our ultimate collection of Product Line Market Performance Implementing Geographic Extension PPT Slide Strategy SS V. Slidegeeks has designed a range of layouts that are perfect for representing task or activity duration, keeping track of all your deadlines at a glance. Tailor these designs to your exact needs and give them a truly corporate look with your own brand colors they will make your projects stand out from the rest This slide showcases market analysis KPI dashboard for checking performance of product line items. It provides details about product revenue, revenue breakdown, time to market, existing products, etc.
Monthly Services Business Marketing Strategy Implementation Timeline Professional PDF
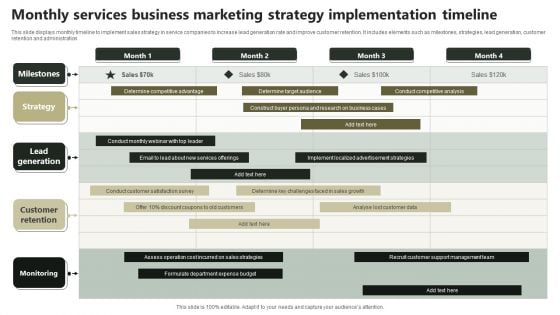
Following slide demonstrates dashboard for monitoring services company sales strategy impact on maximizing business profits. It includes elements such as number of sales, revenue, profit, cost, monthly sales revenue, cost breakdown, up and cross sell, revenue collected and sales by communication channel. Showcasing this set of slides titled Monthly Services Business Marketing Strategy Implementation Timeline Professional PDF. The topics addressed in these templates are Strategy, Lead Generation, Customer Retention. All the content presented in this PPT design is completely editable. Download it and make adjustments in color, background, font etc. as per your unique business setting.
Information Technology Service Integration Post Acquisition Merger Customer Service Measuring Icons PDF
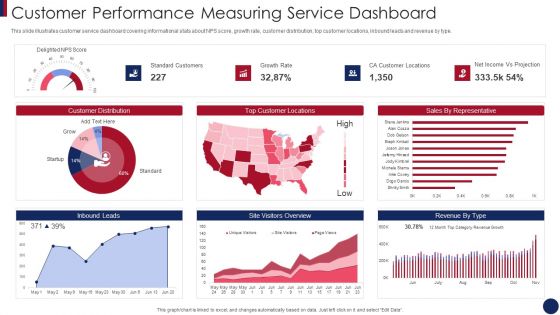
This slide illustrates customer service dashboard covering informational stats about NPS score, growth rate, customer distribution, top customer locations, inbound leads and revenue by type. Deliver an awe inspiring pitch with this creative information technology service integration post acquisition merger customer service measuring icons pdf bundle. Topics like customer service measuring kpi dashboard can be discussed with this completely editable template. It is available for immediate download depending on the needs and requirements of the user.
Post Merger Information Technology Service Delivery Amalgamation Customer Performance Measuring Themes PDF
This slide illustrates customer service dashboard covering informational stats about NPS score, growth rate, customer distribution, top customer locations, inbound leads and revenue by type. Deliver an awe inspiring pitch with this creative post merger information technology service delivery amalgamation customer performance measuring themes pdf bundle. Topics like customer performance measuring service dashboard can be discussed with this completely editable template. It is available for immediate download depending on the needs and requirements of the user.
Industry Snapshot Template 1 Ppt PowerPoint Presentation Professional Design Inspiration
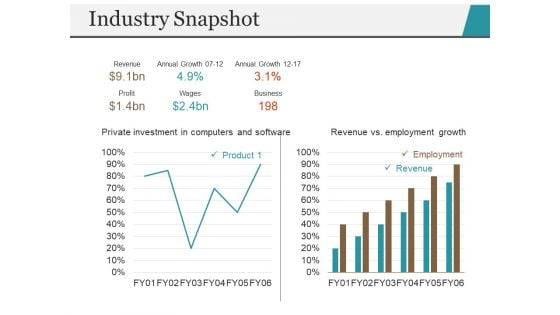
This is a industry snapshot template 1 ppt powerpoint presentation professional design inspiration. This is a two stage process. The stages in this process are revenue vs employment growth, employment, revenue, business, annual growth.
Financial Statement Ppt PowerPoint Presentation Professional Clipart
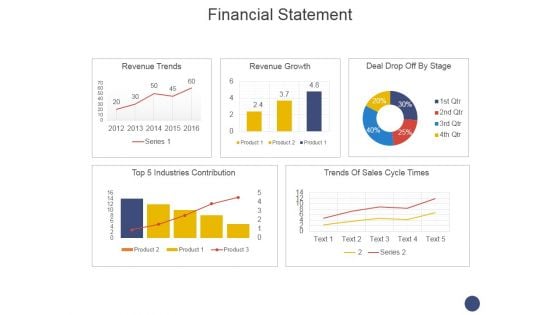
This is a financial statement ppt powerpoint presentation professional clipart. This is a five stage process. The stages in this process are revenue trends, revenue growth, deal drop off by stage, trends of sales cycle times.
Financial Statement Ppt PowerPoint Presentation Outline File Formats
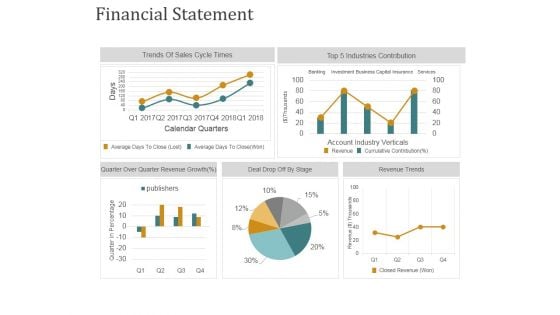
This is a financial statement ppt powerpoint presentation outline file formats. This is a five stage process. The stages in this process are trends of sales cycle times, quarter over quarter revenue growth, revenue trends, deal drop off by stage.
Essentials Of Statistics For Business And Economics Ppt Powerpoint Presentation Pictures Styles
This is a essentials of statistics for business and economics ppt powerpoint presentation pictures styles. This is a three stage process. The stages in this process are business metrics, business kpi, business dashboard.
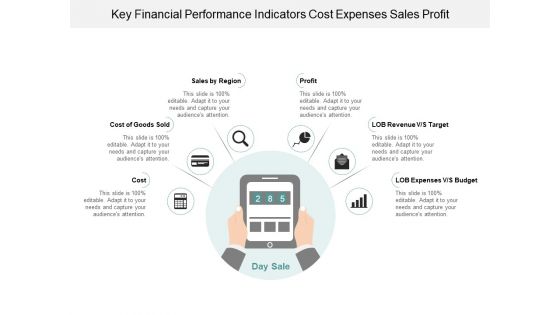
Key Financial Performance Indicators Cost Expenses Sales Profit Ppt Powerpoint Presentation Infographic Template Graphic Images
This is a key financial performance indicators cost expenses sales profit ppt powerpoint presentation infographic template graphic images. This is a six stage process. The stages in this process are dashboard, kpi, metrics.
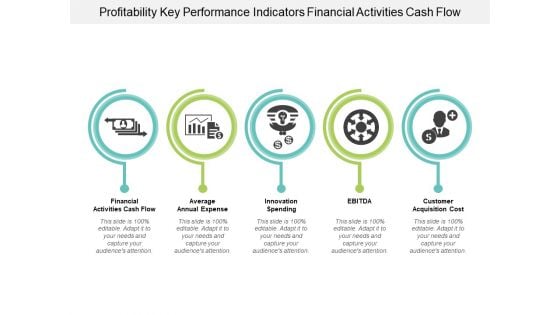
Profitability Key Performance Indicators Financial Activities Cash Flow Ppt Powerpoint Presentation Portfolio Clipart Images
This is a profitability key performance indicators financial activities cash flow ppt powerpoint presentation portfolio clipart images. This is a five stage process. The stages in this process are dashboard, kpi, metrics.
Track Business Performance And Profitability Ppt Powerpoint Presentation File Master Slide
This is a track business performance and profitability ppt powerpoint presentation file master slide. This is a four stage process. The stages in this process are business metrics, business kpi, business dashboard.
Monthly Sales Performance Tracking Sales Performance Enhancement Background Pdf
This slide showcases a dashboard presenting various metrics to measure and analyze sales performance for revenue growth. It includes key components such as number of sales, revenue, profit, cost, sales revenue, sales increment, cost analysis and cross sell. Coming up with a presentation necessitates that the majority of the effort goes into the content and the message you intend to convey. The visuals of a PowerPoint presentation can only be effective if it supplements and supports the story that is being told. Keeping this in mind our experts created Monthly Sales Performance Tracking Sales Performance Enhancement Background Pdf to reduce the time that goes into designing the presentation. This way, you can concentrate on the message while our designers take care of providing you with the right template for the situation. This slide showcases a dashboard presenting various metrics to measure and analyze sales performance for revenue growth. It includes key components such as number of sales, revenue, profit, cost, sales revenue, sales increment, cost analysis and cross sell.
Performance Enhancement Plan Monthly Sales Performance Tracking And Monitoring Portrait Pdf
This slide showcases a dashboard presenting various metrics to measure and analyze sales performance for revenue growth. It includes key components such as number of sales, revenue, profit, cost, sales revenue, sales increment, cost analysis and cross sell. Coming up with a presentation necessitates that the majority of the effort goes into the content and the message you intend to convey. The visuals of a PowerPoint presentation can only be effective if it supplements and supports the story that is being told. Keeping this in mind our experts created Performance Enhancement Plan Monthly Sales Performance Tracking And Monitoring Portrait Pdf to reduce the time that goes into designing the presentation. This way, you can concentrate on the message while our designers take care of providing you with the right template for the situation. This slide showcases a dashboard presenting various metrics to measure and analyze sales performance for revenue growth. It includes key components such as number of sales, revenue, profit, cost, sales revenue, sales increment, cost analysis and cross sell.
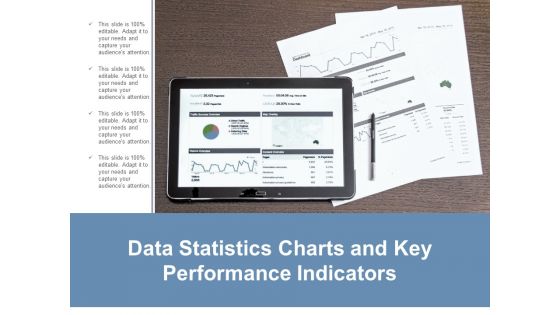
Data Statistics Charts And Key Performance Indicators Ppt Powerpoint Presentation Layouts Guide
This is a data statistics charts and key performance indicators ppt powerpoint presentation layouts guide. This is a four stage process. The stages in this process are business metrics, business kpi, business dashboard.

Bar Chart With Magnifying Glass For Financial Analysis Ppt Powerpoint Presentation Infographics Designs Download
This is a bar chart with magnifying glass for financial analysis ppt powerpoint presentation infographics designs download. This is a three stage process. The stages in this process are business metrics, business kpi, business dashboard.
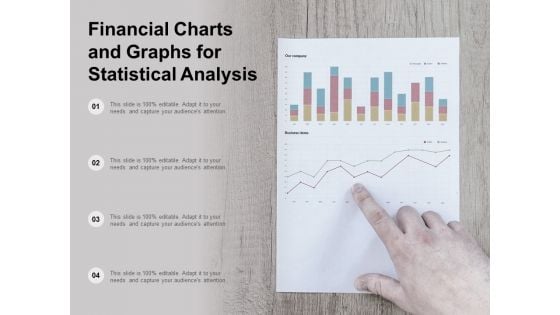
Financial Charts And Graphs For Statistical Analysis Ppt Powerpoint Presentation Show Layout
This is a financial charts and graphs for statistical analysis ppt powerpoint presentation show layout. This is a four stage process. The stages in this process are business metrics, business kpi, business dashboard.
Calculator With Business Reports For Operational Efficiency Ppt Powerpoint Presentation Ideas Infographic Template
This is a calculator with business reports for operational efficiency ppt powerpoint presentation ideas infographic template. This is a four stage process. The stages in this process are business metrics, business kpi, business dashboard.

Financial Kpis For Business Growth Liquidity Efficiency And Solvency Ppt Powerpoint Presentation Summary Gridlines
This is a financial kpis for business growth liquidity efficiency and solvency ppt powerpoint presentation summary gridlines. This is a seven stage process. The stages in this process are dashboard, kpi, metrics.
Clock With Money Bag Vector Icon Ppt PowerPoint Presentation File Outline PDF
Presenting this set of slides with name clock with money bag vector icon ppt powerpoint presentation file outline pdf. This is a three stage process. The stages in this process are clock with money bag vector icon. This is a completely editable PowerPoint presentation and is available for immediate download. Download now and impress your audience.
Time Is Money Vector Icon Ppt PowerPoint Presentation Icon Backgrounds PDF
Presenting this set of slides with name time is money vector icon ppt powerpoint presentation icon backgrounds pdf. This is a three stage process. The stages in this process are time is money vector icon. This is a completely editable PowerPoint presentation and is available for immediate download. Download now and impress your audience.
KPI Metrics Vector Icon Ppt PowerPoint Presentation Layouts Slide
This is a kpi metrics vector icon ppt powerpoint presentation layouts slide. This is a three stage process. The stages in this process are kpi proposal, kpi plan, kpi scheme.
Developing Significant Business Product And Customer Performance Tracking Clipart PDF
This slide provides information regarding dashboard utilized by firm to monitor performance of products offered and customer associated. The performance is tracked through revenues generated, new customer acquired, customer satisfaction, sales comparison, etc. Deliver and pitch your topic in the best possible manner with this Developing Significant Business Product And Customer Performance Tracking Clipart PDF. Use them to share invaluable insights on Revenue, New Customer, Revenue and impress your audience. This template can be altered and modified as per your expectations. So, grab it now.
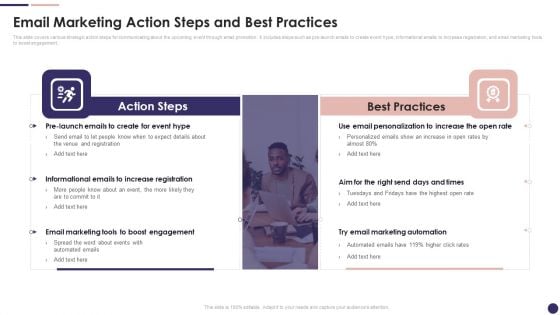
Effective Company Event Communication Plan Email Marketing Action Steps And Best Practices Information PDF
This slide covers metrics for analyzing the event revenue and registrations. It includes KPIs such as gross revenue, gross revenue from promos, total refund, total registration, visits to purchase conversion, check-in- status, etc. Deliver and pitch your topic in the best possible manner with this Effective Company Event Communication Plan Email Marketing Action Steps And Best Practices Information PDF Use them to share invaluable insights on Registration Analysis, Revenue Analysis, Gross Revenue and impress your audience. This template can be altered and modified as per your expectations. So, grab it now.
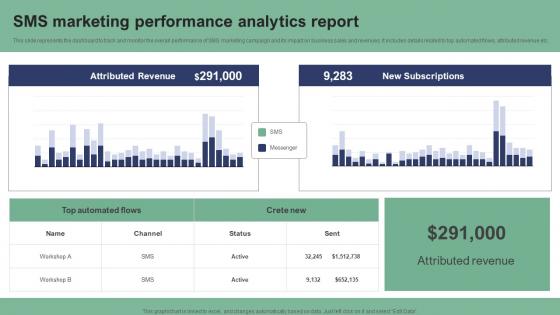
SMS Marketing Performance Analytics Report Text Message Marketing Strategies Structure Pdf
This slide represents the dashboard to track and monitor the overall performance of SMS marketing campaign and its impact on business sales and revenues. It includes details related to top automated flows, attributed revenue etc. From laying roadmaps to briefing everything in detail, our templates are perfect for you. You can set the stage with your presentation slides. All you have to do is download these easy-to-edit and customizable templates. SMS Marketing Performance Analytics Report Text Message Marketing Strategies Structure Pdf will help you deliver an outstanding performance that everyone would remember and praise you for. Do download this presentation today. This slide represents the dashboard to track and monitor the overall performance of SMS marketing campaign and its impact on business sales and revenues. It includes details related to top automated flows, attributed revenue etc.
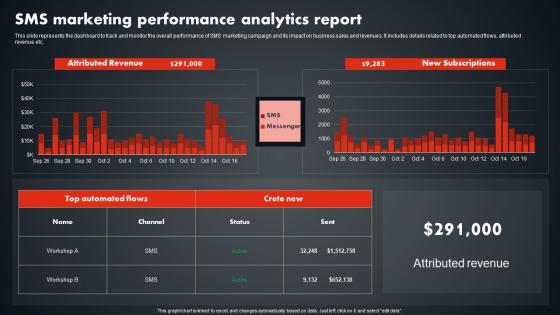
SMS Marketing Performance Analytics Report SMS Promotional Tactics Structure PDF
This slide represents the dashboard to track and monitor the overall performance of SMS marketing campaign and its impact on business sales and revenues. It includes details related to top automated flows, attributed revenue etc. From laying roadmaps to briefing everything in detail, our templates are perfect for you. You can set the stage with your presentation slides. All you have to do is download these easy-to-edit and customizable templates. SMS Marketing Performance Analytics Report SMS Promotional Tactics Structure PDF will help you deliver an outstanding performance that everyone would remember and praise you for. Do download this presentation today. This slide represents the dashboard to track and monitor the overall performance of SMS marketing campaign and its impact on business sales and revenues. It includes details related to top automated flows, attributed revenue etc.
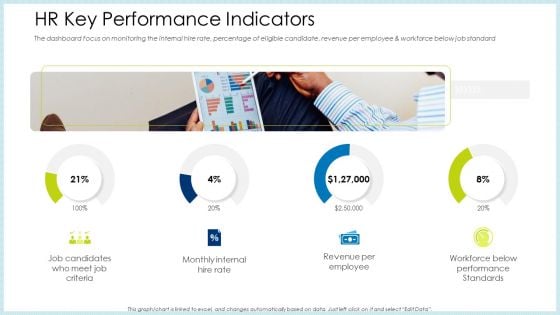
Technology Innovation Human Resource System HR Key Performance Indicators Ppt Styles Designs Download PDF
The dashboard focus on monitoring the internal hire rate, percentage of eligible candidate, revenue per employee and workforce below job standard. Presenting technology innovation human resource system hr key performance indicators ppt styles designs download pdf to provide visual cues and insights. Share and navigate important information on four stages that need your due attention. This template can be used to pitch topics like revenue per employee, performance standards, internal rate. In addition, this PPT design contains high-resolution images, graphics, etc, that are easily editable and available for immediate download.
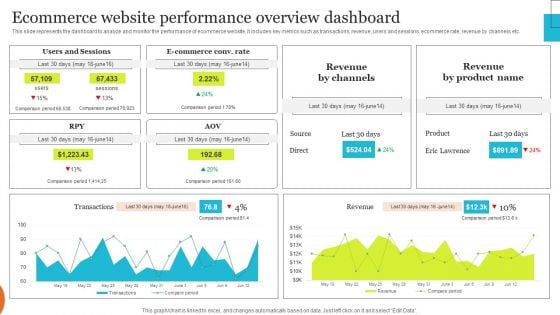
Implementing Effective Ecommerce Managemnet Platform Ecommerce Website Performance Overview Template PDF
This slide represents the dashboard to analyze and monitor the performance of ecommerce website. It includes key metrics such as transactions, revenue, users and sessions, ecommerce rate, revenue by channels etc. Boost your pitch with our creative Implementing Effective Ecommerce Managemnet Platform Ecommerce Website Performance Overview Template PDF. Deliver an awe-inspiring pitch that will mesmerize everyone. Using these presentation templates you will surely catch everyones attention. You can browse the ppts collection on our website. We have researchers who are experts at creating the right content for the templates. So you do not have to invest time in any additional work. Just grab the template now and use them.
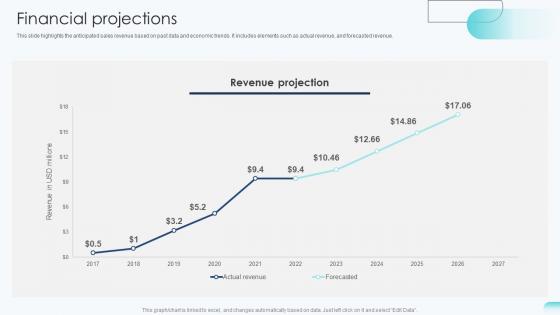
Financial Projections Big Data Analytics Investor Funding Elevator Pitch Deck
This slide highlights the anticipated sales revenue based on past data and economic trends. It includes elements such as actual revenue, and forecasted revenue. Slidegeeks is here to make your presentations a breeze with Financial Projections Big Data Analytics Investor Funding Elevator Pitch Deck With our easy-to-use and customizable templates, you can focus on delivering your ideas rather than worrying about formatting. With a variety of designs to choose from, you are sure to find one that suits your needs. And with animations and unique photos, illustrations, and fonts, you can make your presentation pop. So whether you are giving a sales pitch or presenting to the board, make sure to check out Slidegeeks first This slide highlights the anticipated sales revenue based on past data and economic trends. It includes elements such as actual revenue, and forecasted revenue.
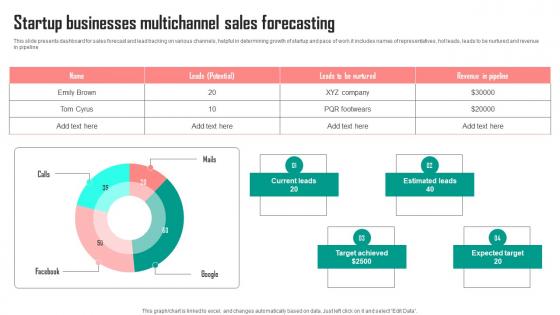
Startup Businesses Multichannel Sales Forecasting Template Pdf
This slide presents dashboard for sales forecast and lead tracking on various channels, helpful in determining growth of startup and pace of work.it includes names of representatives, hot leads, leads to be nurtured and revenue in pipeline Showcasing this set of slides titled Startup Businesses Multichannel Sales Forecasting Template Pdf. The topics addressed in these templates are Current Leads, Target Achieved, Estimated Leads. All the content presented in this PPT design is completely editable. Download it and make adjustments in color, background, font etc. as per your unique business setting. This slide presents dashboard for sales forecast and lead tracking on various channels, helpful in determining growth of startup and pace of work.it includes names of representatives, hot leads, leads to be nurtured and revenue in pipeline
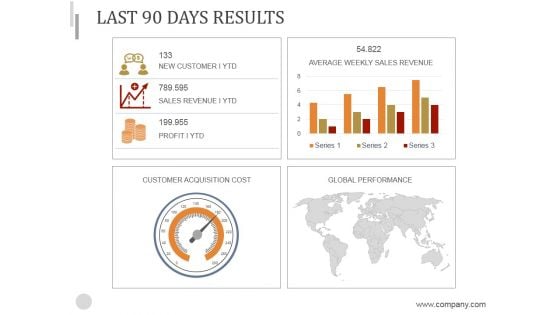
Last 90 Days Results Ppt PowerPoint Presentation Background Image
This is a last 90 days results ppt powerpoint presentation background image. This is a four stage process. The stages in this process are customer acquisition cost, global performance, average weekly sales revenue.
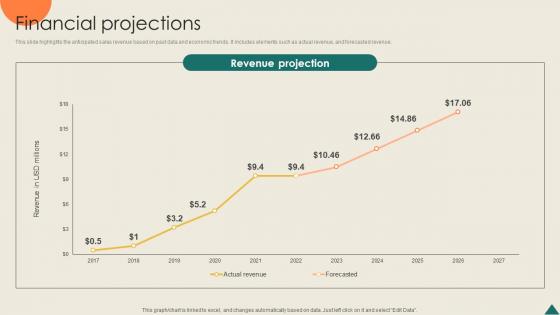
Financial Projections Financial Analytics Platform Investor Elevator Pitch Deck
This slide highlights the anticipated sales revenue based on past data and economic trends. It includes elements such as actual revenue, and forecasted revenue. Boost your pitch with our creative Financial Projections Financial Analytics Platform Investor Elevator Pitch Deck. Deliver an awe-inspiring pitch that will mesmerize everyone. Using these presentation templates you will surely catch everyones attention. You can browse the ppts collection on our website. We have researchers who are experts at creating the right content for the templates. So you do not have to invest time in any additional work. Just grab the template now and use them. This slide highlights the anticipated sales revenue based on past data and economic trends. It includes elements such as actual revenue, and forecasted revenue.
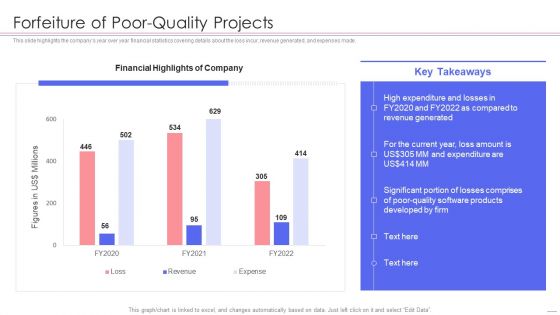
Agile QA Procedure Forfeiture Of Poor Quality Projects Topics PDF
This slide highlights the companys year over year financial statistics covering details about the loss incur, revenue generated, and expenses made. Deliver an awe inspiring pitch with this creative agile qa procedure forfeiture of poor quality projects topics pdf bundle. Topics like dashboard for tracking the agile quality assurance process effectiveness can be discussed with this completely editable template. It is available for immediate download depending on the needs and requirements of the user.
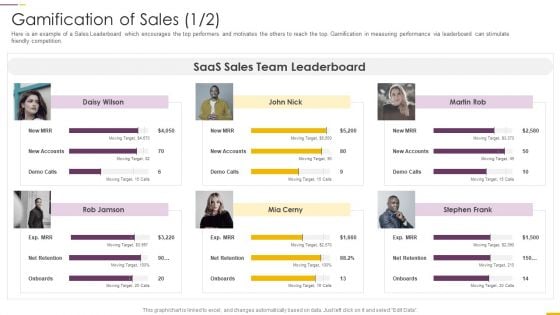
How Build Gamification Advertising Plan Gamification Of Sales Team Ppt Pictures Demonstration PDF
Here is another example of gamification of sales. This boosts revenue generation by pushing sales persons to be on top of their game.Deliver an awe inspiring pitch with this creative how build gamification advertising plan gamification of sales team ppt pictures demonstration pdf bundle. Topics like gamification dashboard can be discussed with this completely editable template. It is available for immediate download depending on the needs and requirements of the user.
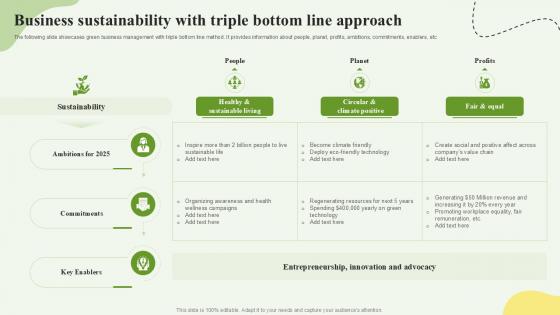
Business Sustainability With Triple Bottom Line Approach Ppt Example SS
This slide mentions the KPI dashboard for pharmaceutical companies. The purpose of this slide is analysis the 6 months gross selling of the company that can be utilized by the managers to determine actual revenue and profits. It includes details regarding discounts, unit sold per segment, profit by product, monthly revenue, etc. Get a simple yet stunning designed Business Sustainability With Triple Bottom Line Approach Ppt Example SS It is the best one to establish the tone in your meetings. It is an excellent way to make your presentations highly effective. So, download this PPT today from Slidegeeks and see the positive impacts. Our easy-to-edit Business Sustainability With Triple Bottom Line Approach Ppt Example SS can be your go-to option for all upcoming conferences and meetings. So, what are you waiting for Grab this template today. This slide mentions the KPI dashboard for pharmaceutical companies. The purpose of this slide is analysis the 6 months gross selling of the company that can be utilized by the managers to determine actual revenue and profits. It includes details regarding discounts, unit sold per segment, profit by product, monthly revenue, etc.
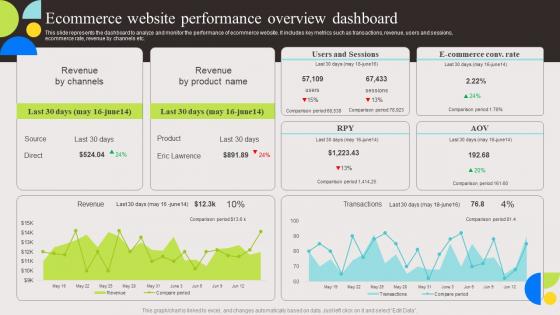
Ecommerce Website Performance Evaluation And Deployment Of Enhanced Elements Pdf
This slide represents the dashboard to analyze and monitor the performance of ecommerce website. It includes key metrics such as transactions, revenue, users and sessions, ecommerce rate, revenue by channels etc. If you are looking for a format to display your unique thoughts, then the professionally designed Ecommerce Website Performance Evaluation And Deployment Of Enhanced Elements Pdf is the one for you. You can use it as a Google Slides template or a PowerPoint template. Incorporate impressive visuals, symbols, images, and other charts. Modify or reorganize the text boxes as you desire. Experiment with shade schemes and font pairings. Alter, share or cooperate with other people on your work. Download Ecommerce Website Performance Evaluation And Deployment Of Enhanced Elements Pdf and find out how to give a successful presentation. Present a perfect display to your team and make your presentation unforgettable. This slide represents the dashboard to analyze and monitor the performance of ecommerce website. It includes key metrics such as transactions, revenue, users and sessions, ecommerce rate, revenue by channels etc.
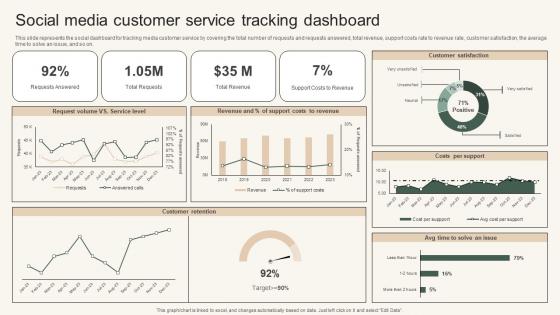
Social Media Customer Service Instant Messenger For Internal Business Operations Diagrams Pdf
This slide represents the social dashboard for tracking media customer service by covering the total number of requests and requests answered, total revenue, support costs rate to revenue rate, customer satisfaction, the average time to solve an issue, and so on. Whether you have daily or monthly meetings, a brilliant presentation is necessary. Social Media Customer Service Instant Messenger For Internal Business Operations Diagrams Pdf can be your best option for delivering a presentation. Represent everything in detail using Social Media Customer Service Instant Messenger For Internal Business Operations Diagrams Pdf and make yourself stand out in meetings. The template is versatile and follows a structure that will cater to your requirements. All the templates prepared by Slidegeeks are easy to download and edit. Our research experts have taken care of the corporate themes as well. So, give it a try and see the results. This slide represents the social dashboard for tracking media customer service by covering the total number of requests and requests answered, total revenue, support costs rate to revenue rate, customer satisfaction, the average time to solve an issue, and so on.
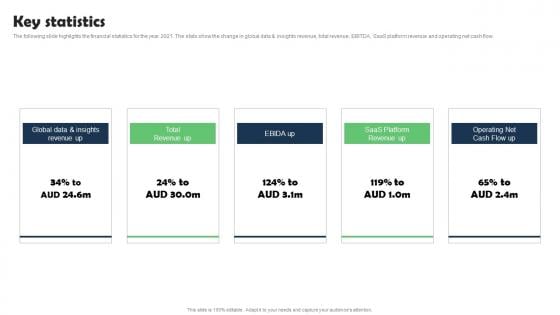
Key Statistics Marketing Research Services Management Business Pictures Pdf
The following slide highlights the financial statistics for the year 2021. The stats show the change in global data and insights revenue, total revenue, EBITDA, SaaS platform revenue and operating net cash flow. Welcome to our selection of the Key Statistics Marketing Research Services Management Business Pictures Pdf. These are designed to help you showcase your creativity and bring your sphere to life. Planning and Innovation are essential for any business that is just starting out. This collection contains the designs that you need for your everyday presentations. All of our PowerPoints are 100 percent editable, so you can customize them to suit your needs. This multi-purpose template can be used in various situations. Grab these presentation templates today. The following slide highlights the financial statistics for the year 2021. The stats show the change in global data and insights revenue, total revenue, EBITDA, SaaS platform revenue and operating net cash flow.
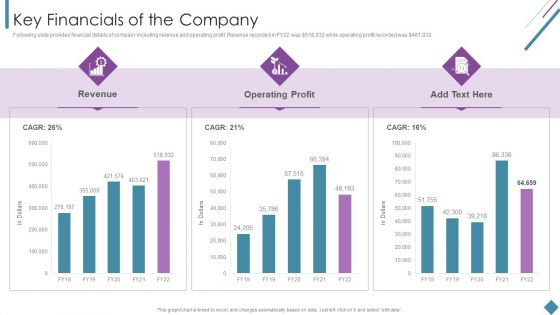
Metrics To Measure Business Performance Key Financials Of The Company Elements PDF
Following slide provides financial details of company including revenue and operating profit. Revenue recorded in FY22 was dollar 518,932 while operating profit recorded was dollar 481,932. Deliver an awe inspiring pitch with this creative Metrics To Measure Business Performance Key Financials Of The Company Elements PDF bundle. Topics like Revenue, Operating Profit can be discussed with this completely editable template. It is available for immediate download depending on the needs and requirements of the user.
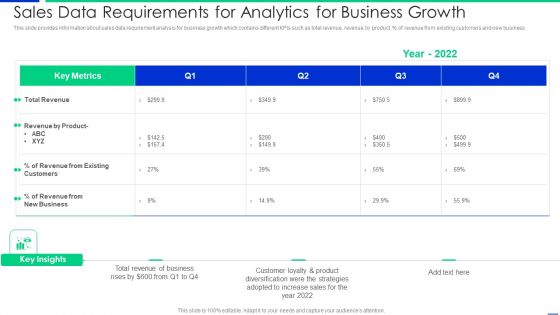
Sales Data Requirements For Analytics For Business Growth Information PDF
This slide provides information about sales data requirement analysis for business growth which contains different KPIs such as total revenue, revenue by product, percentage of revenue from existing customers and new business. Pitch your topic with ease and precision using this sales data requirements for analytics for business growth information pdf. This layout presents information on customers, revenue, business. It is also available for immediate download and adjustment. So, changes can be made in the color, design, graphics or any other component to create a unique layout.
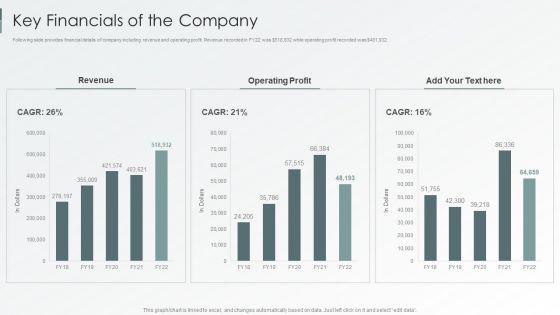
Enterprise Sustainability Performance Metrics Key Financials Of The Company Rules PDF
Following slide provides financial details of company including revenue and operating profit. Revenue recorded in FY22 was dollar518,932 while operating profit recorded was dollar481,932.Deliver an awe inspiring pitch with this creative Enterprise Sustainability Performance Metrics Key Financials Of The Company Rules PDF bundle. Topics like Operating, Profit, Revenue can be discussed with this completely editable template. It is available for immediate download depending on the needs and requirements of the user.

B2B Sales Procedure Counselling Core Drivers Of Sales Performance Management Infographics PDF
This slide provides the glimpse about the core drivers of sales performance management plan which focuses on revenue model, process, talent, technology and measurements. Deliver an awe-inspiring pitch with this creative b2b sales procedure counselling core drivers of sales performance management infographics pdf bundle. Topics like revenue model, revenue process, talent, technology, measurement can be discussed with this completely editable template. It is available for immediate download depending on the needs and requirements of the user.
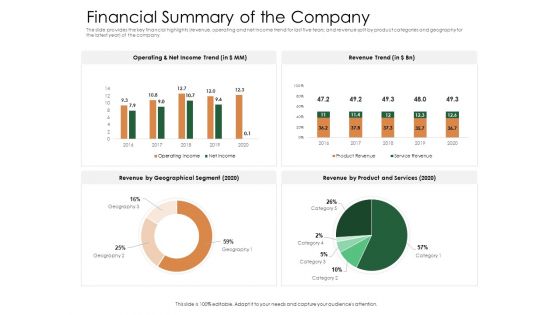
Substitute Financing Pitch Deck Financial Summary Of The Company Template PDF
the slide provides the key financial highlights revenue, operating and net income trend for last five tears and revenue split by product categories and geography for the latest year of the company. Deliver an awe inspiring pitch with this creative substitute financing pitch deck financial summary of the company template pdf bundle. Topics like services, revenue, product ,income can be discussed with this completely editable template. It is available for immediate download depending on the needs and requirements of the user.
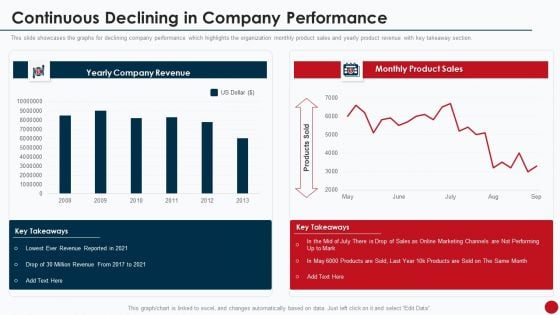
Marketing Manual For Product Promotion On Youtube Channel Continuous Declining In Company Performance Rules PDF
This slide showcases the graphs for declining company performance which highlights the organization monthly product sales and yearly product revenue with key takeaway section.Deliver and pitch your topic in the best possible manner with this Marketing Manual For Product Promotion On Youtube Channel Continuous Declining In Company Performance Rules PDF. Use them to share invaluable insights on Marketing Channels, Revenue Reported, Million Revenue and impress your audience. This template can be altered and modified as per your expectations. So, grab it now.
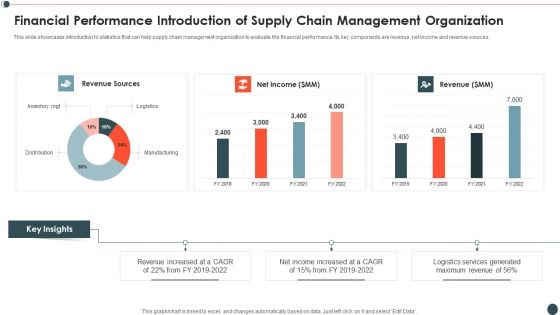
Financial Performance Introduction Of Supply Chain Management Organization Infographics PDF
This slide showcases introduction to statistics that can help supply chain management organization to evaluate the financial performance. Its key components are revenue, net income and revenue sources.Pitch your topic with ease and precision using this Financial Performance Introduction Of Supply Chain Management Organization Infographics PDF This layout presents information on Revenue Sources, Revenue Increased, Income Increased It is also available for immediate download and adjustment. So, changes can be made in the color, design, graphics or any other component to create a unique layout.
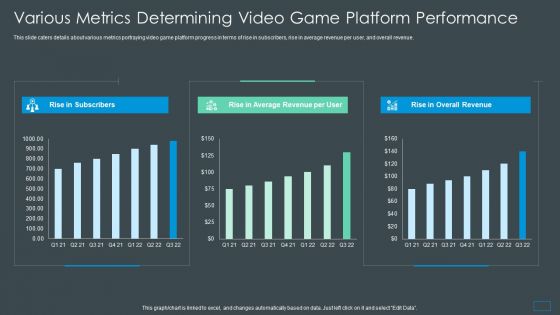
Multiplayer Gameplay System Venture Capitalist PPT Various Metrics Determining Video Game Platform Performance Infographics PDF
This slide caters details about various metrics portraying video game platform progress in terms of rise in subscribers, rise in average revenue per user, and overall revenue.Deliver an awe inspiring pitch with this creative multiplayer gameplay system venture capitalist ppt various metrics determining video game platform performance infographics pdf bundle. Topics like rise in subscribers, rise in average revenue, rise in overall revenue can be discussed with this completely editable template. It is available for immediate download depending on the needs and requirements of the user.
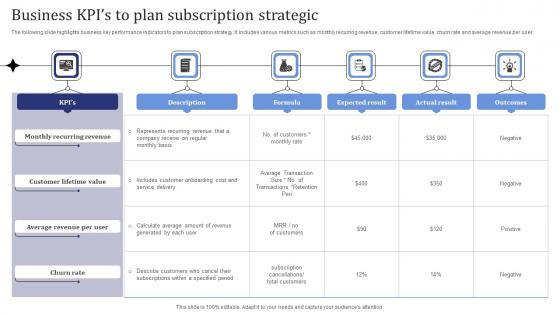
Business Kpis To Plan Subscription Strategic Pictures Pdf
The following slide highlights business key performance indicators to plan subscription strategy. It includes various metrics such as monthly recurring revenue, customer lifetime value, churn rate and average revenue per user. Showcasing this set of slides titled Business Kpis To Plan Subscription Strategic Pictures Pdf. The topics addressed in these templates are Monthly Recurring Revenue, Customer Lifetime Value, Churn Rate. All the content presented in this PPT design is completely editable. Download it and make adjustments in color, background, font etc. as per your unique business setting. The following slide highlights business key performance indicators to plan subscription strategy. It includes various metrics such as monthly recurring revenue, customer lifetime value, churn rate and average revenue per user.
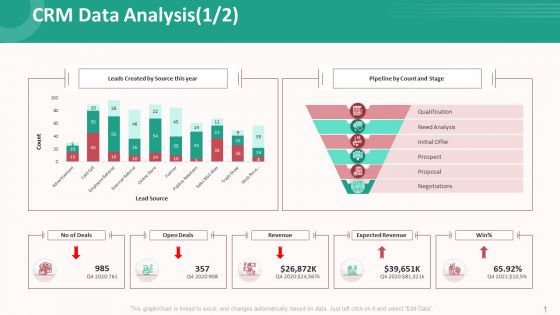
Customer Relationship Management Action Plan Crm Data Analysis Source Template PDF
Deliver and pitch your topic in the best possible manner with this customer relationship management action plan crm data analysis source template pdf. Use them to share invaluable insights on no of deals, open deals, revenue, expected revenue and impress your audience. This template can be altered and modified as per your expectations. So, grab it now.
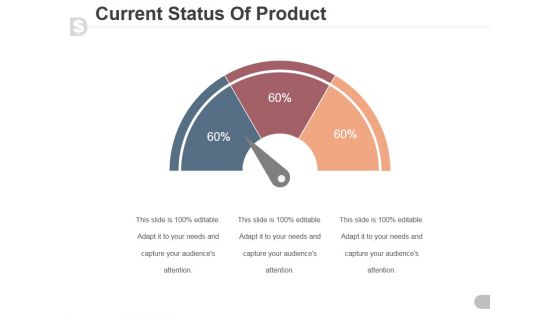
Current Status Of Product Ppt PowerPoint Presentation Designs Download
This is a current status of product ppt powerpoint presentation designs download. This is a three stage process. The stages in this process are speedometer, dashboard, business, marketing, finance.
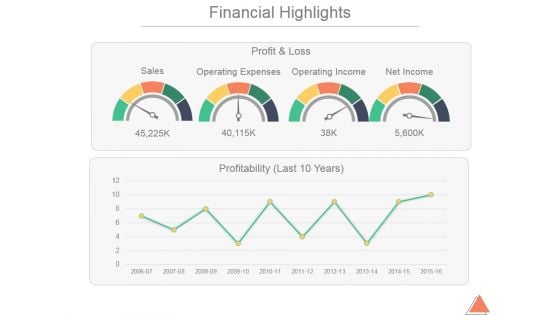
Financial Highlights Template 1 Ppt PowerPoint Presentation Slides
This is a financial highlights template 1 ppt powerpoint presentation slides. This is a two stage process. The stages in this process are sales, operating expenses, operating income, net income.
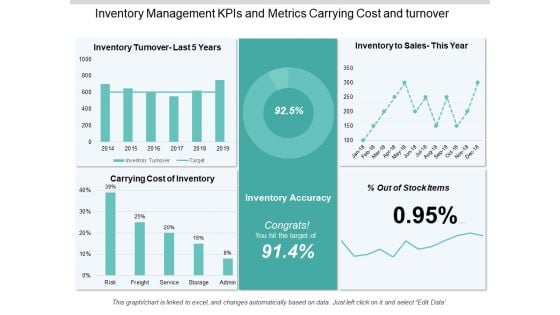
Inventory Management Kpis And Metrics Carrying Cost And Turnover Ppt PowerPoint Presentation Information
This is a inventory management kpis and metrics carrying cost and turnover ppt powerpoint presentation information. This is a five stage process. The stages in this process are logistics performance, logistics dashboard, logistics kpis.

Kpis In Shipping Perfect Order Rate And On Time Shipment Ppt PowerPoint Presentation Show Guide
This is a kpis in shipping perfect order rate and on time shipment ppt powerpoint presentation show guide. This is a six stage process. The stages in this process are logistics performance, logistics dashboard, logistics kpis.
Logistics Kpis And Metrics Percentage Of Orders Delivered Ppt PowerPoint Presentation Icon
This is a logistics kpis and metrics percentage of orders delivered ppt powerpoint presentation icon. This is a five stage process. The stages in this process are logistics performance, logistics dashboard, logistics kpis.
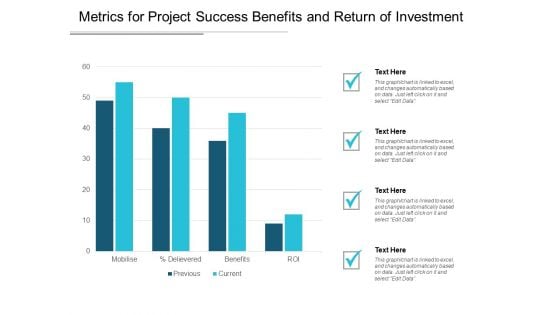
Metrics For Project Success Benefits And Return Of Investment Ppt PowerPoint Presentation Pictures Structure
This is a metrics for project success benefits and return of investment ppt powerpoint presentation pictures structure. This is a four stage process. The stages in this process are project dashboard, project kpis, project metrics.

Metrics In Project Management Planning Design Development Ppt PowerPoint Presentation Outline Show
This is a metrics in project management planning design development ppt powerpoint presentation outline show. This is a two stage process. The stages in this process are project dashboard, project kpis, project metrics.
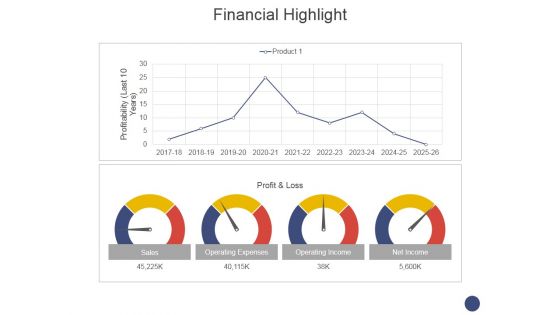
Financial Highlight Template 1 Ppt PowerPoint Presentation Model Deck
This is a financial highlight template 1 ppt powerpoint presentation model deck. This is a two stage process. The stages in this process are sales, operating expenses, operating income, net income.

Donut Pie Chart Ppt PowerPoint Presentation Infographics Outfit
This is a donut pie chart ppt powerpoint presentation infographics outfit. This is a three stage process. The stages in this process are business, strategy, analysis, planning, dashboard, finance.
Website Performance Review Ppt PowerPoint Presentation Icon Deck
This is a website performance review ppt powerpoint presentation icon deck. This is a three stage process. The stages in this process are conversion rate, average visit value goal, visits.
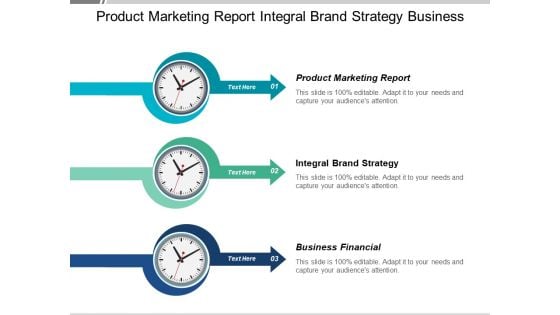
Product Marketing Report Integral Brand Strategy Business Financial Ppt PowerPoint Presentation Inspiration Backgrounds
This is a product marketing report integral brand strategy business financial ppt powerpoint presentation inspiration backgrounds. This is a three stage process. The stages in this process are product marketing report, integral brand strategy, business financial.


 Continue with Email

 Home
Home


