Revenue Dashboard
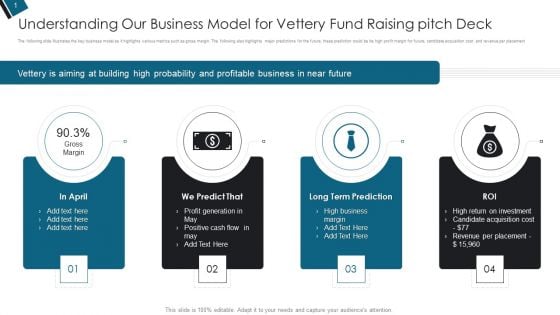
Understanding Our Business Model For Vettery Fund Raising Pitch Deck Ppt PowerPoint Presentation Design Ideas PDF
The following slide illustrates the key business model as it highlights various metrics such as gross margin. The following also highlights major predictions for the future, these prediction could be be high profit margin for future, candidate acquisition cost and revenue per placement.This is a Understanding Our Business Model For Vettery Fund Raising Pitch Deck Ppt PowerPoint Presentation Design Ideas PDF template with various stages. Focus and dispense information on four stages using this creative set, that comes with editable features. It contains large content boxes to add your information on topics like Profit Generation, Positive Cash, Candidate Acquisition You can also showcase facts, figures, and other relevant content using this PPT layout. Grab it now.
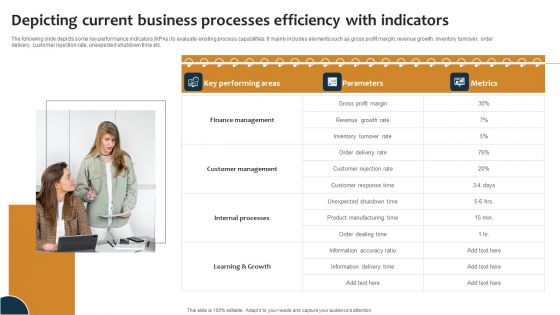
Improving Business Procedures Enterprise Resource Planning System Depicting Current Business Processe Professional PDF
The following slide depicts some key performance indicators KPAs to evaluate existing process capabilities. It mainly includes elements such as gross profit margin, revenue growth, inventory turnover, order delivery, customer rejection rate, unexpected shutdown time etc. Whether you have daily or monthly meetings, a brilliant presentation is necessary. Improving Business Procedures Enterprise Resource Planning System Depicting Current Business Processe Professional PDF can be your best option for delivering a presentation. Represent everything in detail using Improving Business Procedures Enterprise Resource Planning System Depicting Current Business Processe Professional PDF and make yourself stand out in meetings. The template is versatile and follows a structure that will cater to your requirements. All the templates prepared by Slidegeeks are easy to download and edit. Our research experts have taken care of the corporate themes as well. So, give it a try and see the results.
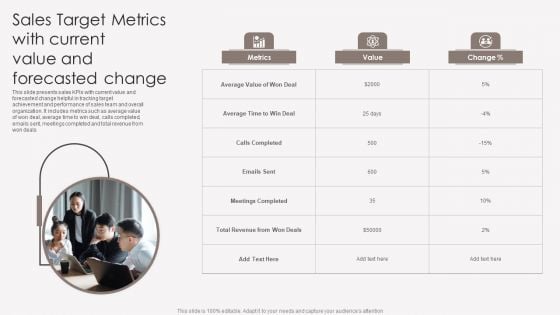
Sales Target Metrics With Current Value And Forecasted Change Elements PDF
This slide presents sales KPIs with current value and forecasted change helpful in tracking target achievement and performance of sales team and overall organization. It includes metrics such as average value of won deal, average time to win deal, calls completed, emails sent, meetings completed and total revenue from won deals. Persuade your audience using this Sales Target Metrics With Current Value And Forecasted Change Elements PDF. This PPT design covers three stages, thus making it a great tool to use. It also caters to a variety of topics including Metrics, Value, Change. Download this PPT design now to present a convincing pitch that not only emphasizes the topic but also showcases your presentation skills.
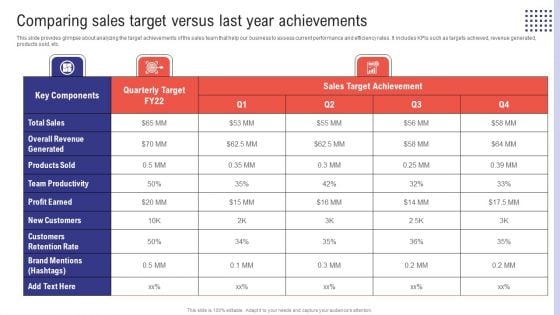
Planning Sales Campaign To Improve Comparing Sales Target Versus Last Year Achievements Graphics PDF
This slide provides glimpse about analyzing the target achievements of the sales team that help our business to assess current performance and efficiency rates. It includes KPIs such as targets achieved, revenue generated, products sold, etc. Do you have an important presentation coming up Are you looking for something that will make your presentation stand out from the rest Look no further than Planning Sales Campaign To Improve Comparing Sales Target Versus Last Year Achievements Graphics PDF. With our professional designs, you can trust that your presentation will pop and make delivering it a smooth process. And with Slidegeeks, you can trust that your presentation will be unique and memorable. So why wait Grab Planning Sales Campaign To Improve Comparing Sales Target Versus Last Year Achievements Graphics PDF today and make your presentation stand out from the rest.
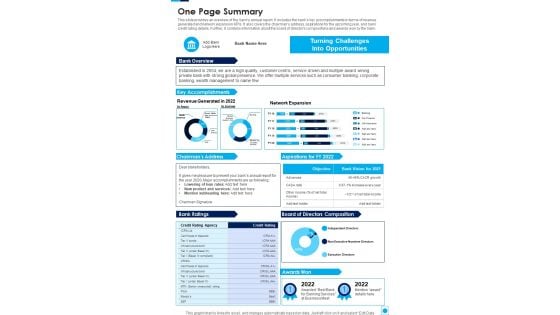
One Page Summary Template 225 One Pager Documents
This slide provides an overview of the banks annual report. It includes the banks key accomplishments in terms of revenue generated and network expansion KPIs. It also covers the chairmans address, aspirations for the upcoming year, and bank credit rating details. Further, it contains information about the board of directors compositions and awards won by the bank. Presenting you a fantastic One Page Summary Template 225 One Pager Documents. This piece is crafted on hours of research and professional design efforts to ensure you have the best resource. It is completely editable and its design allow you to rehash its elements to suit your needs. Get this One Page Summary Template 225 One Pager Documents A4 One-pager now.

Impact Of Integration Marketing Information System In Organization Professional PDF
This slide covers impact of integrating marketing information system and effectively analysis of customer demand. It involves impact on KPIs such as customer acquisition cost, marketing revenue attribution and customer lifetime value. Are you in need of a template that can accommodate all of your creative concepts This one is crafted professionally and can be altered to fit any style. Use it with Google Slides or PowerPoint. Include striking photographs, symbols, depictions, and other visuals. Fill, move around, or remove text boxes as desired. Test out color palettes and font mixtures. Edit and save your work, or work with colleagues. Download Impact Of Integration Marketing Information System In Organization Professional PDF and observe how to make your presentation outstanding. Give an impeccable presentation to your group and make your presentation unforgettable.
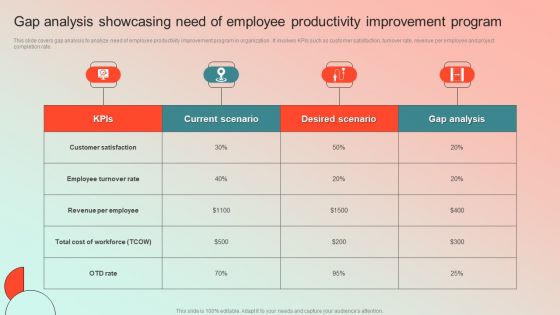
Gap Analysis Showcasing Need Of Employee Productivity Improvement Program Professional PDF
This slide covers gap analysis to analyze need of employee productivity improvement program in organization . It involves KPIs such as customer satisfaction, turnover rate, revenue per employee and project completion rate. Here you can discover an assortment of the finest PowerPoint and Google Slides templates. With these templates, you can create presentations for a variety of purposes while simultaneously providing your audience with an eye catching visual experience. Download Gap Analysis Showcasing Need Of Employee Productivity Improvement Program Professional PDF to deliver an impeccable presentation. These templates will make your job of preparing presentations much quicker, yet still, maintain a high level of quality. Slidegeeks has experienced researchers who prepare these templates and write high quality content for you. Later on, you can personalize the content by editing the Gap Analysis Showcasing Need Of Employee Productivity Improvement Program Professional PDF.
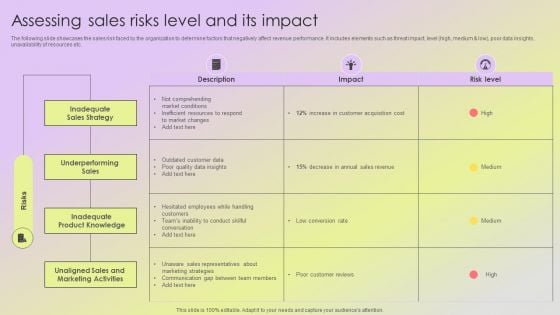
Mitigating Sales Risks With Strategic Action Planning Assessing Sales Risks Level And Its Impact Demonstration PDF
The following slide showcases the sales risk faced by the organization to determine factors that negatively affect revenue performance. It includes elements such as threat impact, level high, medium and low, poor data insights, unavailability of resources etc. Are you in need of a template that can accommodate all of your creative concepts This one is crafted professionally and can be altered to fit any style. Use it with Google Slides or PowerPoint. Include striking photographs, symbols, depictions, and other visuals. Fill, move around, or remove text boxes as desired. Test out color palettes and font mixtures. Edit and save your work, or work with colleagues. Download Mitigating Sales Risks With Strategic Action Planning Assessing Sales Risks Level And Its Impact Demonstration PDF and observe how to make your presentation outstanding. Give an impeccable presentation to your group and make your presentation unforgettable.
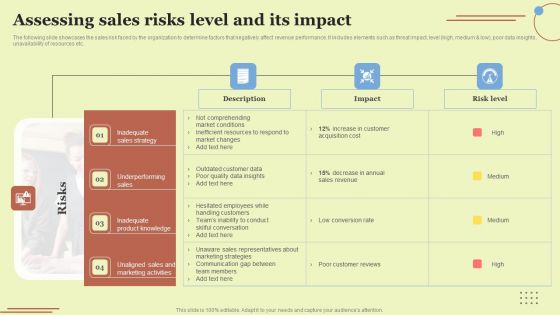
Assessing Sales Risks Level And Its Impact Elements PDF
The following slide showcases the sales risk faced by the organization to determine factors that negatively affect revenue performance. It includes elements such as threat impact, level high, medium and low, poor data insights, unavailability of resources etc. Are you in need of a template that can accommodate all of your creative concepts This one is crafted professionally and can be altered to fit any style. Use it with Google Slides or PowerPoint. Include striking photographs, symbols, depictions, and other visuals. Fill, move around, or remove text boxes as desired. Test out color palettes and font mixtures. Edit and save your work, or work with colleagues. Download Assessing Sales Risks Level And Its Impact Elements PDF and observe how to make your presentation outstanding. Give an impeccable presentation to your group and make your presentation unforgettable.
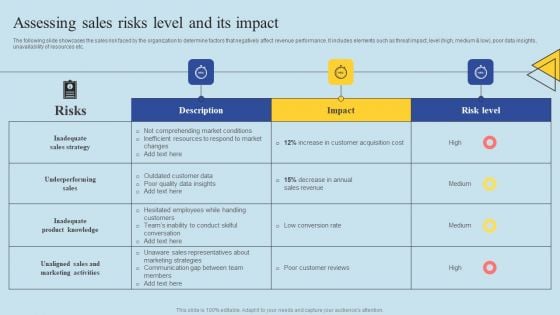
Determining Risks In Sales Administration Procedure Assessing Sales Risks Level And Its Impact Themes PDF
The following slide showcases the sales risk faced by the organization to determine factors that negatively affect revenue performance. It includes elements such as threat impact, level high, medium and low, poor data insights, unavailability of resources etc. Are you in need of a template that can accommodate all of your creative concepts This one is crafted professionally and can be altered to fit any style. Use it with Google Slides or PowerPoint. Include striking photographs, symbols, depictions, and other visuals. Fill, move around, or remove text boxes as desired. Test out color palettes and font mixtures. Edit and save your work, or work with colleagues. Download Determining Risks In Sales Administration Procedure Assessing Sales Risks Level And Its Impact Themes PDF and observe how to make your presentation outstanding. Give an impeccable presentation to your group and make your presentation unforgettable.
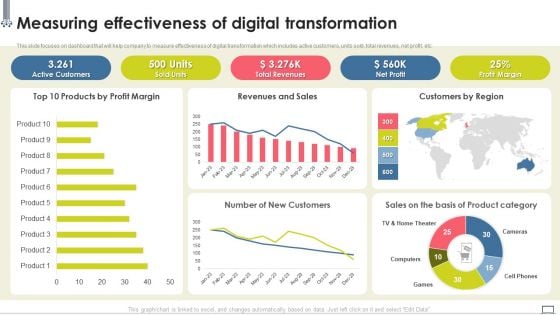
Change Management Strategy Measuring Effectiveness Of Digital Transformation Summary PDF
This slide focuses on dashboard that will help company to measure effectiveness of digital transformation which includes active customers, units sold, total revenues, net profit, etc. This modern and well-arranged Change Management Strategy Measuring Effectiveness Of Digital Transformation Summary PDF provides lots of creative possibilities. It is very simple to customize and edit with the Powerpoint Software. Just drag and drop your pictures into the shapes. All facets of this template can be edited with Powerpoint, no extra software is necessary. Add your own material, put your images in the places assigned for them, adjust the colors, and then you can show your slides to the world, with an animated slide included.
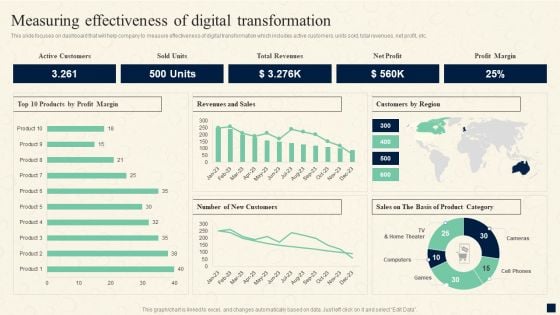
Change Management Process Measuring Effectiveness Of Digital Transformation Background PDF
This slide focuses on dashboard that will help company to measure effectiveness of digital transformation which includes active customers, units sold, total revenues, net profit, etc. Coming up with a presentation necessitates that the majority of the effort goes into the content and the message you intend to convey. The visuals of a PowerPoint presentation can only be effective if it supplements and supports the story that is being told. Keeping this in mind our experts created v to reduce the time that goes into designing the presentation. This way, you can concentrate on the message while our designers take care of providing you with the right template for the situation.
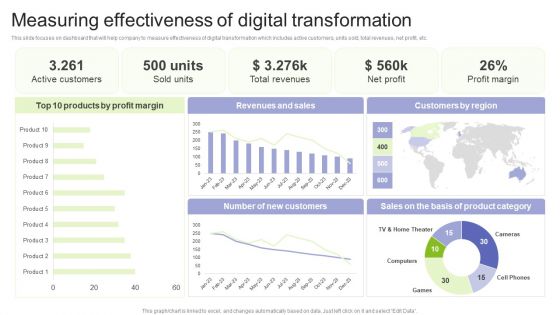
Implementing Change Management Strategy To Transform Business Processes Measuring Effectiveness Of Digital Information PDF
This slide focuses on dashboard that will help company to measure effectiveness of digital transformation which includes active customers, units sold, total revenues, net profit, etc. Want to ace your presentation in front of a live audience Our Implementing Change Management Strategy To Transform Business Processes Measuring Effectiveness Of Digital Information PDF can help you do that by engaging all the users towards you. Slidegeeks experts have put their efforts and expertise into creating these impeccable powerpoint presentations so that you can communicate your ideas clearly. Moreover, all the templates are customizable, and easy to edit and downloadable. Use these for both personal and commercial use.
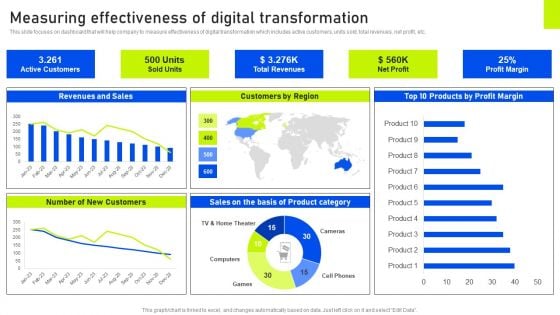
Measuring Effectiveness Of Digital Transformation Ppt Ideas Graphics Download PDF
This slide focuses on dashboard that will help company to measure effectiveness of digital transformation which includes active customers, units sold, total revenues, net profit, etc. Take your projects to the next level with our ultimate collection of Measuring Effectiveness Of Digital Transformation Ppt Ideas Graphics Download PDF. Slidegeeks has designed a range of layouts that are perfect for representing task or activity duration, keeping track of all your deadlines at a glance. Tailor these designs to your exact needs and give them a truly corporate look with your own brand colors they will make your projects stand out from the rest.
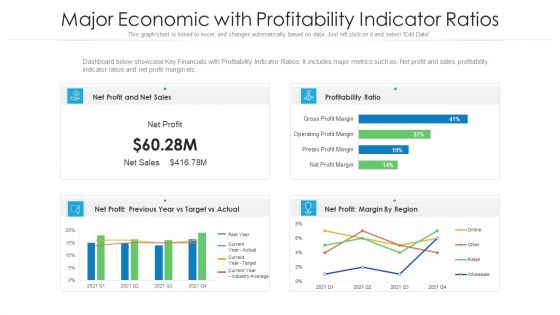
Major Economic With Profitability Indicator Ratios Ppt PowerPoint Presentation Gallery Layouts PDF
Dashboard below showcase Key Financials with Profitability Indicator Ratios. It includes major metrics such as- Net profit and sales, profitability indicator ratios and net profit margin etc. Pitch your topic with ease and precision using this major economic with profitability indicator ratios ppt powerpoint presentation gallery layouts pdf. This layout presents information on sales, profitability ratio, target. It is also available for immediate download and adjustment. So, changes can be made in the color, design, graphics or any other component to create a unique layout.
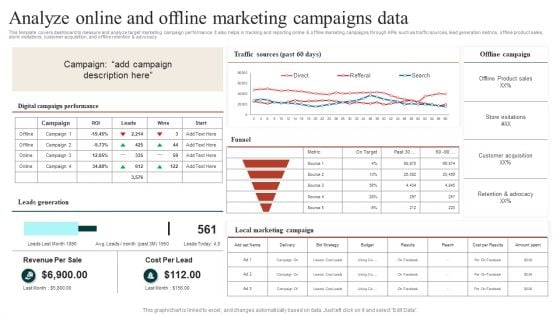
Target Marketing Techniques Analyze Online And Offline Marketing Campaigns Data Ideas PDF
This template covers dashboard to measure and analyze target marketing campaign performance. It also helps in tracking and reporting online and offline marketing campaigns through KPIs such as traffic sources, lead generation metrics, offline product sales, store visitations, customer acquisition, and offline retention and advocacy Find a pre designed and impeccable Target Marketing Techniques Evaluating Growth Rate For Target Marketing Slides PDF. The templates can ace your presentation without additional effort. You can download these easy to edit presentation templates to make your presentation stand out from others. So, what are you waiting for Download the template from Slidegeeks today and give a unique touch to your presentation.
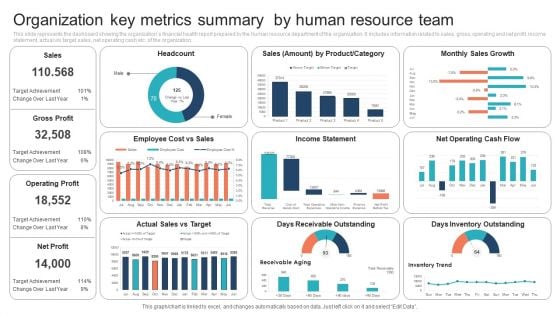
Organization Key Metrics Summary By Human Resource Team Information PDF
This slide represents the dashboard showing the organizations financial health report prepared by the human resource department of the organization. It includes information related to sales, gross, operating and net profit, income statement, actual vs target sales, net operating cash etc. of the organization.Showcasing this set of slides titled Organization Key Metrics Summary By Human Resource Team Information PDF. The topics addressed in these templates are Organization Key Metrics Summary, Human Resource Team. All the content presented in this PPT design is completely editable. Download it and make adjustments in color, background, font etc. as per your unique business setting.
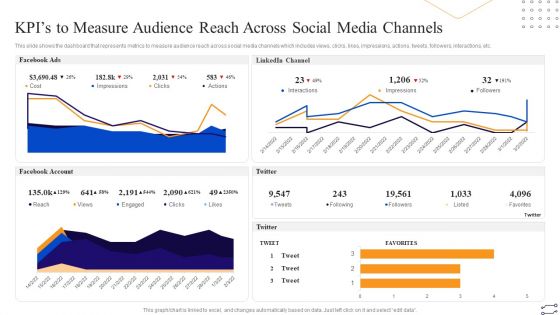
Online Marketing Tactics To Enhance Sales Kpis To Measure Audience Reach Across Social Media Professional PDF
This slide shows the dashboard that represents metrics to measure audience reach across social media channels which includes views, clicks, likes, impressions, actions, tweets, followers, interactions, etc. Deliver an awe inspiring pitch with this creative Online Marketing Tactics To Enhance Sales Kpis To Measure Audience Reach Across Social Media Professional PDF bundle. Topics like LinkedIn Channel, Facebook Account, Twitter, Facebook Ads can be discussed with this completely editable template. It is available for immediate download depending on the needs and requirements of the user.
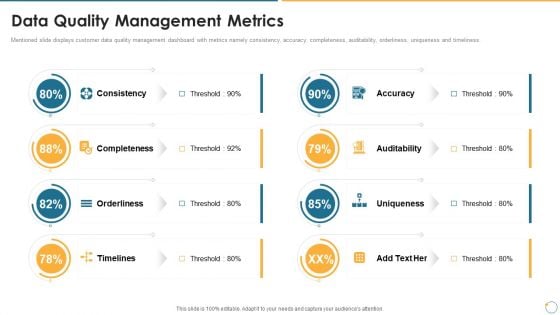
Collection Of Quality Assurance PPT Data Quality Management Metrics Information PDF
Mentioned slide displays customer data quality management dashboard with metrics namely consistency, accuracy, completeness, auditability, orderliness, uniqueness and timeliness. This is a collection of quality assurance ppt data quality management metrics information pdf template with various stages. Focus and dispense information on eight stages using this creative set, that comes with editable features. It contains large content boxes to add your information on topics like accuracy, auditability, consistency, completeness, uniqueness. You can also showcase facts, figures, and other relevant content using this PPT layout. Grab it now.
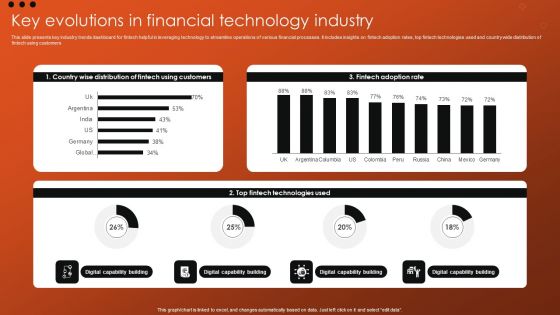
Key Evolutions In Financial Technology Industry Ideas PDF
This slide presents key industry trends dashboard for fintech helpful in leveraging technology to streamline operations of various financial processes. It includes insights on fintech adoption rates, top fintech technologies used and countrywide distribution of fintech using customers. Showcasing this set of slides titled Key Evolutions In Financial Technology Industry Ideas PDF. The topics addressed in these templates are Key Evolutions, Financial Technology Industry. All the content presented in this PPT design is completely editable. Download it and make adjustments in color, background, font etc. as per your unique business setting.
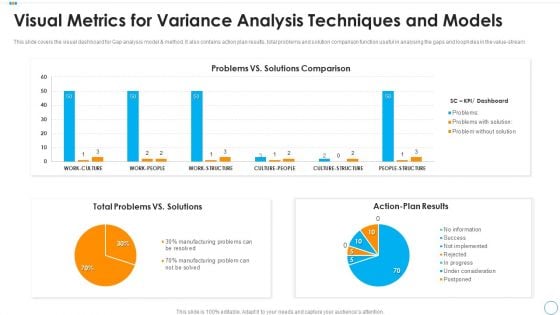
Visual Metrics For Variance Analysis Techniques And Models Mockup PDF
This slide covers the visual dashboard for Gap analysis model and method. It also contains action plan results, total problems and solution comparison function useful in analysing the gaps and loopholes in the value stream. Showcasing this set of slides titled visual metrics for variance analysis techniques and models mockup pdf. The topics addressed in these templates are total problems vs solutions, action plan results, problems vs solutions comparison. All the content presented in this PPT design is completely editable. Download it and make adjustments in color, background, font etc. as per your unique business setting.
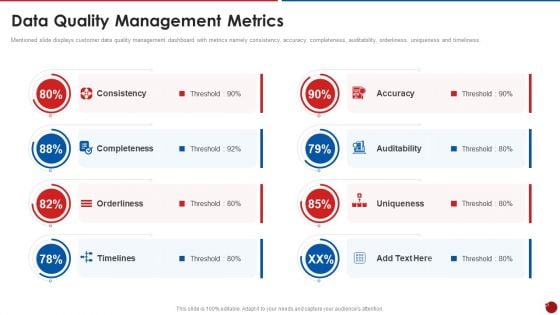
Quality Assurance Templates Set 2 Data Quality Management Metrics Pictures PDF
Mentioned slide displays customer data quality management dashboard with metrics namely consistency, accuracy, completeness, auditability, orderliness, uniqueness and timeliness. Presenting quality assurance templates set 2 data quality management metrics pictures pdf to provide visual cues and insights. Share and navigate important information on eight stages that need your due attention. This template can be used to pitch topics like consistency, completeness, orderliness, timelines, accuracy. In addtion, this PPT design contains high resolution images, graphics, etc, that are easily editable and available for immediate download.
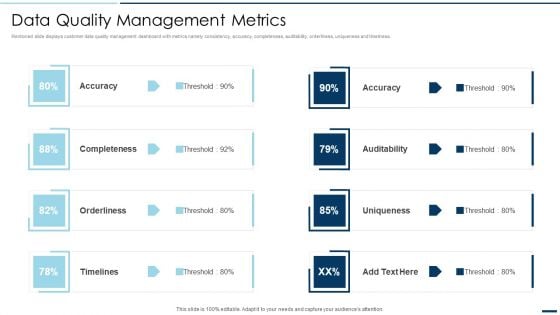
QA Plan Set 2 Data Quality Management Metrics Ppt PowerPoint Presentation Gallery Background Image PDF
Mentioned slide displays customer data quality management dashboard with metrics namely consistency, accuracy, completeness, auditability, orderliness, uniqueness and timeliness. Presenting QA Plan Set 2 Data Quality Management Metrics Ppt PowerPoint Presentation Gallery Background Image PDF to provide visual cues and insights. Share and navigate important information on eight stages that need your due attention. This template can be used to pitch topics like Accuracy Completeness, Orderliness Timelines. In addtion, this PPT design contains high resolution images, graphics, etc, that are easily editable and available for immediate download.
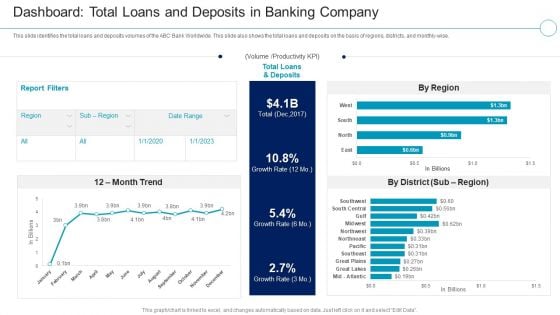
Financial Services Enterprise Transformation Loans And Deposits In Banking Company Ideas PDF
This slide identifies the total loans and deposits volumes of the ABC Bank Worldwide. This slide also shows the total loans and deposits on the basis of regions, districts, and monthly wise.Deliver and pitch your topic in the best possible manner with this Financial Services Enterprise Transformation Loans And Deposits In Banking Company Ideas PDF Use them to share invaluable insights on Dashboard Total Loans And Deposits In Banking Company and impress your audience. This template can be altered and modified as per your expectations. So, grab it now.
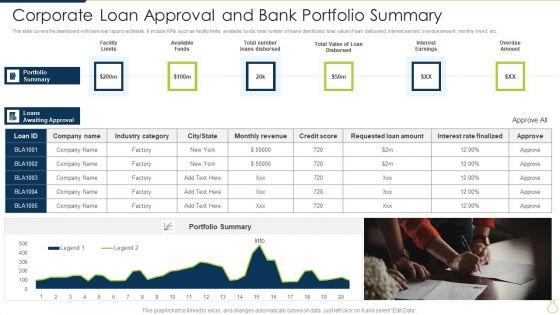
Corporate Loan Approval And Bank Portfolio Summary Portrait PDF
This slide covers the dashboard with bank loan approval details. It include KPIs such as facility limits, available funds, total number of loans distributed, total value of loan disbursed, interest earned, overdue amount, monthly trend, etc. Pitch your topic with ease and precision using this Corporate Loan Approval And Bank Portfolio Summary Portrait PDF. This layout presents information on Interest Earnings, Available Funds, Facility Limits. It is also available for immediate download and adjustment. So, changes can be made in the color, design, graphics or any other component to create a unique layout.
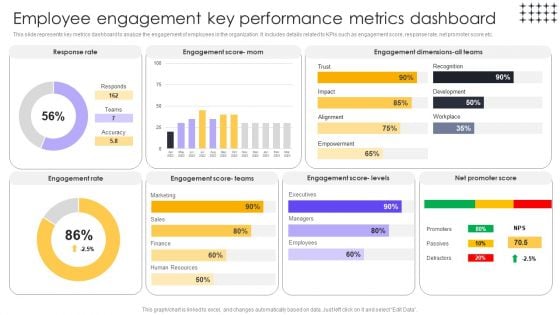
Tools For HR Business Analytics Employee Engagement Key Performance Metrics Brochure PDF
This slide represents key metrics dashboard to analyze the engagement of employees in the organization. It includes details related to KPIs such as engagement score, response rate, net promoter score etc. Make sure to capture your audiences attention in your business displays with our gratis customizable Tools For HR Business Analytics Employee Engagement Key Performance Metrics Brochure PDF. These are great for business strategies, office conferences, capital raising or task suggestions. If you desire to acquire more customers for your tech business and ensure they stay satisfied, create your own sales presentation with these plain slides.
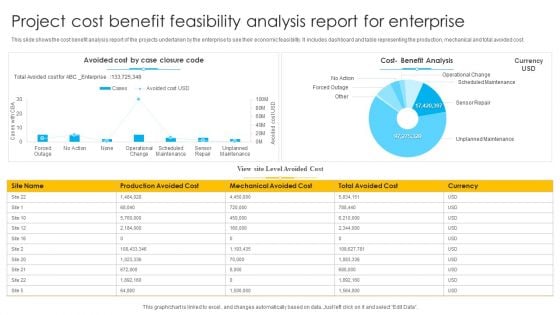
Project Cost Benefit Feasibility Analysis Report For Enterprise Ppt Layouts Background Image PDF
This slide shows the cost benefit analysis report of the projects undertaken by the enterprise to see their economic feasibility. It includes dashboard and table representing the production, mechanical and total avoided cost. Showcasing this set of slides titled Project Cost Benefit Feasibility Analysis Report For Enterprise Ppt Layouts Background Image PDF. The topics addressed in these templates are Avoided Cost, Case Closure Code, Cost Benefit Analysis, Total Avoided Cost. All the content presented in this PPT design is completely editable. Download it and make adjustments in color, background, font etc. as per your unique business setting.
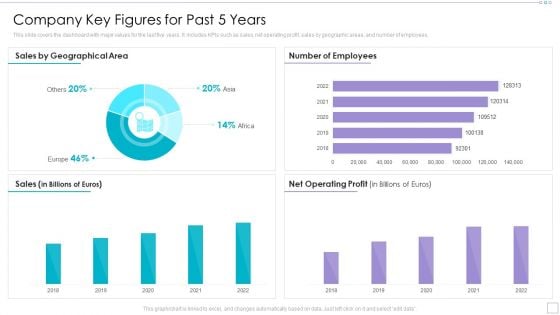
Clothing Business Market Entry Strategy Company Key Figures For Past 5 Years Infographics PDF
This slide covers the dashboard with major values for the last five years. It includes KPIs such as sales, net operating profit, sales by geographic areas, and number of employees. Deliver an awe inspiring pitch with this creative Clothing Business Market Entry Strategy Company Key Figures For Past 5 Years Infographics PDF bundle. Topics like Geographical Area, Operating Profit, Billions Of Euros can be discussed with this completely editable template. It is available for immediate download depending on the needs and requirements of the user.
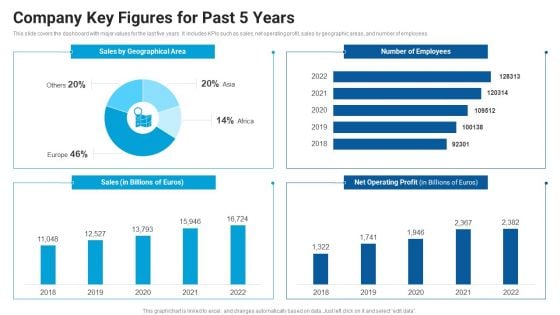
Company Key Figures For Past 5 Years Market Entry Approach For Apparel Sector Clipart PDF
This slide covers the dashboard with major values for the last five years. It includes KPIs such as sales, net operating profit, sales by geographic areas, and number of employees. Deliver an awe inspiring pitch with this creative Company Key Figures For Past 5 Years Market Entry Approach For Apparel Sector Clipart PDF bundle. Topics like Sales Geographical, Number Employees, Operating Profit can be discussed with this completely editable template. It is available for immediate download depending on the needs and requirements of the user.
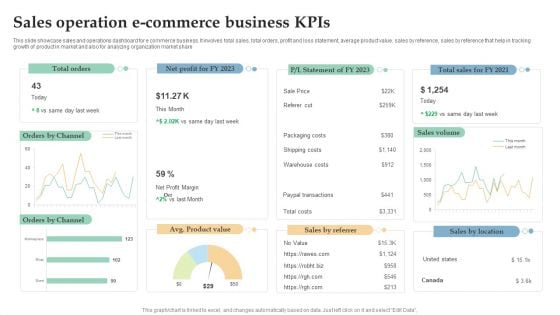
Sales Operation E Commerce Business Kpis Ppt Infographics Design Templates PDF
This slide showcase sales and operations dashboard for e commerce business. It involves total sales, total orders, profit and loss statement, average product value, sales by reference, sales by reference that help in tracking growth of product in market and also for analyzing organization market share. Pitch your topic with ease and precision using this Sales Operation E Commerce Business Kpis Ppt Infographics Design Templates PDF. This layout presents information on Total Orders, Sales Volume, Orders Channel. It is also available for immediate download and adjustment. So, changes can be made in the color, design, graphics or any other component to create a unique layout.
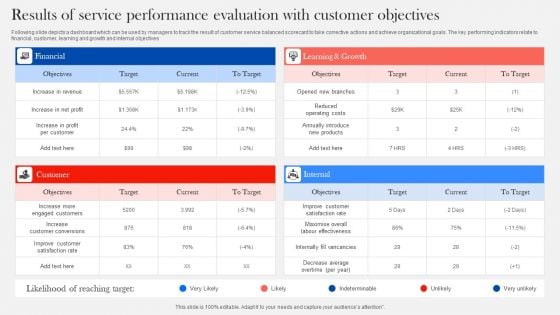
Results Of Service Performance Evaluation With Customer Objectives Diagrams PDF
Following slide depicts a dashboard which can be used by managers to track the result of customer service balanced scorecard to take corrective actions and achieve organizational goals. The key performing indicators relate to financial, customer, learning and growth and internal objectives. Showcasing this set of slides titled Results Of Service Performance Evaluation With Customer Objectives Diagrams PDF. The topics addressed in these templates are Financial, Customer, Internal. All the content presented in this PPT design is completely editable. Download it and make adjustments in color, background, font etc. as per your unique business setting.
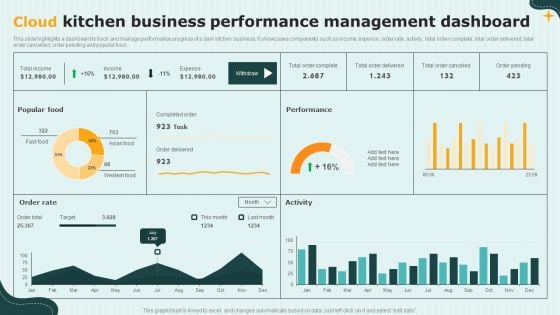
International Cloud Kitchen Industry Analysis Cloud Kitchen Business Performance Management Guidelines PDF
This slide highlights a dashboard to track and manage performance progress of a dark kitchen business. It showcases components such as income, expense, order rate, activity, total order complete, total order delivered, total order cancelled, order pending and popular food. From laying roadmaps to briefing everything in detail, our templates are perfect for you. You can set the stage with your presentation slides. All you have to do is download these easy-to-edit and customizable templates. International Cloud Kitchen Industry Analysis Cloud Kitchen Business Performance Management Guidelines PDF will help you deliver an outstanding performance that everyone would remember and praise you for. Do download this presentation today.
Facebook Advertising Campaign Performance Tracking Report Ppt PowerPoint Presentation Diagram Images PDF
This slide represents the dashboard to track and monitor the performance and effectiveness of Facebook advertising campaign. It includes details related to KPIs such as Facebook Ads amount spent, FB ads websites conversion etc. Make sure to capture your audiences attention in your business displays with our gratis customizable Facebook Advertising Campaign Performance Tracking Report Ppt PowerPoint Presentation Diagram Images PDF. These are great for business strategies, office conferences, capital raising or task suggestions. If you desire to acquire more customers for your tech business and ensure they stay satisfied, create your own sales presentation with these plain slides.
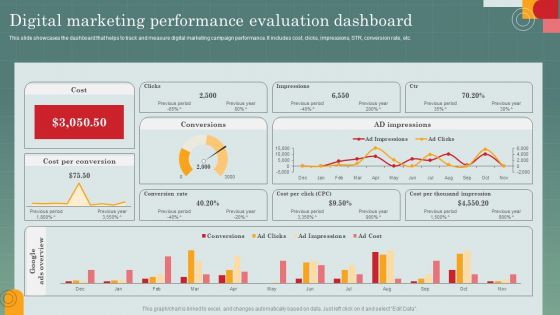
Advertising Programs Management Techniques Digital Marketing Performance Evaluation Slides PDF
This slide showcases the dashboard that helps to track and measure digital marketing campaign performance. It includes cost, clicks, impressions, STR, conversion rate, etc. Make sure to capture your audiences attention in your business displays with our gratis customizable Advertising Programs Management Techniques Digital Marketing Performance Evaluation Slides PDF. These are great for business strategies, office conferences, capital raising or task suggestions. If you desire to acquire more customers for your tech business and ensure they stay satisfied, create your own sales presentation with these plain slides.
Products And Services Offered Online Financial Management Funding Elevator Portrait Pdf
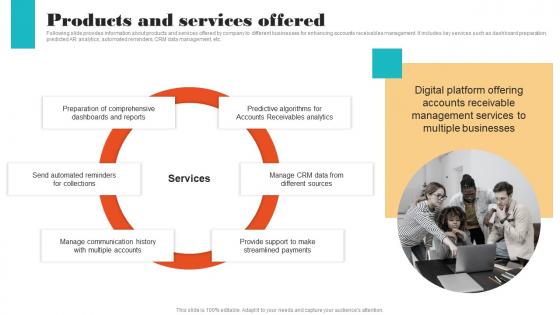
Following slide provides information about products and services offered by company to different businesses for enhancing accounts receivables management. It includes key services such as dashboard preparation, predicted AR analytics, automated reminders, CRM data management, etc. Formulating a presentation can take up a lot of effort and time, so the content and message should always be the primary focus. The visuals of the PowerPoint can enhance the presenters message, so our Products And Services Offered Online Financial Management Funding Elevator Portrait Pdf was created to help save time. Instead of worrying about the design, the presenter can concentrate on the message while our designers work on creating the ideal templates for whatever situation is needed. Slidegeeks has experts for everything from amazing designs to valuable content, we have put everything into Products And Services Offered Online Financial Management Funding Elevator Portrait Pdf Following slide provides information about products and services offered by company to different businesses for enhancing accounts receivables management. It includes key services such as dashboard preparation, predicted AR analytics, automated reminders, CRM data management, etc.
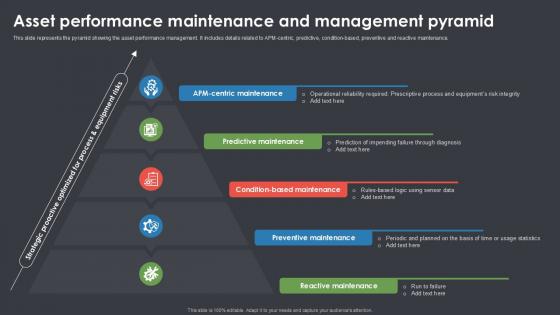
Asset Performance Maintenance And Management Pyramid Ppt Slide SS
This slide showcases dashboard for efficient cash management by power bi tool. The purpose of this slide is to maximize liquidity and minimize the cost of expenditures to ensure solvency. It provides companies with a window to analyze their financial position and improve overall profitability by scaling various problem areas. Boost your pitch with our creative Asset Performance Maintenance And Management Pyramid Ppt Slide SS. Deliver an awe-inspiring pitch that will mesmerize everyone. Using these presentation templates you will surely catch everyones attention. You can browse the ppts collection on our website. We have researchers who are experts at creating the right content for the templates. So you do not have to invest time in any additional work. Just grab the template now and use them. This slide showcases dashboard for efficient cash management by power bi tool. The purpose of this slide is to maximize liquidity and minimize the cost of expenditures to ensure solvency. It provides companies with a window to analyze their financial position and improve overall profitability by scaling various problem areas.
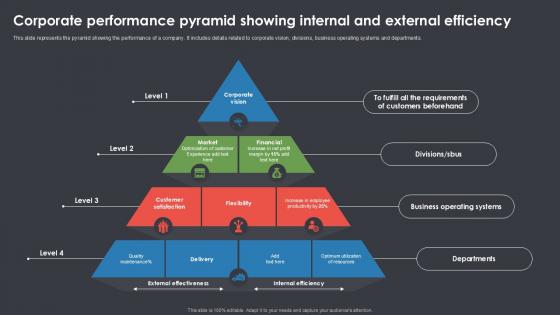
Corporate Performance Pyramid Showing Internal And External Efficiency Ppt Template SS
This slide highlights dashboard for evaluating financial performance using power bi tool. The purpose of this template is to provide managers with an efficient tool for comparing profit metrics across the quarters. It allows users to select different quarters and estimate sales of various products. Present like a pro with Corporate Performance Pyramid Showing Internal And External Efficiency Ppt Template SS Create beautiful presentations together with your team, using our easy-to-use presentation slides. Share your ideas in real-time and make changes on the fly by downloading our templates. So whether you are in the office, on the go, or in a remote location, you can stay in sync with your team and present your ideas with confidence. With Slidegeeks presentation got a whole lot easier. Grab these presentations today. This slide highlights dashboard for evaluating financial performance using power bi tool. The purpose of this template is to provide managers with an efficient tool for comparing profit metrics across the quarters. It allows users to select different quarters and estimate sales of various products.
Digital Transition Plan For Managing Business Measuring Effectiveness Of Digital Transformation Portrait PDF
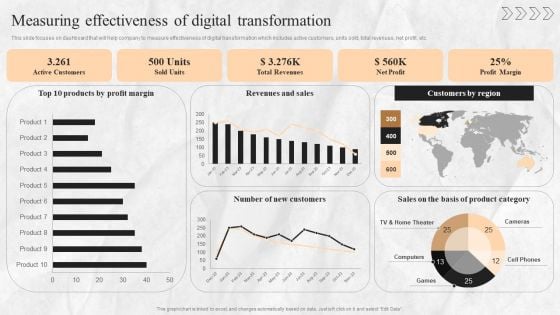
This slide focuses on dashboard that will help company to measure effectiveness of digital transformation which includes active customers, units sold, total revenues, net profit, etc. Formulating a presentation can take up a lot of effort and time, so the content and message should always be the primary focus. The visuals of the PowerPoint can enhance the presenters message, so our Digital Transition Plan For Managing Business Measuring Effectiveness Of Digital Transformation Portrait PDF was created to help save time. Instead of worrying about the design, the presenter can concentrate on the message while our designers work on creating the ideal templates for whatever situation is needed. Slidegeeks has experts for everything from amazing designs to valuable content, we have put everything into Digital Transition Plan For Managing Business Measuring Effectiveness Of Digital Transformation Portrait PDF
Planning Sales Campaign To Improve Tracking The Actual Sales Figures After Deal Finalizing Introduction PDF
This slide provides glimpse about dashboard analysis that can help the business to track the performance of the sales team. It includes KPIs such as revenues, profit, orders placed, conversion placed, conversion rate, customers, etc. Want to ace your presentation in front of a live audience Our Planning Sales Campaign To Improve Tracking The Actual Sales Figures After Deal Finalizing Introduction PDF can help you do that by engaging all the users towards you.. Slidegeeks experts have put their efforts and expertise into creating these impeccable powerpoint presentations so that you can communicate your ideas clearly. Moreover, all the templates are customizable, and easy-to-edit and downloadable. Use these for both personal and commercial use.
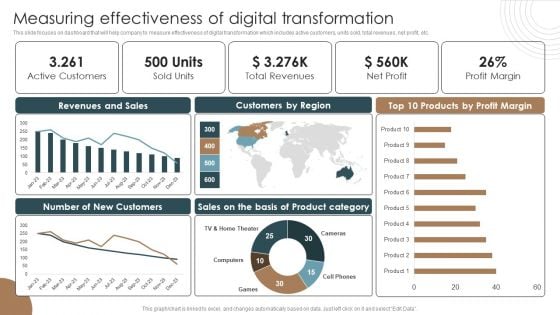
Measuring Effectiveness Of Digital Transformation Integrating Technology To Transform Change Designs PDF
This slide focuses on dashboard that will help company to measure effectiveness of digital transformation which includes active customers, units sold, total revenues, net profit, etc.Are you searching for a Measuring Effectiveness Of Digital Transformation Integrating Technology To Transform Change Designs PDF that is uncluttered, straightforward, and original Its easy to edit, and you can change the colors to suit your personal or business branding. For a presentation that expresses how much effort you have put in, this template is ideal With all of its features, including tables, diagrams, statistics, and lists, its perfect for a business plan presentation. Make your ideas more appealing with these professional slides. Download Measuring Effectiveness Of Digital Transformation Integrating Technology To Transform Change Designs PDF from Slidegeeks today.
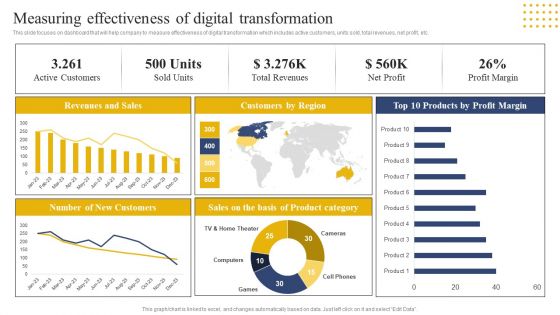
Transition Plan For Business Management Measuring Effectiveness Of Digital Transformation Sample PDF
This slide focuses on dashboard that will help company to measure effectiveness of digital transformation which includes active customers, units sold, total revenues, net profit, etc. This modern and well-arranged Transition Plan For Business Management Measuring Effectiveness Of Digital Transformation Sample PDF provides lots of creative possibilities. It is very simple to customize and edit with the Powerpoint Software. Just drag and drop your pictures into the shapes. All facets of this template can be edited with Powerpoint no extra software is necessary. Add your own material, put your images in the places assigned for them, adjust the colors, and then you can show your slides to the world, with an animated slide included.
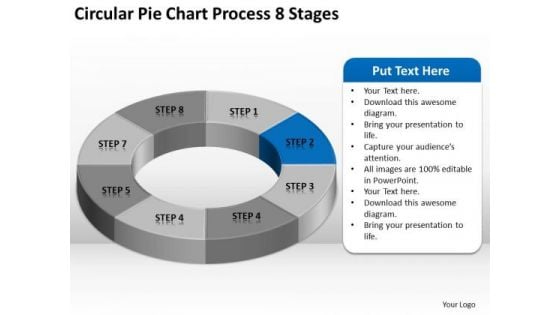
Circular Pie Chart Process 8 Stages Business Plan PowerPoint Slides
We present our circular pie chart process 8 stages business plan PowerPoint Slides.Download our Marketing PowerPoint Templates because Our PowerPoint Templates and Slides are designed to help you succeed. They have all the ingredients you need. Use our Finance PowerPoint Templates because It can be used to Set your controls for the heart of the sun. Our PowerPoint Templates and Slides will be the propellant to get you there. Download our Business PowerPoint Templates because It can Leverage your style with our PowerPoint Templates and Slides. Charm your audience with your ability. Use our Circle Charts PowerPoint Templates because you should once Tap the ingenuity of our PowerPoint Templates and Slides. They are programmed to succeed. Download our Shapes PowerPoint Templates because You can Hit the nail on the head with our PowerPoint Templates and Slides. Embed your ideas in the minds of your audience.Use these PowerPoint slides for presentations relating to Chart, Pie, Graph, Vector, 3d, Icon, Diagram, Progress, Business, Circular, Design, Information, Market, Opinion, Corporate, Sign, Symbol, Shadow, Percentage, Graphic, Finance, Data, Element, Drawing, Report, Marketing, Shape, Illustration, Earnings, Number, Strategy, Money, Dimensional, Survey, Growth, Colorful, Global, Account, Part, Investment, Statistic, Financial. The prominent colors used in the PowerPoint template are Blue, Gray, White. Start accelerating revenue growth with our Circular Pie Chart Process 8 Stages Business Plan PowerPoint Slides. They will make you look good.
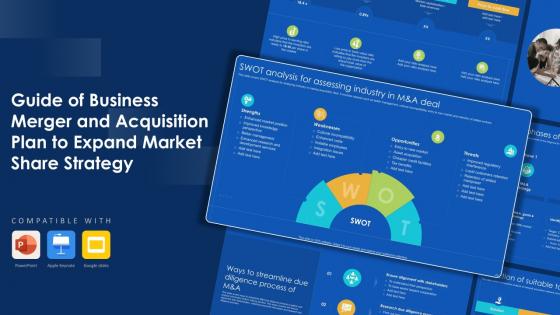
Guide Of Business Merger And Acquisition Plan To Expand Market Share Strategy Cd
Using this ready-made PowerPoint slide, you can incorporate your own data to make an impact with your business innovation and clarity of goals. Use this brilliantly designed Guide Of Business Merger And Acquisition Plan To Expand Market Share Strategy Cd to showcase how ultimately all business concepts are related. This presentation template can also be used to record resource allocation in a visual form. The M And A Financing, Due Diligence, M And A Valuation, Asset Acquisition, Talent Acquisition-Slide Guide Of Business Merger And Acquisition Plan To Expand Market Share Strategy Cd is suitable for all your business needs, where you need to make sure that all bases are covered. Download this PPT template now to start a journey on your chosen business, with customer satisfaction the key aim. Our professionally designed Guide to business merger and acquisition plans to expand the market share template, a business strategy to grow market share and enhance revenue and profit. Moreover, M and A financing PPT involves acquiring other companies assets or strengths to achieve success and improve brand image in the market.

Process 7 Stages To Represent Business Plan Software Download PowerPoint Slides
We present our process 7 stages to represent business plan software download PowerPoint Slides.Use our Process and Flows PowerPoint Templates because Our PowerPoint Templates and Slides will give you great value for your money. Be assured of finding the best projection to highlight your words. Present our Circle Charts PowerPoint Templates because Our PowerPoint Templates and Slides come in all colours, shades and hues. They help highlight every nuance of your views. Download our Business PowerPoint Templates because Our PowerPoint Templates and Slides are aesthetically designed to attract attention. We gaurantee that they will grab all the eyeballs you need. Download and present our Marketing PowerPoint Templates because Our PowerPoint Templates and Slides are created by a hardworking bunch of busybees. Always flitting around with solutions gauranteed to please. Present our Shapes PowerPoint Templates because Our PowerPoint Templates and Slides will steer your racing mind. Hit the right buttons and spur on your audience.Use these PowerPoint slides for presentations relating to Abstract, brochure, business, button, chart, circle, company, cyclic, data, demonstration, diagram, economic, financial, glossy, goal, graph, illustration, info,information, investment, manage, marketing, model, navigation, option, part, pie, presentation, process, result, section, segmented, seven, sphere, statistics,stock, strategy, variation, wheel. The prominent colors used in the PowerPoint template are Purple, Green, Yellow. Start accelerating revenue growth with our Process 7 Stages To Represent Business Plan Software Download PowerPoint Slides. They will make you look good.
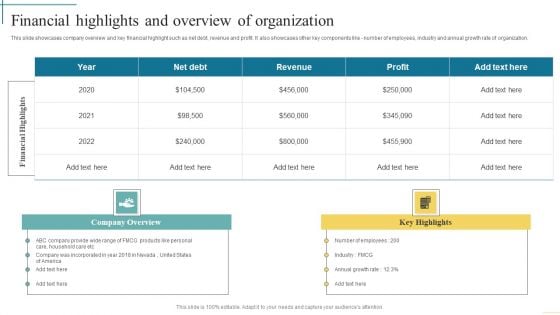
Financial Highlights And Overview Of Organization Developing Fundraising Techniques Inspiration PDF
This slide showcases dashboard that can help organization to calculate the internal rate rate of return on invested capital. Company can use it to communicate the return on investment to investors. Do you have to make sure that everyone on your team knows about any specific topic I yes, then you should give Financial Highlights And Overview Of Organization Developing Fundraising Techniques Inspiration PDF a try. Our experts have put a lot of knowledge and effort into creating this impeccable Financial Highlights And Overview Of Organization Developing Fundraising Techniques Inspiration PDF. You can use this template for your upcoming presentations, as the slides are perfect to represent even the tiniest detail. You can download these templates from the Slidegeeks website and these are easy to edit. So grab these today.
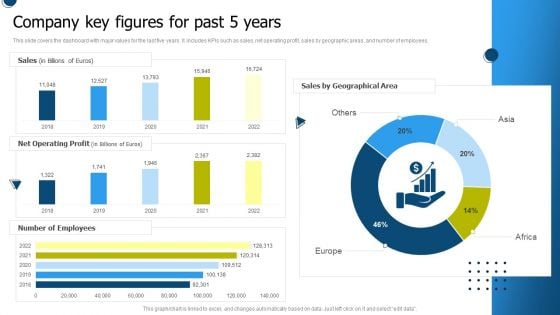
International Market Entry Strategies Company Key Figures For Past 5 Years Designs PDF
This slide covers the dashboard with major values for the last five years. It includes KPIs such as sales, net operating profit, sales by geographic areas, and number of employees. Retrieve professionally designed International Market Entry Strategies Company Key Figures For Past 5 Years Designs PDF to effectively convey your message and captivate your listeners. Save time by selecting pre-made slideshows that are appropriate for various topics, from business to educational purposes. These themes come in many different styles, from creative to corporate, and all of them are easily adjustable and can be edited quickly. Access them as PowerPoint templates or as Google Slides themes. You dont have to go on a hunt for the perfect presentation because Slidegeeks got you covered from everywhere.
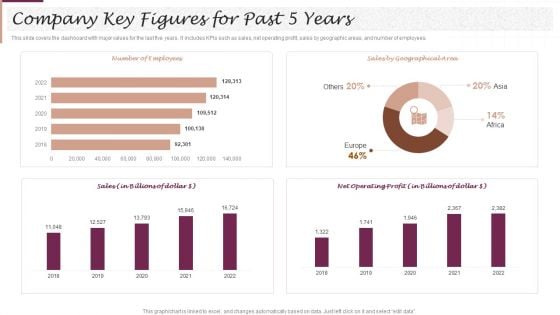
New Market Segment Entry Plan Company Key Figures For Past 5 Years Introduction PDF
This slide covers the dashboard with major values for the last five years. It includes KPIs such as sales, net operating profit, sales by geographic areas, and number of employees. Whether you have daily or monthly meetings, a brilliant presentation is necessary. New Market Segment Entry Plan Company Key Figures For Past 5 Years Introduction PDF can be your best option for delivering a presentation. Represent everything in detail using New Market Segment Entry Plan Company Key Figures For Past 5 Years Introduction PDF and make yourself stand out in meetings. The template is versatile and follows a structure that will cater to your requirements. All the templates prepared by Slidegeeks are easy to download and edit. Our research experts have taken care of the corporate themes as well. So, give it a try and see the results.

Evaluating New Commodity Impact On Market Key Metrics For Understanding Product Guidelines PDF
The following slide displays key metrics that can be used to understand the product, these metrics can be Revenues Generated by the product, the total units sold of the product and the total purchase value of the product This is a Evaluating New Commodity Impact On Market Key Metrics For Understanding Product Guidelines PDF template with various stages. Focus and dispense information on three stages using this creative set, that comes with editable features. It contains large content boxes to add your information on topics like Revenues Generated, Purchase Value, Revenues Generated You can also showcase facts, figures, and other relevant content using this PPT layout. Grab it now.
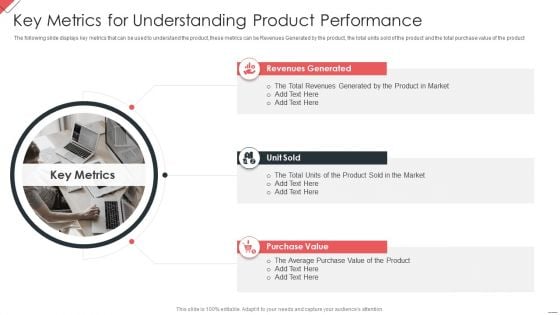
New Commodity Market Viability Review Key Metrics For Understanding Product Inspiration PDF
The following slide displays key metrics that can be used to understand the product, these metrics can be Revenues Generated by the product, the total units sold of the product and the total purchase value of the product This is a New Commodity Market Viability Review Key Metrics For Understanding Product Inspiration PDF template with various stages. Focus and dispense information on three stages using this creative set, that comes with editable features. It contains large content boxes to add your information on topics like Revenues Generated, Purchase Value, Revenues Generated You can also showcase facts, figures, and other relevant content using this PPT layout. Grab it now.
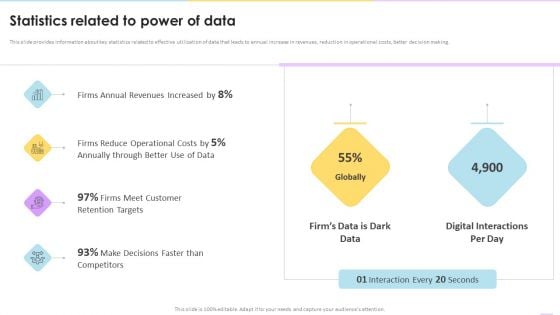
Data Valuation And Monetization Statistics Related To Power Of Data Designs PDF
This slide provides information about key statistics related to effective utilization of data that leads to annual increase in revenues, reduction in operational costs, better decision making. Deliver an awe inspiring pitch with this creative Data Valuation And Monetization Statistics Related To Power Of Data Designs PDF bundle. Topics like Firms Annual, Revenues Increased, Reduce Operational can be discussed with this completely editable template. It is available for immediate download depending on the needs and requirements of the user.
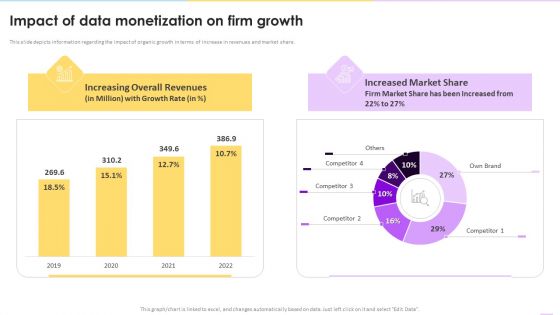
Data Valuation And Monetization Impact Of Data Monetization On Firm Growth Graphics PDF
This slide depicts information regarding the impact of organic growth in terms of increase in revenues and market share.Deliver an awe inspiring pitch with this creative Data Valuation And Monetization Impact Of Data Monetization On Firm Growth Graphics PDF bundle. Topics like Increasing Overall, Revenues Increased, Market Share can be discussed with this completely editable template. It is available for immediate download depending on the needs and requirements of the user.
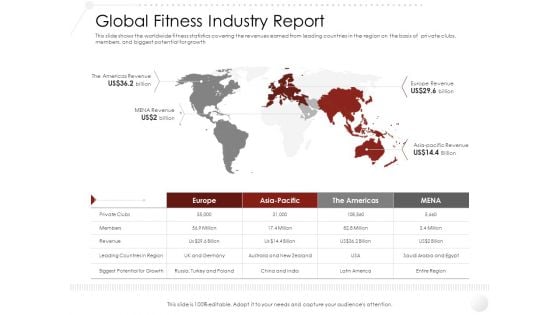
Market Entry Strategy Gym Health Clubs Industry Global Fitness Industry Report Background PDF
This slide shows the worldwide fitness statistics covering the revenues earned from leading countries in the region on the basis of private clubs, members, and biggest potential for growth. This is a market entry strategy gym health clubs industry global fitness industry report background pdf template with various stages. Focus and dispense information on four stages using this creative set, that comes with editable features. It contains large content boxes to add your information on topics like revenue, leading countries region, global fitness industry report. You can also showcase facts, figures, and other relevant content using this PPT layout. Grab it now.
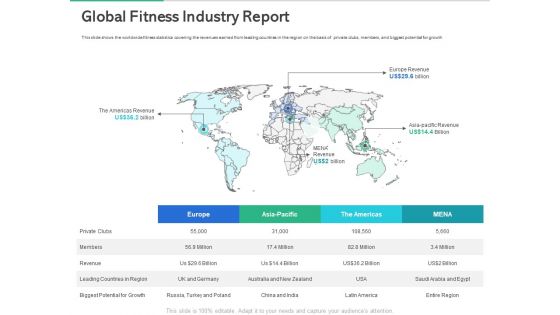
Market Overview Fitness Industry Global Fitness Industry Report Ppt Show Shapes PDF
This slide shows the worldwide fitness statistics covering the revenues earned from leading countries in the region on the basis of private clubs, members, and biggest potential for growth. This is a market overview fitness industry global fitness industry report ppt show shapes pdf template with various stages. Focus and dispense information on four stages using this creative set, that comes with editable features. It contains large content boxes to add your information on topics like private clubs, members, revenue, leading countries in region, biggest potential for growth. You can also showcase facts, figures, and other relevant content using this PPT layout. Grab it now.
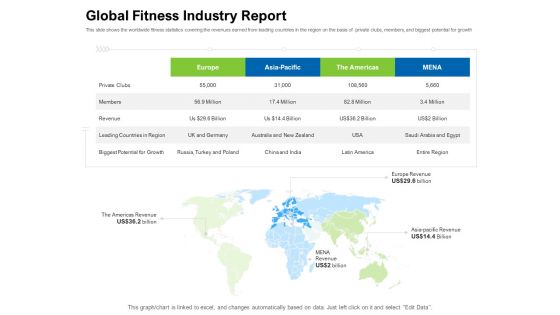
Strategies To Enter Physical Fitness Club Business Global Fitness Industry Report Template PDF
This slide shows the worldwide fitness statistics covering the revenues earned from leading countries in the region on the basis of private clubs, members, and biggest potential for growth. This is a strategies to enter physical fitness club business global fitness industry report template pdf template with various stages. Focus and dispense information on one stages using this creative set, that comes with editable features. It contains large content boxes to add your information on topics like private, members, revenue, industry. You can also showcase facts, figures, and other relevant content using this PPT layout. Grab it now.
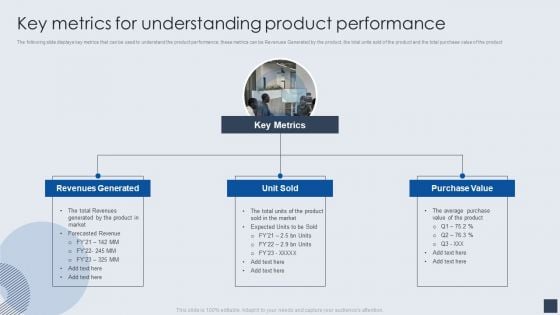
Key Metrics For Understanding Product Performance Clipart PDF
The following slide displays key metrics that can be used to understand the product performance, these metrics can be Revenues Generated by the product, the total units sold of the product and the total purchase value of the product. This is a Key Metrics For Understanding Product Performance Clipart PDF template with various stages. Focus and dispense information on three stages using this creative set, that comes with editable features. It contains large content boxes to add your information on topics like Revenues Generated, Unit Sold, Key Metrics, Purchase Value. You can also showcase facts, figures, and other relevant content using this PPT layout. Grab it now.
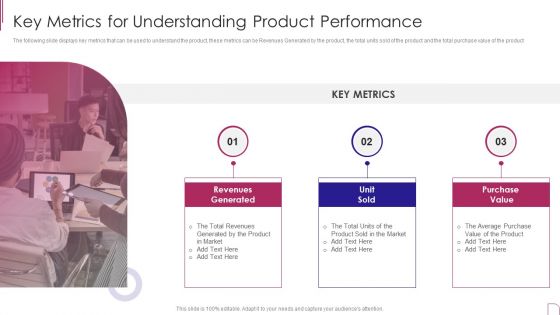
Yearly Product Performance Assessment Repor Key Metrics For Understanding Product Formats PDF
The following slide displays key metrics that can be used to understand the product, these metrics can be Revenues Generated by the product, the total units sold of the product and the total purchase value of the product.Presenting Yearly Product Performance Assessment Repor Key Metrics For Understanding Product Formats PDF to provide visual cues and insights. Share and navigate important information on three stages that need your due attention. This template can be used to pitch topics like Revenues Generated, Purchase Value, Generated Product In addtion, this PPT design contains high resolution images, graphics, etc, that are easily editable and available for immediate download.
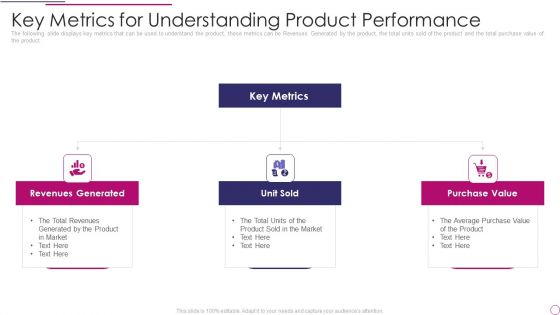
Performance Analysis Of New Product Development Key Metrics For Understanding Product Performance Themes PDF
The following slide displays key metrics that can be used to understand the product, these metrics can be Revenues Generated by the product, the total units sold of the product and the total purchase value of the product. This is a performance analysis of new product development key metrics for understanding product performance themes pdf template with various stages. Focus and dispense information on three stages using this creative set, that comes with editable features. It contains large content boxes to add your information on topics like revenues generated, unit sold, purchase value. You can also showcase facts, figures, and other relevant content using this PPT layout. Grab it now.
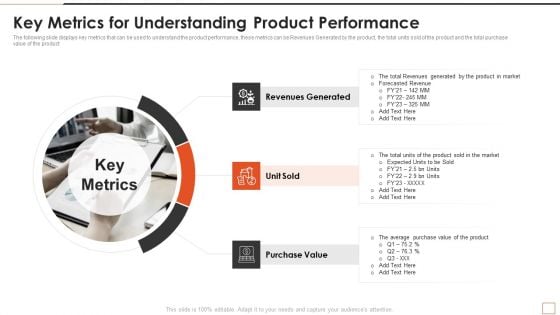
Developing New Product Messaging Canvas Determining Its USP Key Metrics For Understanding Product Brochure PDF
The following slide displays key metrics that can be used to understand the product performance, these metrics can be Revenues Generated by the product, the total units sold of the product and the total purchase value of the product Presenting developing new product messaging canvas determining its usp key metrics for understanding product brochure pdf to provide visual cues and insights. Share and navigate important information on three stages that need your due attention. This template can be used to pitch topics like value, purchase, revenues, market. In addtion, this PPT design contains high resolution images, graphics, etc, that are easily editable and available for immediate download.
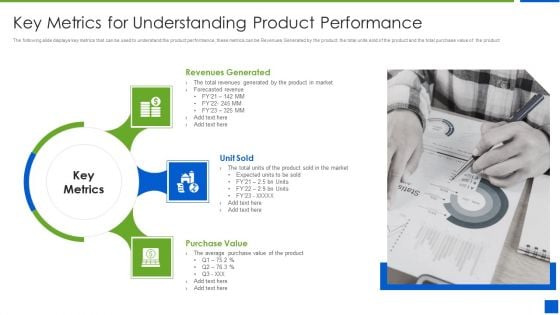
Improving Brand Recognition With Message And Differentiation Strategy Key Metrics For Understanding Product Sample PDF
The following slide displays key metrics that can be used to understand the product performance, these metrics can be Revenues Generated by the product, the total units sold of the product and the total purchase value of the product Presenting improving brand recognition with message and differentiation strategy key metrics for understanding product sample pdf to provide visual cues and insights. Share and navigate important information on three stages that need your due attention. This template can be used to pitch topics like revenues, generated, purchase, value, market . In addtion, this PPT design contains high resolution images, graphics, etc, that are easily editable and available for immediate download.
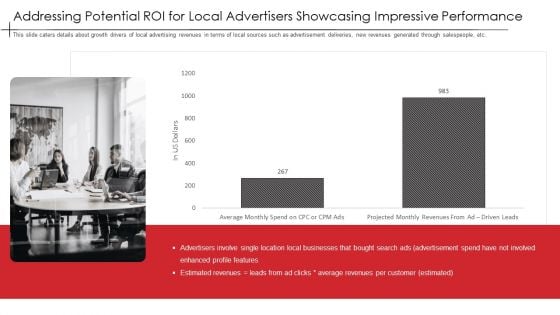
Addressing Potential Roi For Local Advertisers Showcasing Impressive Performance Infographics PDF
This slide caters details about growth drivers of local advertising revenues in terms of local sources such as advertisement deliveries, new revenues generated through salespeople, etc. Deliver and pitch your topic in the best possible manner with this addressing potential roi for local advertisers showcasing impressive performance infographics pdf. Use them to share invaluable insights on addressing potential roi for local advertisers showcasing impressive performance and impress your audience. This template can be altered and modified as per your expectations. So, grab it now.


 Continue with Email

 Home
Home


