Revenue Dashboard
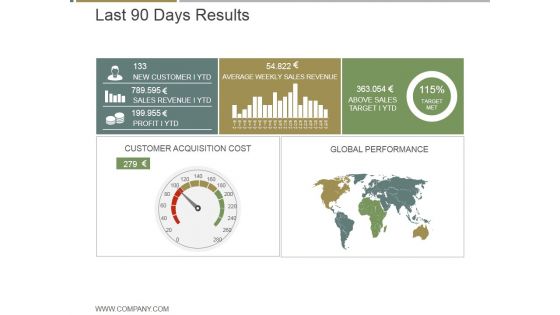
Last 90 Days Results Ppt PowerPoint Presentation Graphics
This is a last 90 days results ppt powerpoint presentation graphics. This is a five stage process. The stages in this process are new customer ytd, average weekly sales revenue, above sales target i ytd, customer acquisition cost, global performance.
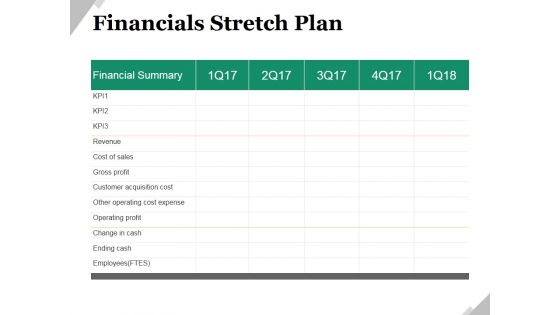
Financials Stretch Plan Ppt PowerPoint Presentation Ideas Shapes
This is a financials stretch plan ppt powerpoint presentation ideas shapes. This is a five stage process. The stages in this process are revenue, cost of sales, gross profit, customer acquisition cost, other operating cost expense, operating profit.
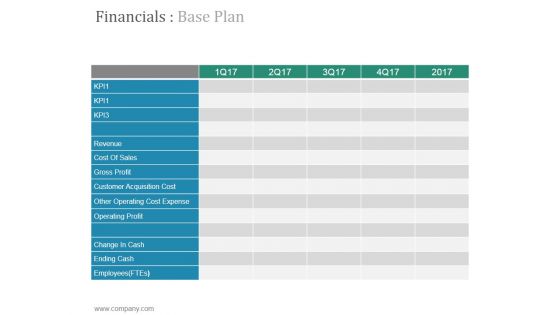
Financials Base Plan Ppt PowerPoint Presentation Portfolio
This is a financials base plan ppt powerpoint presentation portfolio. This is a five stage process. The stages in this process are revenue, cost of sales, gross profit, customer acquisition cost, other operating cost expense.
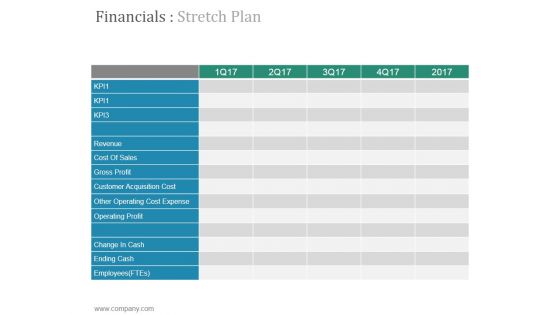
Financials Stretch Plan Ppt PowerPoint Presentation Designs
This is a financials stretch plan ppt powerpoint presentation designs. This is a five stage process. The stages in this process are revenue, cost of sales, gross profit, customer acquisition cost, other operating cost expense.
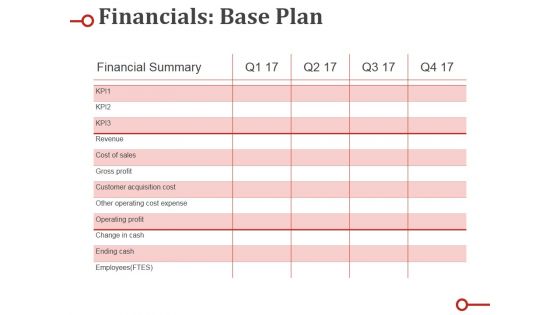
Financials Base Plan Ppt PowerPoint Presentation Portfolio Background Designs
This is a financials base plan ppt powerpoint presentation portfolio background designs. This is a four stage process. The stages in this process are revenue, cost of sales, gross profit, customer acquisition cost, other operating cost expense.
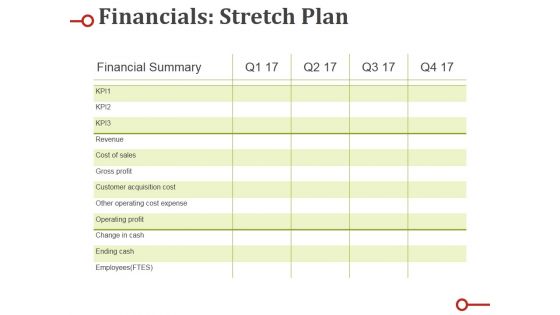
Financials Stretch Plan Ppt PowerPoint Presentation Show Designs Download
This is a financials stretch plan ppt powerpoint presentation show designs download. This is a four stage process. The stages in this process are revenue, cost of sales, gross profit, customer acquisition cost, other operating cost expense.
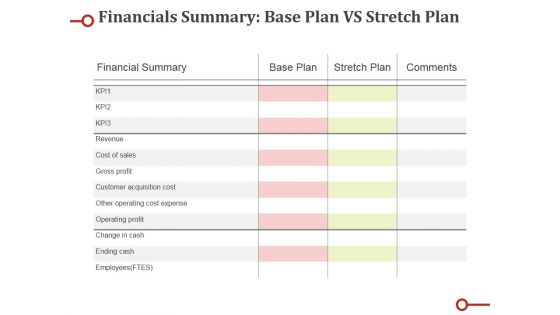
Financials Summary Base Plan Vs Stretch Plan Ppt PowerPoint Presentation Microsoft
This is a financials summary base plan vs stretch plan ppt powerpoint presentation microsoft. This is a three stage process. The stages in this process are revenue, cost of sales, gross profit, customer acquisition cost, other operating cost expense.
Calculating Customer Lifetime Value Clv Ppt PowerPoint Presentation Show Icon
This is a calculating customer lifetime value clv ppt powerpoint presentation show icon. This is a five stage process. The stages in this process are average acquisition cost, average customer revenue, average customer costs, average customer profit, customer retention rate.
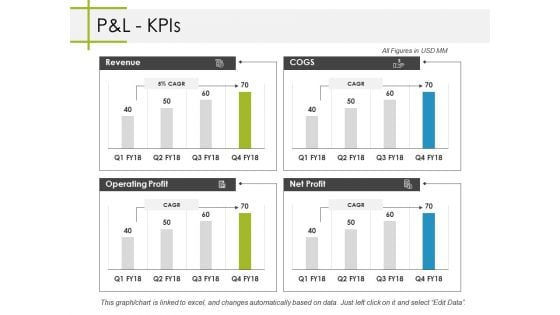
Pandl Kpis Ppt PowerPoint Presentation Professional Backgrounds
This is a pandl kpis ppt powerpoint presentation professional backgrounds. This is a four stage process. The stages in this process are business, revenue, operating profit, cogs, net profit.
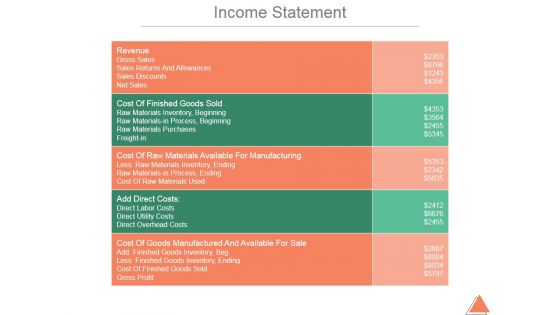
Income Statement Ppt PowerPoint Presentation Background Images
This is a income statement ppt powerpoint presentation background images. This is a five stage process. The stages in this process are revenue, gross sales, sales returns and allowances, sales discounts, net sales.
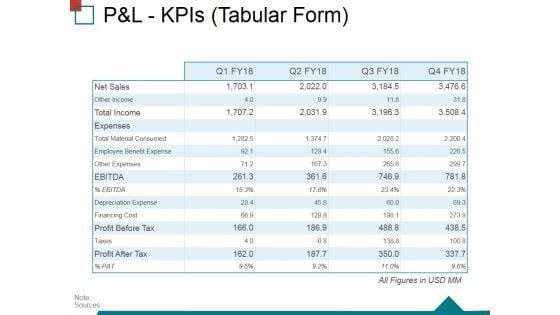
Pandl Kpis Tabular Form Ppt PowerPoint Presentation Ideas Structure
This is a pandl kpis tabular form ppt powerpoint presentation ideas structure. This is a four stage process. The stages in this process are operating profit, revenue, cogs, net profit.
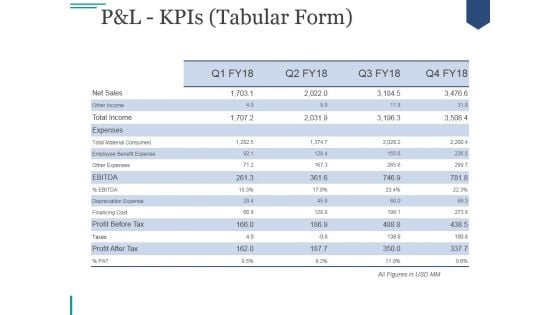
Pandl Kpis Tabular Form Ppt PowerPoint Presentation Visual Aids
This is a pandl kpis tabular form ppt powerpoint presentation visual aids. This is a four stage process. The stages in this process are revenue, cogs, operating profit, net profit.
Pandl Kpis Tabular Form Ppt PowerPoint Presentation Gallery Icon
This is a pandl kpis tabular form ppt powerpoint presentation gallery icon. This is a four stage process. The stages in this process are revenue, cogs, operating profit, net profit.
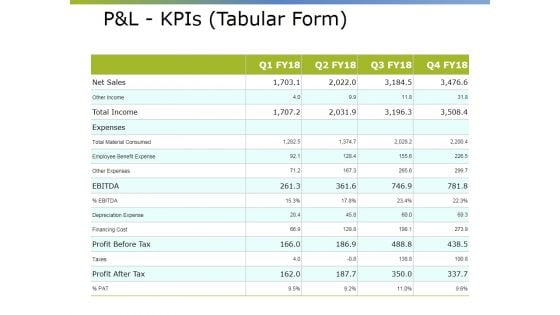
Pandl Kpis Tabular Form Ppt PowerPoint Presentation Pictures Visual Aids
This is a pandl kpis tabular form ppt powerpoint presentation pictures visual aids. This is a four stage process. The stages in this process are revenue, operating profit, cogs, net profit.
Pandl Kpis Template Ppt PowerPoint Presentation Model Icon
This is a pandl kpis template ppt powerpoint presentation model icon. This is a four stage process. The stages in this process are revenue, cogs, operating profit, net profit.
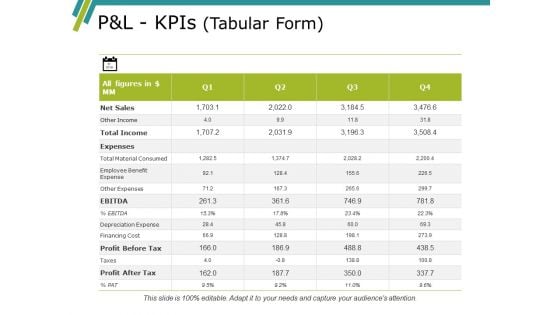
Pandl Kpis Template Ppt PowerPoint Presentation Gallery Summary
This is a pandl kpis template ppt powerpoint presentation gallery summary. This is a four stage process. The stages in this process are revenue, cogs, operating profit, net profit.
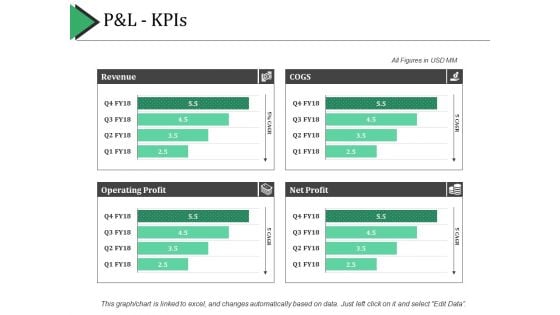
P And L Kpis Ppt PowerPoint Presentation Show Example Introduction
This is a p and l kpis ppt powerpoint presentation show example introduction. This is a four stage process. The stages in this process are revenue, cogs, net profit, operating profit.
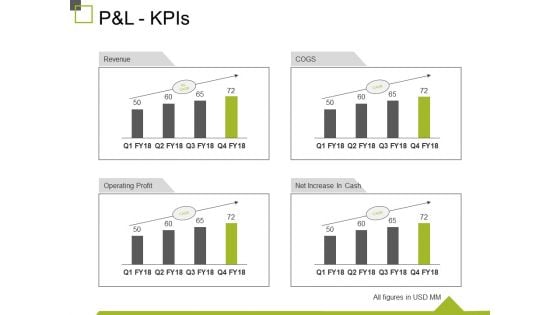
P And L Kpis Ppt PowerPoint Presentation Show Design Inspiration
This is a p and l kpis ppt powerpoint presentation show design inspiration. This is a four stage process. The stages in this process are revenue, operating profit, cogs, net increase in cash, business.

Types Of Data Monitored In Product Analytics Product Analytics Implementation Data Analytics V
This slide outlines major categories of data tracked using product analytics aimed at improving performance to increase business revenue. It covers categories such as event tracking as well as properties Are you searching for a Types Of Data Monitored In Product Analytics Product Analytics Implementation Data Analytics V that is uncluttered, straightforward, and original Its easy to edit, and you can change the colors to suit your personal or business branding. For a presentation that expresses how much effort you have put in, this template is ideal With all of its features, including tables, diagrams, statistics, and lists, its perfect for a business plan presentation. Make your ideas more appealing with these professional slides. Download Types Of Data Monitored In Product Analytics Product Analytics Implementation Data Analytics V from Slidegeeks today. This slide outlines major categories of data tracked using product analytics aimed at improving performance to increase business revenue. It covers categories such as event tracking as well as properties

Graph Illustrating Impact Of Prescriptive Analytics Data Analytics SS V
This slide showcases graph highlighting impact analysis of prescriptive analytics on businesses via use of major performance indicators. It provides information total revenue, inventory levels and labour costs with key insights.Take your projects to the next level with our ultimate collection of Graph Illustrating Impact Of Prescriptive Analytics Data Analytics SS V. Slidegeeks has designed a range of layouts that are perfect for representing task or activity duration, keeping track of all your deadlines at a glance. Tailor these designs to your exact needs and give them a truly corporate look with your own brand colors they will make your projects stand out from the rest This slide showcases graph highlighting impact analysis of prescriptive analytics on businesses via use of major performance indicators. It provides information total revenue, inventory levels and labour costs with key insights.
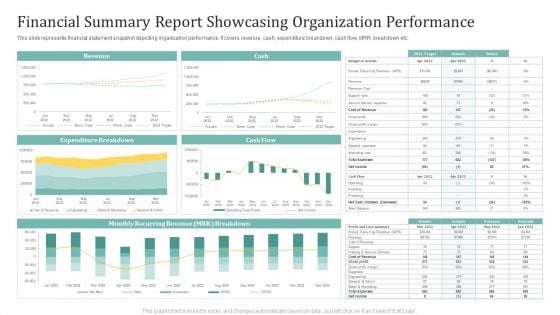
Financial Summary Report Showcasing Organization Performance Ppt Show Skills PDF
This slide represents financial statement snapshot depicting organization performance. It covers revenue, cash, expenditure breakdown, cash flow, MRR breakdown etc. Showcasing this set of slides titled Financial Summary Report Showcasing Organization Performance Ppt Show Skills PDF. The topics addressed in these templates are Revenue, Cash, Expenditure Breakdown. All the content presented in this PPT design is completely editable. Download it and make adjustments in color, background, font etc. as per your unique business setting.
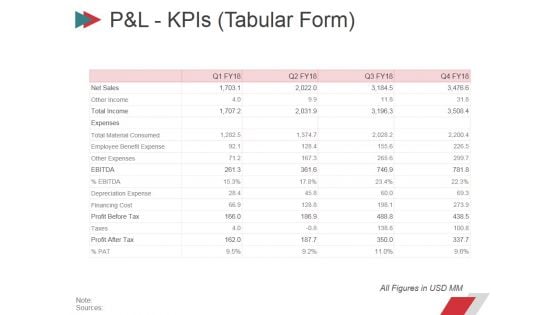
Pandl Kpis Tabular Form Ppt PowerPoint Presentation Summary Layout
This is a pandl kpis tabular form ppt powerpoint presentation summary layout. This is a four stage process. The stages in this process are revenue, cogs, operating profit, net profit.
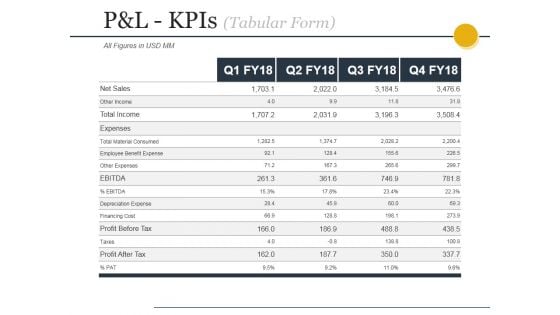
Pandl Kpis Tabular Form Ppt PowerPoint Presentation File Design Templates
This is a pandl kpis tabular form ppt powerpoint presentation file design templates. This is a four stage process. The stages in this process are revenue, cogs, operating profit, net profit.
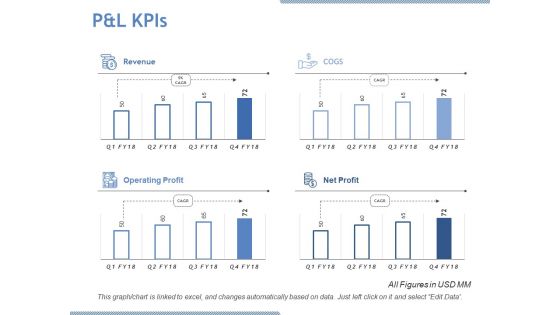
P And L Kpis Ppt PowerPoint Presentation Designs Download
This is a p and l kpis ppt powerpoint presentation designs download. This is a four stage process. The stages in this process are revenue, cogs, operating profit, net profit.
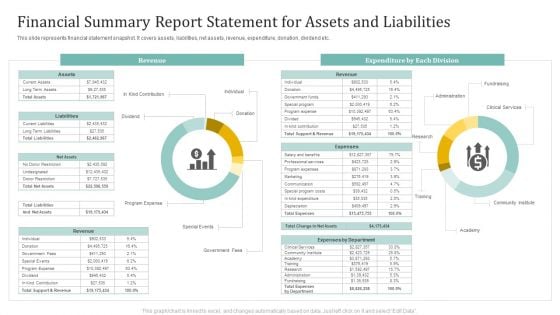
Financial Summary Report Statement For Assets And Liabilities Ppt Slides Guide PDF
This slide represents financial statement snapshot. It covers assets, liabilities, net assets, revenue, expenditure, donation, dividend etc. Pitch your topic with ease and precision using this Financial Summary Report Statement For Assets And Liabilities Ppt Slides Guide PDF. This layout presents information on Revenue, Expenditure Each Division, Fundraising. It is also available for immediate download and adjustment. So, changes can be made in the color, design, graphics or any other component to create a unique layout.
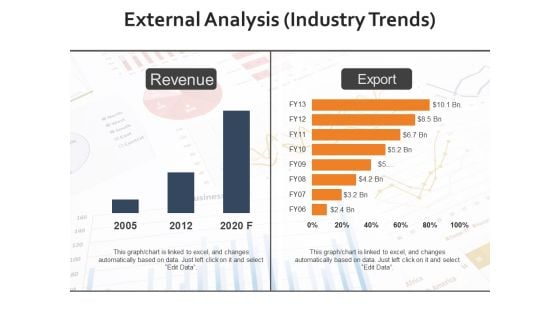
External Analysis Industry Trends Ppt PowerPoint Presentation Infographic Template Visuals
This is a external analysis industry trends ppt powerpoint presentation infographic template visuals. This is a two stage process. The stages in this process are export, revenue, percentage, years, business, analysis.
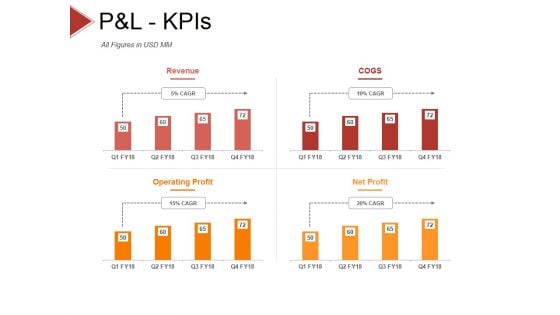
P And L Kpis Template 2 Ppt PowerPoint Presentation Styles Objects
This is a p and l kpis template 2 ppt powerpoint presentation styles objects. This is a four stage process. The stages in this process are revenue, cogs, operating profit, net profit.

P And L Kpis Template 1 Ppt PowerPoint Presentation Model Inspiration
This is a p and l kpis template 1 ppt powerpoint presentation model inspiration. This is a four stage process. The stages in this process are revenue, cogs, operating profit, net profit.
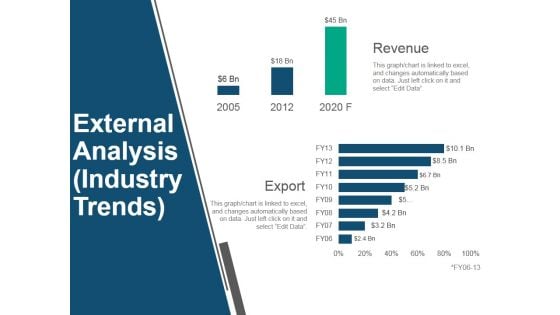
External Analysis Industry Trends Ppt PowerPoint Presentation Inspiration Portfolio
This is a external analysis industry trends ppt powerpoint presentation inspiration portfolio. This is a two stage process. The stages in this process are revenue, export, business, marketing, presentation.
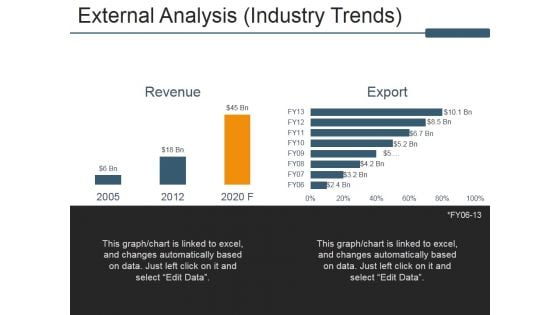
External Analysis Industry Trends Ppt PowerPoint Presentation Infographic Template Summary
This is a external analysis industry trends ppt powerpoint presentation infographic template summary. This is a two stage process. The stages in this process are revenue, export, external analysis, business, marketing.
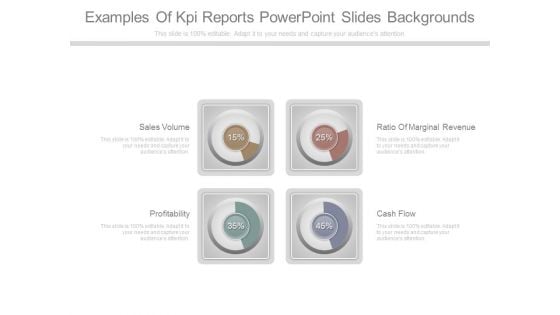
Examples Of Kpi Reports Powerpoint Slides Backgrounds
This is a examples of kpi reports powerpoint slides backgrounds. This is a four stage process. The stages in this process are sales volume, profitability, ratio of marginal revenue, cash flow.
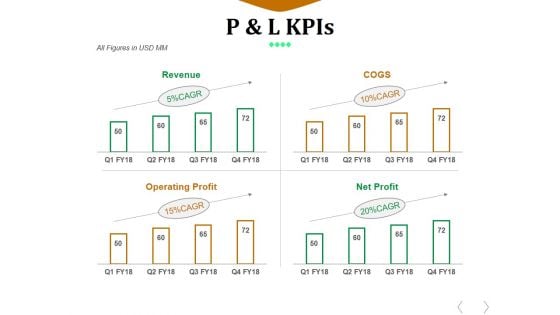
P And L Kpis Template 1 Ppt PowerPoint Presentation Design Ideas
This is a p and l kpis template 1 ppt powerpoint presentation design ideas. This is a four stage process. The stages in this process are revenue, cogs, operating profit, net profit.
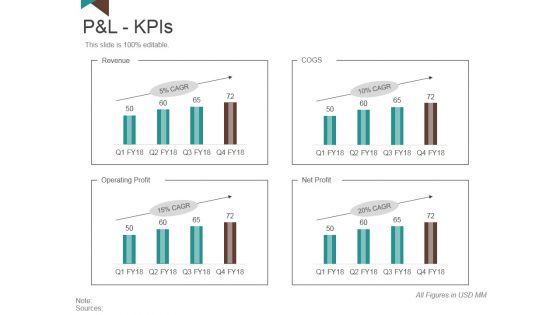
P And L Kpis Template 1 Ppt PowerPoint Presentation Slides Model
This is a p and l kpis template 1 ppt powerpoint presentation slides model. This is a four stage process. The stages in this process are revenue, operating profit, net profit, cogs.
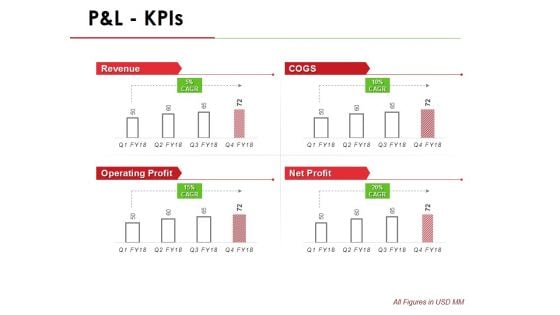
P And L Kpis Template 1 Ppt PowerPoint Presentation Infographic Template Outline
This is a p and l kpis template 1 ppt powerpoint presentation infographic template outline. This is a four stage process. The stages in this process are revenue, operating profit, cogs, net profit.
P And L Kpis Template 2 Ppt PowerPoint Presentation Summary Icon
This is a p and l kpis template 2 ppt powerpoint presentation summary icon. This is a four stage process. The stages in this process are revenue, cogs, operating profit, net profit.
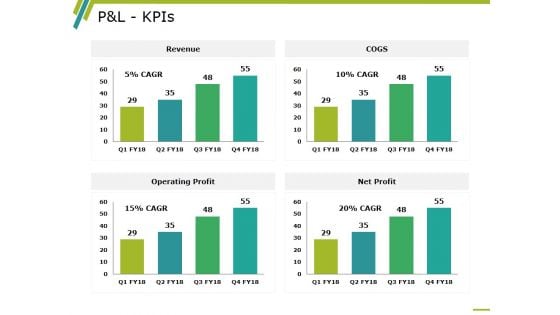
P And L Kpis Template 2 Ppt PowerPoint Presentation Professional Information
This is a p and l kpis template 2 ppt powerpoint presentation professional information. This is a four stage process. The stages in this process are revenue, operating profit, cogs, net profit, business.
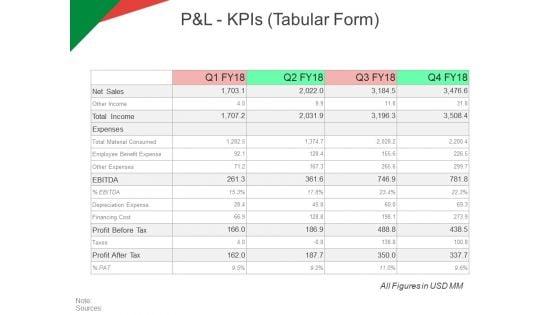
P And L Kpis Tabular Form Ppt PowerPoint Presentation Model Ideas
This is a p and l kpis tabular form ppt powerpoint presentation model ideas. This is a four stage process. The stages in this process are revenue, operating profit, cogs, net profit.
New Commodity Development Assessment Metrics Icons PDF
The following slide highlights the key metrics to evaluate product performance. It includes elements such as product wise revenue, time to the market etc.Pitch your topic with ease and precision using this New Commodity Development Assessment Metrics Icons PDF. This layout presents information on Annual Product, Wise Revenue, Shown Continuous. It is also available for immediate download and adjustment. So, changes can be made in the color, design, graphics or any other component to create a unique layout.
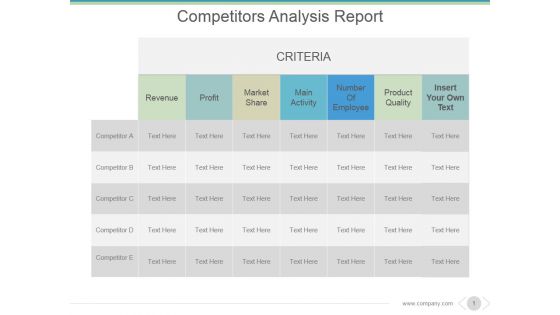
Competitors Analysis Report Ppt PowerPoint Presentation Introduction
This is a competitors analysis report ppt powerpoint presentation introduction. This is a seven stage process. The stages in this process are criteria, revenue, profit, market share, main activity, number of employee.
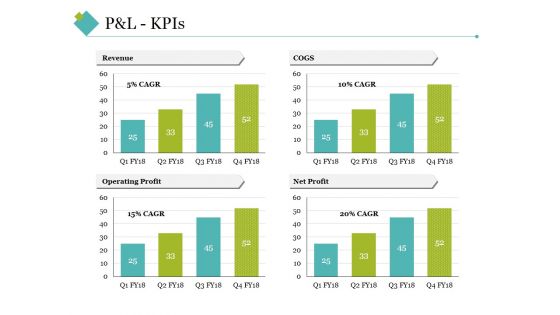
P And L Kpis Template 2 Ppt PowerPoint Presentation Inspiration Grid
This is a p and l kpis template 2 ppt powerpoint presentation inspiration grid. This is a four stage process. The stages in this process are revenue, cogs, operating profit, net profit.
Campaign Report Ppt PowerPoint Presentation Icon Visuals
This is a campaign report ppt powerpoint presentation icon visuals. This is a ten stage process. The stages in this process are email name, send date time, recipients, delivered, spam, opt out, revenue.
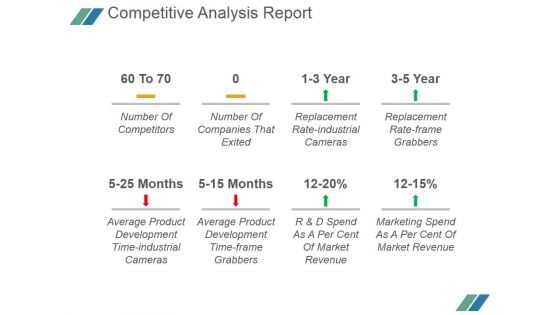
Competitive Analysis Report Ppt PowerPoint Presentation Tips
This is a competitive analysis report ppt powerpoint presentation tips. This is a eight stage process. The stages in this process are number of competitors, number of companies that exited, replacement rate industrial cameras, replacement rate frame grabbers, average product development time industrial cameras, average product development time frame grabbers, r and d spend as a per cent of market revenue, marketing spend as a per cent of market revenue.
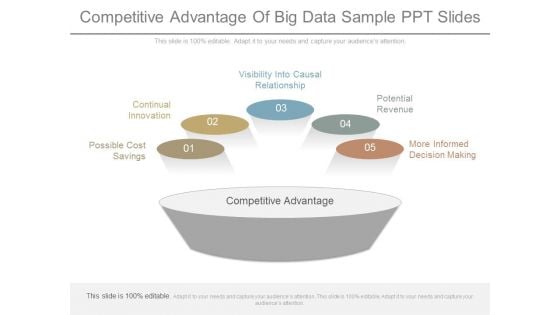
Competitive Advantage Of Big Data Sample Ppt Slides
This is a competitive advantage of big data sample ppt slides. This is a five stage process. The stages in this process are possible cost savings, continual innovation, visibility into causal relationship, potential revenue, more informed decision making, competitive advantage.
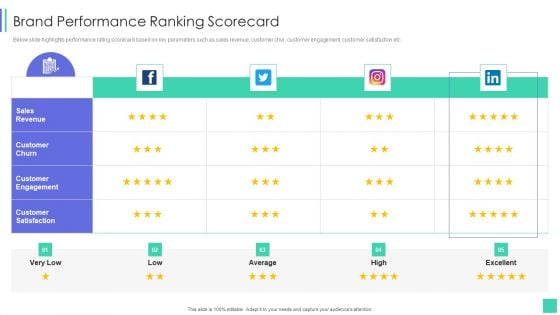
Linkedin Marketing For New Ventures Brand Performance Ranking Scorecard Infographics PDF
Below slide highlights performance rating scorecard based on key parameters such as sales revenue, customer chur, customer engagement, customer satisfaction etc.Deliver an awe inspiring pitch with this creative Linkedin Marketing For New Ventures Brand Performance Ranking Scorecard Infographics PDF bundle. Topics like Sales Revenue, Customer Engagement, Customer Satisfaction can be discussed with this completely editable template. It is available for immediate download depending on the needs and requirements of the user.
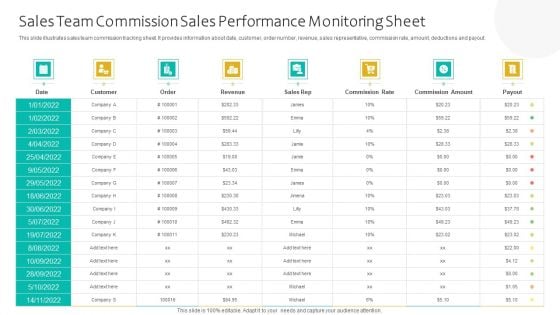
Sales Team Commission Sales Performance Monitoring Sheet Ppt Infographic Template Microsoft PDF
This slide illustrates sales team commission tracking sheet. It provides information about date, customer, order number, revenue, sales representative, commission rate, amount, deductions and payout. Showcasing this set of slides titled Sales Team Commission Sales Performance Monitoring Sheet Ppt Infographic Template Microsoft PDF. The topics addressed in these templates are Customer, Revenue, Sales Rep, Commission Amount. All the content presented in this PPT design is completely editable. Download it and make adjustments in color, background, font etc. as per your unique business setting.
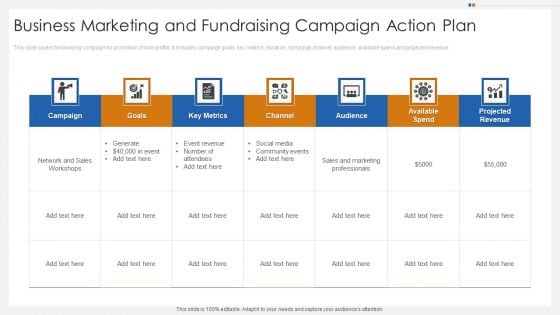
Business Marketing And Fundraising Campaign Action Plan Clipart PDF
This slide covers fundraising campaign for promotion of non profits. It includes campaign goals, key metrics, duration, campaign channel, audience, available spend and projected revenue. Showcasing this set of slides titled Business Marketing And Fundraising Campaign Action Plan Clipart PDF. The topics addressed in these templates are Goals, Key Metrics, Projected Revenue. All the content presented in this PPT design is completely editable. Download it and make adjustments in color, background, font etc. as per your unique business setting.
Operation And Financials Forecast Management Vs Consensus Ppt Infographic Template Icons PDF
The slide provides the operations and financials forecast of the company by the management and Consensus. Key heads includes revenue, interest income, non-performing assets, total assets etc. Deliver an awe-inspiring pitch with this creative operation and financials forecast management vs consensus ppt infographic template icons pdf bundle. Topics like interest income, revenue, non performing assets can be discussed with this completely editable template. It is available for immediate download depending on the needs and requirements of the user.
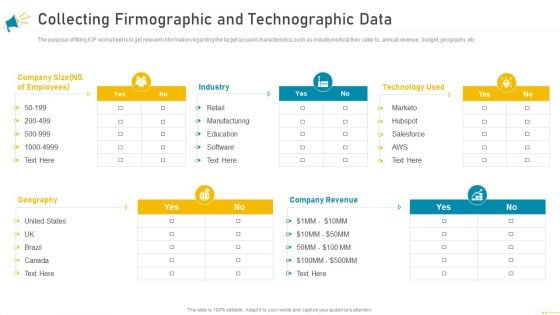
Key Account Marketing Approach Collecting Firmographic And Technographic Data Portrait PDF
The purpose of filling ICP worksheet is to get relevant information regarding the target account characteristics such as industry or vertical they cater to, annual revenue, budget, geography, etc. Deliver an awe inspiring pitch with this creative key account marketing approach collecting firmographic and technographic data portrait pdf bundle. Topics like industry, technology used, company revenue, geography can be discussed with this completely editable template. It is available for immediate download depending on the needs and requirements of the user.
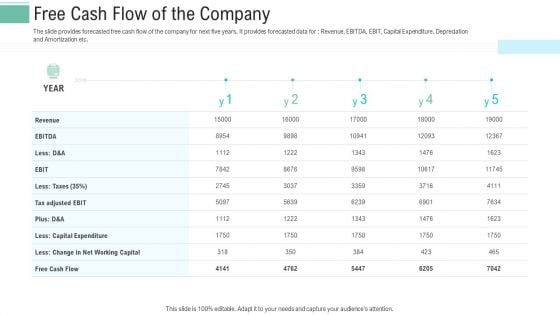
Pitch Presentation Raise Money Spot Market Free Cash Flow Of The Company Ppt Outline Model PDF
The slide provides forecasted free cash flow of the company for next five years. It provides forecasted data for Revenue, EBITDA, EBIT, Capital Expenditure, Depreciation and Amortization etc. Deliver an awe-inspiring pitch with this creative pitch presentation raise money spot market free cash flow of the company ppt outline model pdf bundle. Topics like revenue, net working capital, capital expenditure can be discussed with this completely editable template. It is available for immediate download depending on the needs and requirements of the user.
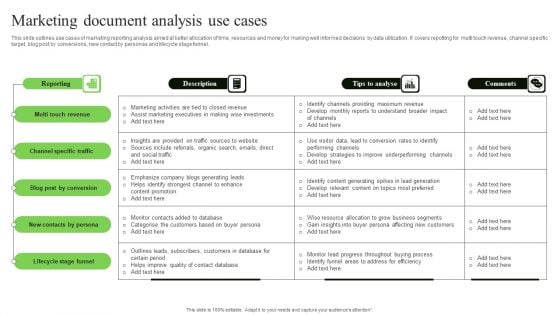
Marketing Document Analysis Use Cases Topics PDF
This slide outlines use cases of marketing reporting analysis aimed at better allocation of time, resources and money for making well informed decisions by data utilization. It covers repotting for multi touch revenue, channel specific target, blog post by conversions, new contact by personas and lifecycle stage funnel. Showcasing this set of slides titled Marketing Document Analysis Use Cases Topics PDF. The topics addressed in these templates are Multi Touch Revenue, Channel Specific Traffic, Blog Post Conversion. All the content presented in this PPT design is completely editable. Download it and make adjustments in color, background, font etc. as per your unique business setting.
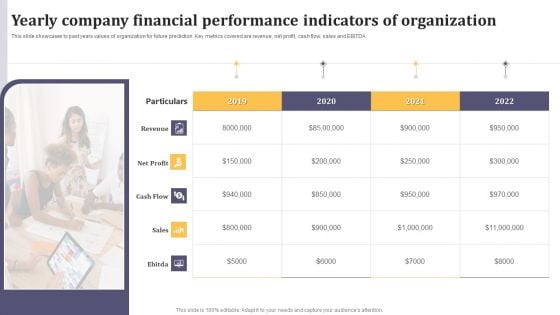
Yearly Company Financial Performance Indicators Of Organization Ppt Infographics Outline PDF
This slide showcases to past years values of organization for future prediction. Key metrics covered are revenue, net profit, cash flow, sales and EBITDA. Persuade your audience using this Yearly Company Financial Performance Indicators Of Organization Ppt Infographics Outline PDF. This PPT design covers five stages, thus making it a great tool to use. It also caters to a variety of topics including Revenue, Net Profit, Cash Flow. Download this PPT design now to present a convincing pitch that not only emphasizes the topic but also showcases your presentation skills.
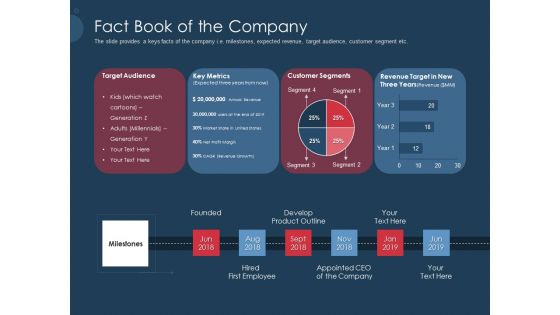
Pitch Deck To Gather Funding From Initial Capital Fact Book Of The Company Slides PDF
The slide provides a keys facts of the company i.e. milestones, expected revenue, target audience, customer segment etc. Deliver an awe inspiring pitch with this creative pitch deck to gather funding from initial capital fact book of the company slides pdf bundle. Topics like revenue, target audience, key metrics, customer segments, develop can be discussed with this completely editable template. It is available for immediate download depending on the needs and requirements of the user.
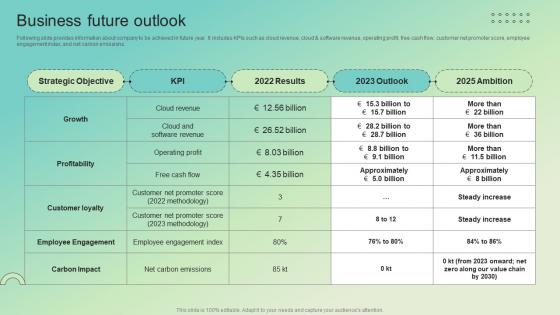
Business Future Outlook Enterprise Software Solution Providing Company Profile CP SS V
Following slide provides information about company to be achieved in future year. It includes KPIs such as cloud revenue, cloud and software revenue, operating profit, free cash flow, customer net promoter score, employee engagement index, and net carbon emissions.Boost your pitch with our creative Business Future Outlook Enterprise Software Solution Providing Company Profile CP SS V. Deliver an awe-inspiring pitch that will mesmerize everyone. Using these presentation templates you will surely catch everyones attention. You can browse the ppts collection on our website. We have researchers who are experts at creating the right content for the templates. So you do not have to invest time in any additional work. Just grab the template now and use them. Following slide provides information about company to be achieved in future year. It includes KPIs such as cloud revenue, cloud and software revenue, operating profit, free cash flow, customer net promoter score, employee engagement index, and net carbon emissions.
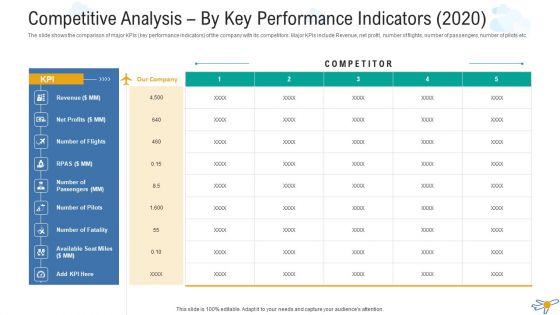
Competitive Analysis By Key Performance Indicators 2020 Inspiration PDF
The slide shows the comparison of major KPIs key performance indicators of the company with its competitors. Major KPIs include Revenue, net profit, number of flights, number of passengers, number of pilots etc. Deliver and pitch your topic in the best possible manner with this competitive analysis by key performance indicators 2020 inspiration pdf. Use them to share invaluable insights on comparison, revenue, net profit, number of flights, number of passengers and impress your audience. This template can be altered and modified as per your expectations. So, grab it now.
Pitch Deck For Seed Financing Fact Book Of The Company Ppt Icon Example Introduction PDF
The slide provides a keys facts of the company i.e. milestones, expected revenue, target audience, customer segment etc. Deliver an awe inspiring pitch with this creative pitch deck for seed financing fact book of the company ppt icon example introduction pdf bundle. Topics like revenue, target audience, key metrics, customer segments, develop can be discussed with this completely editable template. It is available for immediate download depending on the needs and requirements of the user.
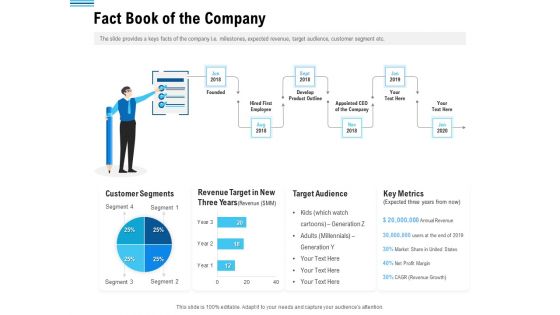
Pitch Deck To Collect Funding From Initial Financing Fact Book Of The Company Themes PDF
The slide provides a keys facts of the company i.e. milestones, expected revenue, target audience, customer segment etc. Deliver an awe inspiring pitch with this creative pitch deck to collect funding from initial financing fact book of the company themes pdf bundle. Topics like revenue, target audience, key metrics, customer segments, develop can be discussed with this completely editable template. It is available for immediate download depending on the needs and requirements of the user.
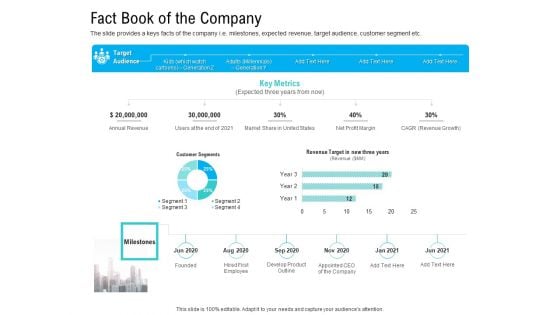
Pre Seed Funding Pitch Deck Fact Book Of The Company Ppt Styles Introduction PDF
The slide provides a keys facts of the company i.e. milestones, expected revenue, target audience, customer segment etc. Deliver an awe inspiring pitch with this creative pre seed funding pitch deck fact book of the company ppt styles introduction pdf bundle. Topics like revenue, target audience, key metrics, customer segments, develop can be discussed with this completely editable template. It is available for immediate download depending on the needs and requirements of the user.
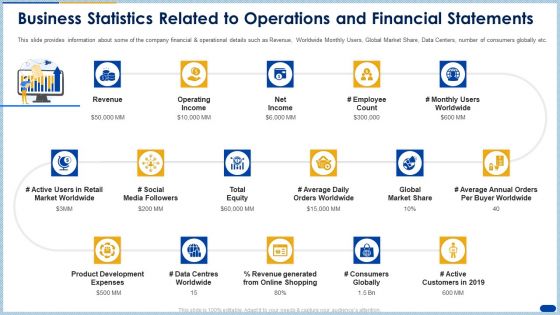
Business Statistics Related To Operations And Financial Statements Themes PDF
This slide provides information about some of the company financial and operational details such as Revenue, Worldwide Monthly Users, Global Market Share, Data Centers, number of consumers globally etc. Deliver an awe inspiring pitch with this creative business statistics related to operations and financial statements themes pdf bundle. Topics like revenue, operating income, product development expenses, net income, market share can be discussed with this completely editable template. It is available for immediate download depending on the needs and requirements of the user.
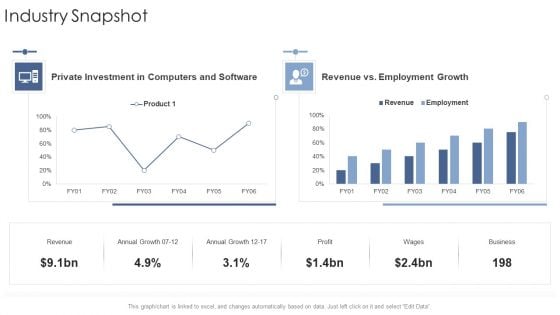
Industry Snapshot Annual Startup Business Strategy Ppt Portfolio Graphics Template PDF
Deliver and pitch your topic in the best possible manner with this industry snapshot annual startup business strategy ppt portfolio graphics template pdf. Use them to share invaluable insights on revenue, growth, business, profit and impress your audience. This template can be altered and modified as per your expectations. So, grab it now.
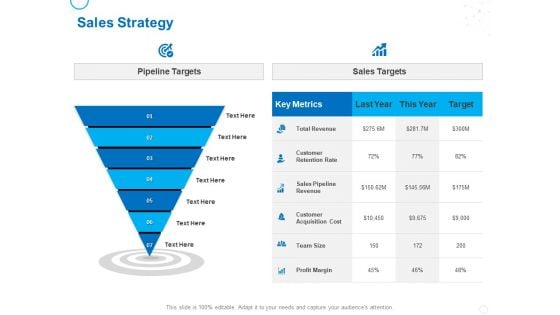
Service Strategy And Service Lifecycle Implementation Sales Strategy Ppt Layouts Master Slide PDF
Presenting this set of slides with name service strategy and service lifecycle implementation sales strategy ppt layouts master slide pdf. This is a seven stage process. The stages in this process are pipeline targets, sales targets, key metrics, customer retention rate, sales pipeline revenue, sales pipeline revenue, customer acquisition cost, team size, profit margin. This is a completely editable PowerPoint presentation and is available for immediate download. Download now and impress your audience.


 Continue with Email

 Home
Home


