Revenue Dashboard
Pie Chart With Coins Finance PowerPoint Templates And PowerPoint Backgrounds 0811
Microsoft PowerPoint Template and Background with pie chart with coins and statistic data Facilitate your discourse with our Pie Chart With Coins Finance PowerPoint Templates And PowerPoint Backgrounds 0811. Add to the amenities at your command.
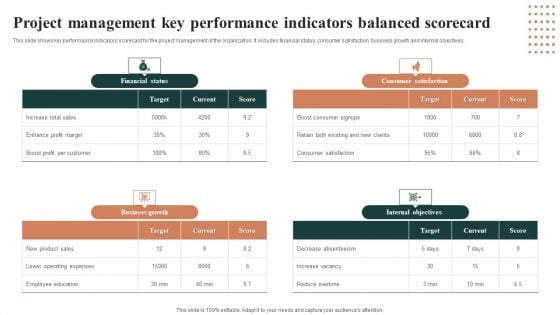
Project Management Key Performance Indicators Balanced Scorecard Introduction PDF
This slide shows key performance indicators scorecard for the project management of the organization. It includes financial status, consumer satisfaction, business growth and internal objectives. Pitch your topic with ease and precision using this Project Management Key Performance Indicators Balanced Scorecard Introduction PDF. This layout presents information on Financial Status, Business Growth, Consumer Satisfaction. It is also available for immediate download and adjustment. So, changes can be made in the color, design, graphics or any other component to create a unique layout.
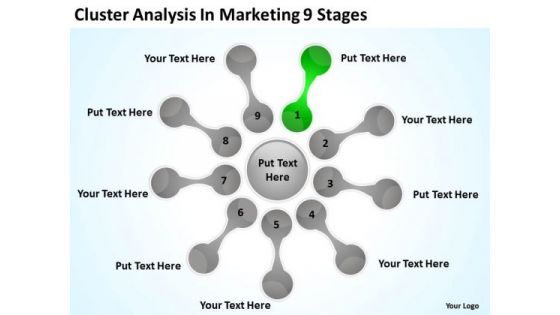
Cluster Analysis In Marketing 9 Stages Basic Business Plan Outline PowerPoint Templates
We present our cluster analysis in marketing 9 stages basic business plan outline PowerPoint templates.Present our Process and Flows PowerPoint Templates because It is Aesthetically crafted by artistic young minds. Our PowerPoint Templates and Slides are designed to display your dexterity. Download our Flow Charts PowerPoint Templates because Our PowerPoint Templates and Slides will give you great value for your money. Be assured of finding the best projection to highlight your words. Use our Marketing PowerPoint Templates because Our PowerPoint Templates and Slides will weave a web of your great ideas. They are gauranteed to attract even the most critical of your colleagues. Download our Shapes PowerPoint Templates because It will let you Set new benchmarks with our PowerPoint Templates and Slides. They will keep your prospects well above par. Use our Business PowerPoint Templates because They will Put your wonderful verbal artistry on display. Our PowerPoint Templates and Slides will provide you the necessary glam and glitter.Use these PowerPoint slides for presentations relating to Mapping, vector, chart, flow, flowchart, process, model, step, tool, blank, processdiagram, concept, topic, presentation, relate, circle, graphic, data, report, marketing, idea, circlepattern, team, management, graph, cycle, illustration, connection, processchart,direction, plans, color, text, phase, organization, control, connect, link, explanation, mapping, present. The prominent colors used in the PowerPoint template are Gray, Green, White. Our Cluster Analysis In Marketing 9 Stages Basic Business Plan Outline PowerPoint Templates create presentations that blow your audience away. With our money back guarantee you have nothing to lose.
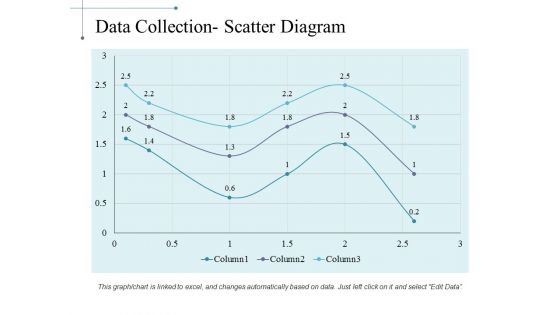
Data Collection Scatter Diagram Ppt PowerPoint Presentation Summary Deck
This is a data collection scatter diagram ppt powerpoint presentation summary deck. This is a three stage process. The stages in this process are business, marketing, strategy, finance, analysis.
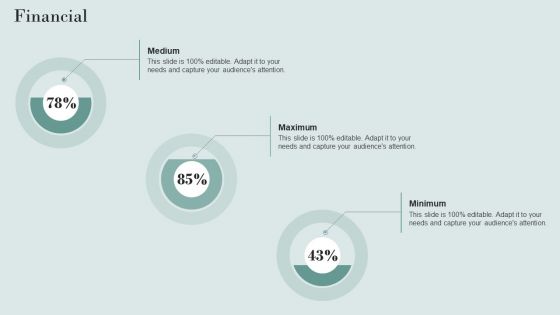
Data Structure IT Financial Clipart PDF
If your project calls for a presentation, then Slidegeeks is your go-to partner because we have professionally designed, easy-to-edit templates that are perfect for any presentation. After downloading, you can easily edit Data Structure IT Financial Clipart PDF and make the changes accordingly. You can rearrange slides or fill them with different images. Check out all the handy templates

Key Strategies For PPC Pay Per Click Marketing Accelerating Market Share And Profitability MKT SS V
This slides showcases the effective PPC marketing strategies to increase conversion rate. It includes techniques such as target specific audience, utilize negative keywords, create ad groups, ad extension, AB testing, remarketing, campaign optimization and landing page optimization. The Key Strategies For PPC Pay Per Click Marketing Accelerating Market Share And Profitability MKT SS V is a compilation of the most recent design trends as a series of slides. It is suitable for any subject or industry presentation, containing attractive visuals and photo spots for businesses to clearly express their messages. This template contains a variety of slides for the user to input data, such as structures to contrast two elements, bullet points, and slides for written information. Slidegeeks is prepared to create an impression. This slides showcases the effective PPC marketing strategies to increase conversion rate. It includes techniques such as target specific audience, utilize negative keywords, create ad groups, ad extension, AB testing, remarketing, campaign optimization and landing page optimization
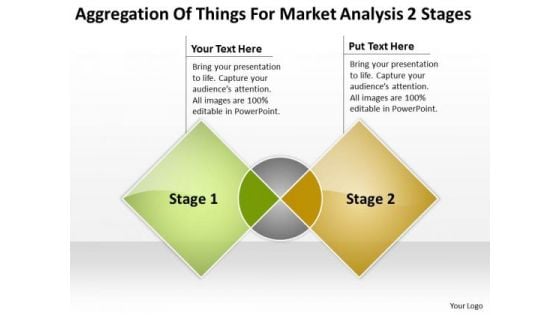
Things For Market Analysis 2 Stages How To Do Business Plan PowerPoint Templates
We present our things for market analysis 2 stages how to do business plan PowerPoint templates.Download and present our Process and Flows PowerPoint Templates because You have the co-ordinates for your destination of success. Let our PowerPoint Templates and Slides map out your journey. Download our Business PowerPoint Templates because Timeline crunches are a fact of life. Meet all deadlines using our PowerPoint Templates and Slides. Present our Marketing PowerPoint Templates because Our PowerPoint Templates and Slides are like the strings of a tennis racquet. Well strung to help you serve aces. Present our Flow Charts PowerPoint Templates because Our PowerPoint Templates and Slides will Embellish your thoughts. They will help you illustrate the brilliance of your ideas. Download and present our Future PowerPoint Templates because Our PowerPoint Templates and Slides ensures Effective communication. They help you put across your views with precision and clarity.Use these PowerPoint slides for presentations relating to Vector, sign, icon, market, isolated, green, white, corporate, business, concept, success, symbol, diagram, graphic, finance, data, element, drawing, report, shape, abstract, illustration, strategy, money, design, growth, colorful, progress, part, information, background, investment, financial, communication . The prominent colors used in the PowerPoint template are Green lime, Gray, Orange. Charge to success with our Things For Market Analysis 2 Stages How To Do Business Plan PowerPoint Templates. You will come out on top.
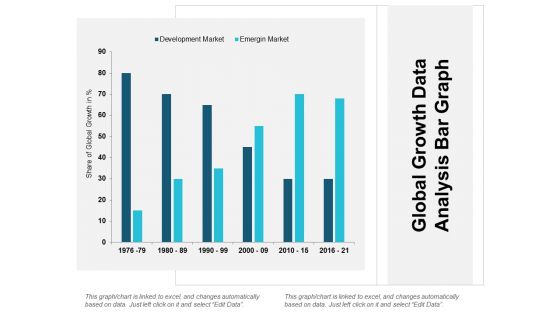
Global Growth Data Analysis Bar Graph Ppt Powerpoint Presentation Infographic Template Outfit
This is a global growth data analysis bar graph ppt powerpoint presentation infographic template outfit. The topics discussed in this diagram are market growth, market opportunity, market profitability. This is a completely editable PowerPoint presentation, and is available for immediate download.
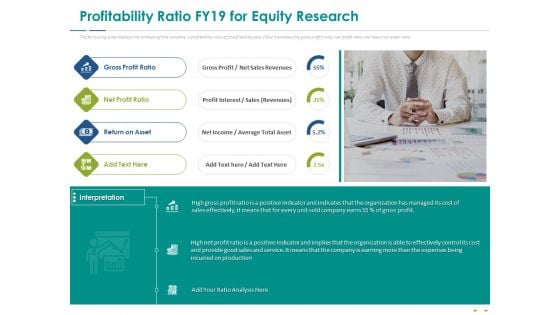
Stock Market Research Report Profitability Ratio FY19 For Equity Research Ideas PDF
The following slide displays the analysis of the companys profitability ratio of the financial year 19 as it analysis the gross profit ratio, net profit ratio and return on asset ratio. This is a stock market research report profitability ratio fy19 for equity research ideas pdf template with various stages. Focus and dispense information on four stages using this creative set, that comes with editable features. It contains large content boxes to add your information on topics like gross profit ratio, net profit ratio, return on asset, net income. You can also showcase facts, figures, and other relevant content using this PPT layout. Grab it now.
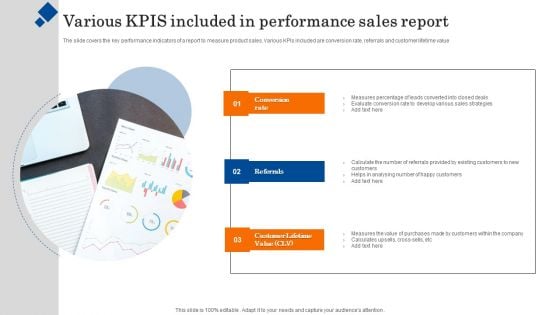
Various Kpis Included In Performance Sales Report Graphics PDF
The slide covers the key performance indicators of a report to measure product sales. Various KPIs included are conversion rate, referrals and customer lifetime value. Persuade your audience using this Various Kpis Included In Performance Sales Report Graphics PDF. This PPT design covers three stages, thus making it a great tool to use. It also caters to a variety of topics including Conversion Rate, Referrals, Customer Lifetime Value. Download this PPT design now to present a convincing pitch that not only emphasizes the topic but also showcases your presentation skills.
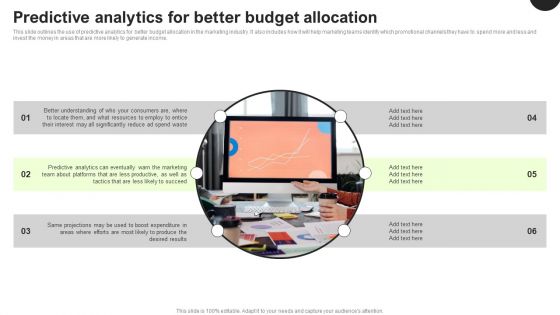
Predictive Analytics In The Age Of Big Data Predictive Analytics For Better Budget Allocation Inspiration PDF
This slide outlines the use of predictive analytics for better budget allocation in the marketing industry. It also includes how it will help marketing teams identify which promotional channels they have to spend more and less and invest the money in areas that are more likely to generate income. Make sure to capture your audiences attention in your business displays with our gratis customizable Predictive Analytics In The Age Of Big Data Predictive Analytics For Better Budget Allocation Inspiration PDF. These are great for business strategies, office conferences, capital raising or task suggestions. If you desire to acquire more customers for your tech business and ensure they stay satisfied, create your own sales presentation with these plain slides.

The Solution Ppt PowerPoint Presentation Portfolio Background
This is a the solution ppt powerpoint presentation portfolio background. This is a three stage process. The stages in this process are save time, save money, save energy, the solution.
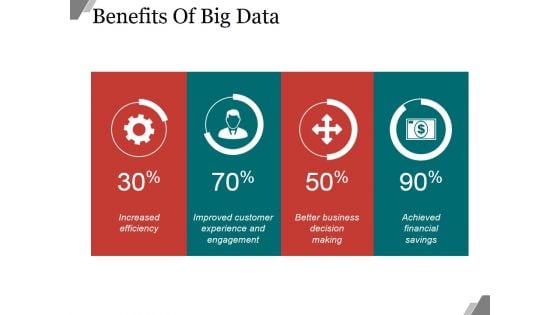
Benefits Of Big Data Ppt PowerPoint Presentation Example 2015
This is a benefits of big data ppt powerpoint presentation example 2015. This is a four stage process. The stages in this process are business, marketing, success, finance, analysis.
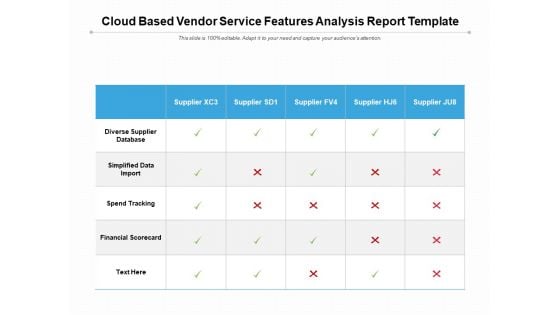
Cloud Based Vendor Service Features Analysis Report Template Ppt PowerPoint Presentation Slides Clipart Images PDF
Pitch your topic with ease and precision using this cloud based vendor service features analysis report template ppt powerpoint presentation slides clipart images pdf. This layout presents information on diverse supplier database, simplified data import, spend tracking, financial scorecard. It is also available for immediate download and adjustment. So, changes can be made in the color, design, graphics or any other component to create a unique layout.
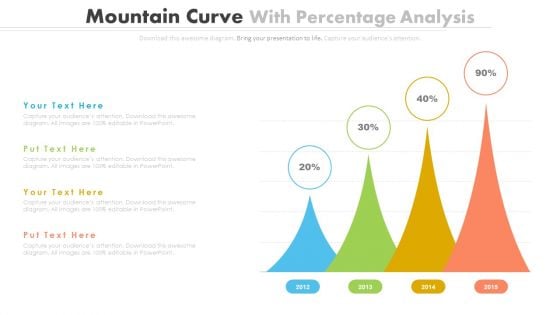
Percentage Data Growth Chart Powerpoint Slides
This PowerPoint template has been designed with percentage data growth chart. Download this PPT chart to depict financial ratio analysis. This PowerPoint slide is of great help in the business sector to make realistic presentations and provides effective way of presenting your newer thoughts.
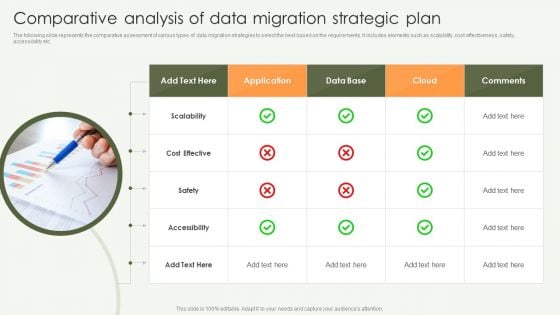
Comparative Analysis Of Data Migration Strategic Plan Diagrams PDF
The following slide represents the comparative assessment of various types of data migration strategies to select the best based on the requirements. It includes elements such as scalability, cost effectiveness, safety, accessibility etc. Presenting Comparative Analysis Of Data Migration Strategic Plan Diagrams PDF to dispense important information. This template comprises one stages. It also presents valuable insights into the topics including Cost Effective, Application, Cloud. This is a completely customizable PowerPoint theme that can be put to use immediately. So, download it and address the topic impactfully.
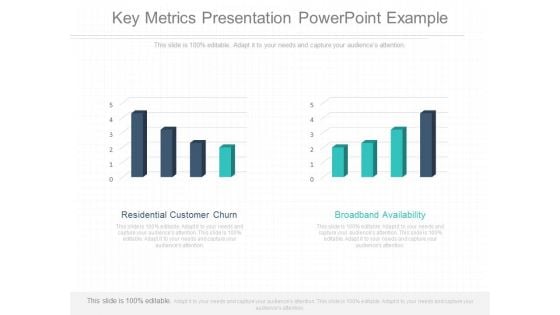
Key Metrics Presentation Powerpoint Example
This is a key metrics presentation powerpoint example. This is a two stage process. The stages in this process are residential customer churn, broadband availability.
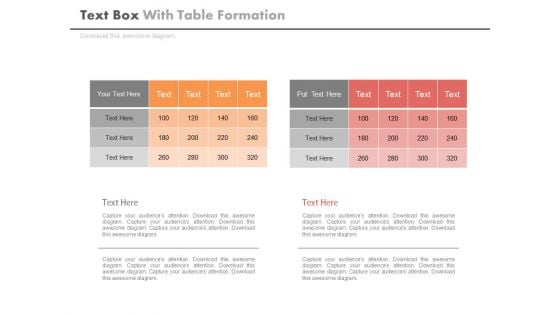
Two Table Charts For Business Data Powerpoint Slides
This PowerPoint template contains two tables chart. You may download this PPT slide to display statistical analysis. You can easily customize this template to make it more unique as per your need.
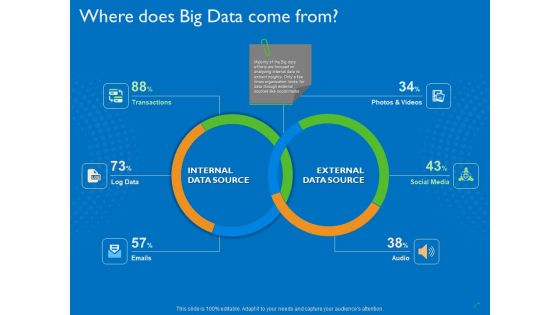
Transforming Big Data Analytics To Knowledge Where Does Big Data Come From Ppt Gallery Styles PDF
This is a transforming big data analytics to knowledge where does big data come from ppt gallery styles pdf template with various stages. Focus and dispense information on six stages using this creative set, that comes with editable features. It contains large content boxes to add your information on topics like transactions, social media, emails, audio, log data. You can also showcase facts, figures, and other relevant content using this PPT layout. Grab it now.
Monthly Budget Report With Calculator Vector Icon Ppt PowerPoint Presentation Model Information PDF
Presenting this set of slides with name monthly budget report with calculator vector icon ppt powerpoint presentation model information pdf. This is a three stage process. The stages in this process are monthly budget report with calculator vector icon. This is a completely editable PowerPoint presentation and is available for immediate download. Download now and impress your audience.
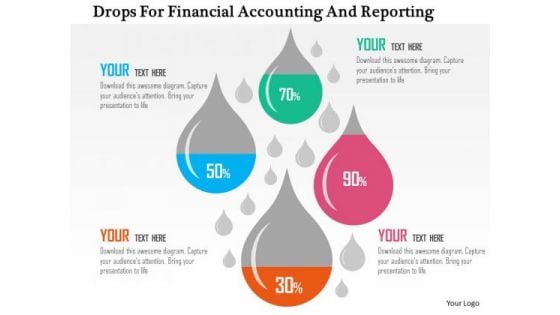
Business Diagram Drops For Financial Accounting And Reporting Presentation Template
This business diagram has been designed with drops displaying financial ratios. Download this diagram to depict financial and accounting ratios. Use this slide to build quality presentations for your viewers.

Fiscal And Operational Assessment 30 60 90 Days Plan Pictures PDF
Deliver an awe inspiring pitch with this creative fiscal and operational assessment 30 60 90 days plan pictures pdf bundle. Topics like data, applications, infrastructure, people can be discussed with this completely editable template. It is available for immediate download depending on the needs and requirements of the user.
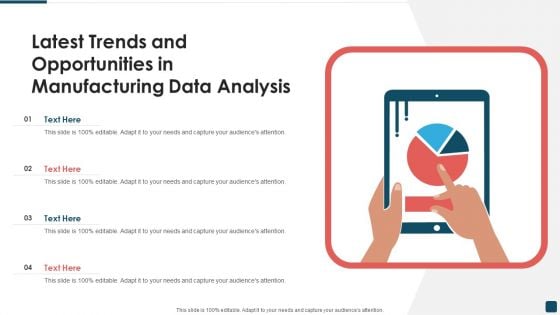
Latest Trends And Opportunities In Manufacturing Data Analysis Designs PDF
Persuade your audience using this Latest Trends And Opportunities In Manufacturing Data Analysis Designs PDF. This PPT design covers four stages, thus making it a great tool to use. It also caters to a variety of topics including Manufacturing Data Analysis, Opportunities. Download this PPT design now to present a convincing pitch that not only emphasizes the topic but also showcases your presentation skills.
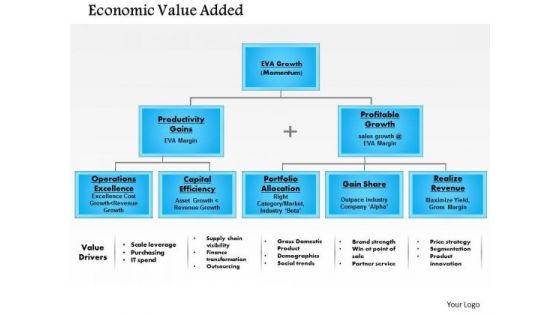
Business Framework Economic Value Add 2 PowerPoint Presentation
This image slide displays business framework for economic value added diagram. This image slide may be used in your presentations to depict firms economic profits and business financial reports. You may change color, size and orientation of any icon to your liking. Create professional presentations using this image slide.

Non Profit Information Management Framework Download PDF
This slide shows non profit data management model. It provides information about data silos, middleware strategy, campaign activation, customer relationship management CRM, etc. Pitch your topic with ease and precision using this Non Profit Information Management Framework Download PDF. This layout presents information on Data Hygiene, Data Append, Data Access. It is also available for immediate download and adjustment. So, changes can be made in the color, design, graphics or any other component to create a unique layout.
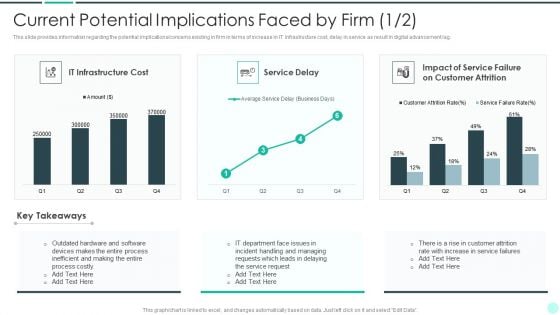
Executing Advance Data Analytics At Workspace Current Potential Implications Demonstration PDF
This slide provides information regarding the potential implications concerns existing in firm in terms of increase in issues related to employees such as lack of expertise, ineffectiveness in handling issues, reported financial losses due to financial threats and data breaches with records exposed. Deliver an awe inspiring pitch with this creative executing advance data analytics at workspace current potential implications demonstration pdf bundle. Topics like current potential implications faced by firm can be discussed with this completely editable template. It is available for immediate download depending on the needs and requirements of the user.
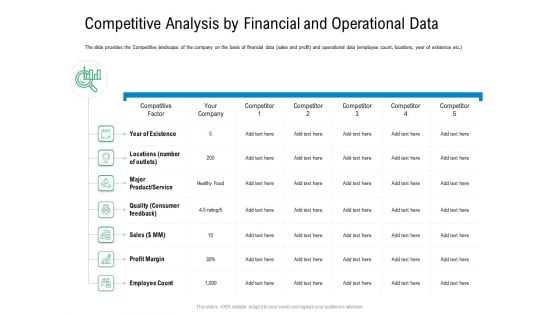
Convertible Preferred Stock Funding Pitch Deck Competitive Analysis By Financial And Operational Data Brochure PDF
The slide provides the Competitive landscape of the company on the basis of financial data sales and profit and operational data employee count, locations, year of existence etc. Deliver an awe inspiring pitch with this creative convertible preferred stock funding pitch deck competitive analysis by financial and operational data brochure pdf bundle. Topics like sales, profit margin, service, quality, locations can be discussed with this completely editable template. It is available for immediate download depending on the needs and requirements of the user.
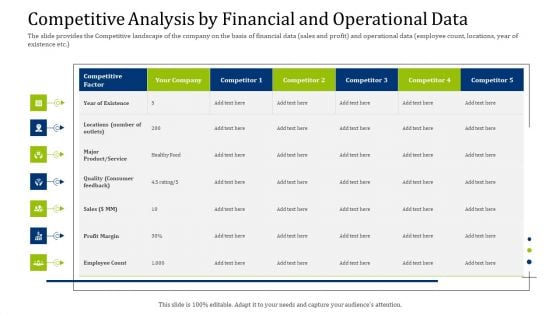
Convertible Debt Financing Pitch Deck Competitive Analysis By Financial And Operational Data Slides PDF
The slide provides the Competitive landscape of the company on the basis of financial data sales and profit and operational data employee count, locations, year of existence etc. Deliver an awe-inspiring pitch with this creative convertible debt financing pitch deck competitive analysis by financial and operational data slides pdf bundle. Topics like profit margin, employee count, sales, product, service can be discussed with this completely editable template. It is available for immediate download depending on the needs and requirements of the user.
Data Driven Organizational Culture Icon Depicting Statistical Analysis Sample PDF
Persuade your audience using this data driven organizational culture icon depicting statistical analysis sample pdf. This PPT design covers three stages, thus making it a great tool to use. It also caters to a variety of topics including data driven organizational culture icon depicting statistical analysis. Download this PPT design now to present a convincing pitch that not only emphasizes the topic but also showcases your presentation skills.

Financial Projections And Key Metrics Ppt PowerPoint Presentation Styles Skills
This is a financial projections and key metrics ppt powerpoint presentation styles skills. This is a five stage process. The stages in this process are expenses, profits, sales, employees, years.
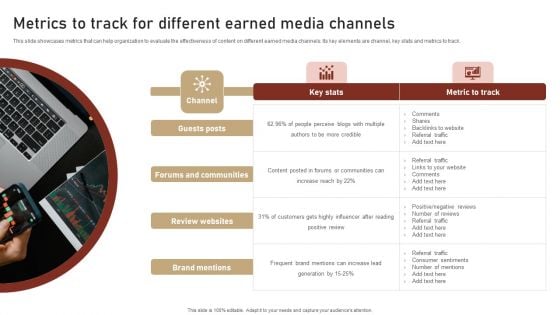
Content Delivery And Promotion Metrics To Track For Different Earned Media Topics PDF
This slide showcases metrics that can help organization to evaluate the effectiveness of content on different earned media channels. Its key elements are channel, key stats and metrics to track. Presenting this PowerPoint presentation, titled Content Delivery And Promotion Metrics To Track For Different Earned Media Topics PDF, with topics curated by our researchers after extensive research. This editable presentation is available for immediate download and provides attractive features when used. Download now and captivate your audience. Presenting this Content Delivery And Promotion Metrics To Track For Different Earned Media Topics PDF. Our researchers have carefully researched and created these slides with all aspects taken into consideration. This is a completely customizable Content Delivery And Promotion Metrics To Track For Different Earned Media Topics PDF that is available for immediate downloading. Download now and make an impact on your audience. Highlight the attractive features available with our PPTs.
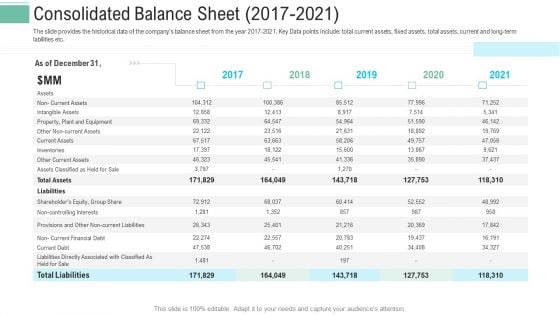
Pitch Presentation Raise Money Spot Market Consolidated Balance Sheet 2017 To 2021 Brochure PDF
The slide provides the historical data of the companys balance sheet from the year 2017-2021. Key Data points include total current assets, fixed assets, total assets, current and long-term labilities etc. Deliver and pitch your topic in the best possible manner with this pitch presentation raise money spot market consolidated balance sheet 2017 to 2021 brochure pdf. Use them to share invaluable insights on inventories, intangible assets, financial debt, shareholders equity and impress your audience. This template can be altered and modified as per your expectations. So, grab it now.
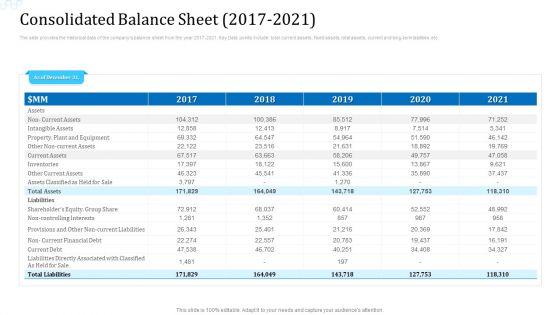
Investor Deck For Procuring Funds From Money Market Consolidated Balance Sheet 2017 To 2021 Elements PDF
The slide provides the historical data of the companys balance sheet from the year 2017 to 2021. Key Data points include total current assets, fixed assets, total assets, current and long term labilities etc. Deliver and pitch your topic in the best possible manner with this investor deck for procuring funds from money market consolidated balance sheet 2017 to 2021 elements pdf. Use them to share invaluable insights on financial, equipment and impress your audience. This template can be altered and modified as per your expectations. So, grab it now.
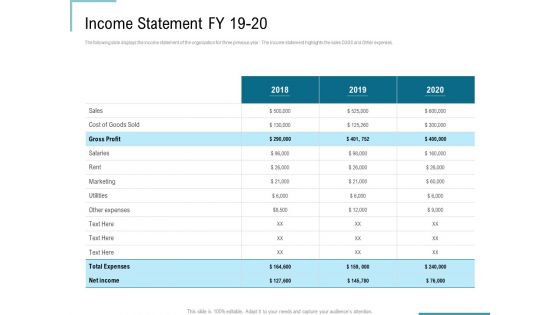
Corporate Execution And Financial Liability Report Income Statement FY 19 20 Sample PDF
Presenting this set of slides with name corporate execution and financial liability report income statement fy 19 20 sample pdf. The topics discussed in these slides are marketing, cost, sales, expenses. This is a completely editable PowerPoint presentation and is available for immediate download. Download now and impress your audience.
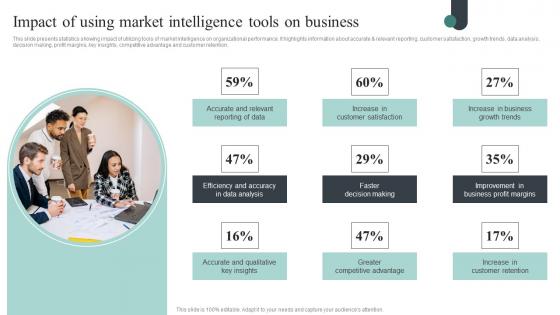
Competitive Intelligence Guide To Determine Market Impact Of Using Market Intelligence Topics Pdf
This slide presents statistics showing impact of utilizing tools of market intelligence on organizational performance. It highlights information about accurate and relevant reporting, customer satisfaction, growth trends, data analysis, decision making, profit margins, key insights, competitive advantage and customer retention. Find highly impressive Competitive Intelligence Guide To Determine Market Impact Of Using Market Intelligence Topics Pdf on Slidegeeks to deliver a meaningful presentation. You can save an ample amount of time using these presentation templates. No need to worry to prepare everything from scratch because Slidegeeks experts have already done a huge research and work for you. You need to download Competitive Intelligence Guide To Determine Market Impact Of Using Market Intelligence Topics Pdf for your upcoming presentation. All the presentation templates are 100 percent editable and you can change the color and personalize the content accordingly. Download now. This slide presents statistics showing impact of utilizing tools of market intelligence on organizational performance. It highlights information about accurate and relevant reporting, customer satisfaction, growth trends, data analysis, decision making, profit margins, key insights, competitive advantage and customer retention.
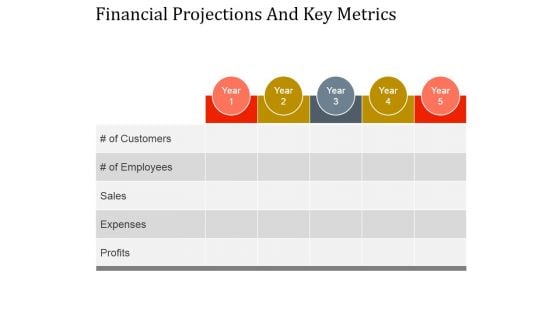
Financial Projections And Key Metrics Ppt PowerPoint Presentation Designs
This is a financial projections and key metrics ppt powerpoint presentation designs. This is a five stage process. The stages in this process are profits, expenses, sales, of employees, of customers.
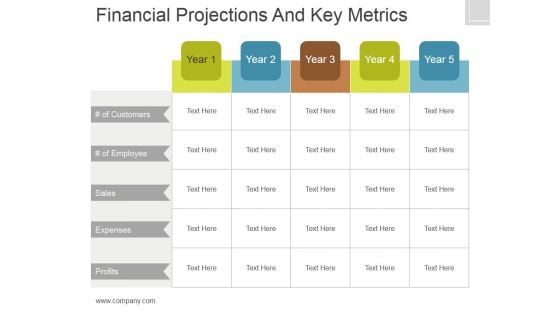
Financial Projections And Key Metrics Ppt PowerPoint Presentation Show
This is a financial projections and key metrics ppt powerpoint presentation show. This is a five stage process. The stages in this process are of customers, sales, expenses, profits.
Economic Trends Analysis Dollar Sign With Four Arrows Ppt PowerPoint Presentation Layouts Icons
This is a economic trends analysis dollar sign with four arrows ppt powerpoint presentation layouts icons. This is a four stage process. The stages in this process are stock market, financial markets, bull market.
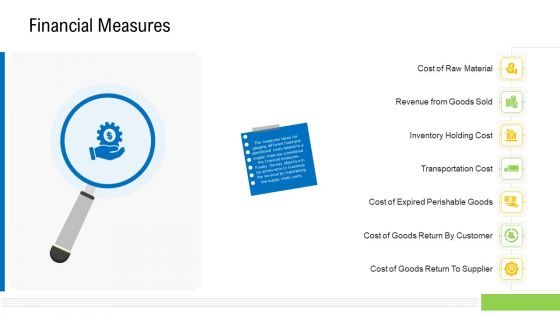
Viable Logistics Network Management Financial Measures Inspiration PDF
This is a viable logistics network management eoq cost model structure pdf template with various stages. Focus and dispense information on seven stages using this creative set, that comes with editable features. It contains large content boxes to add your information on topics like eoq cost model. You can also showcase facts, figures, and other relevant content using this PPT layout. Grab it now.
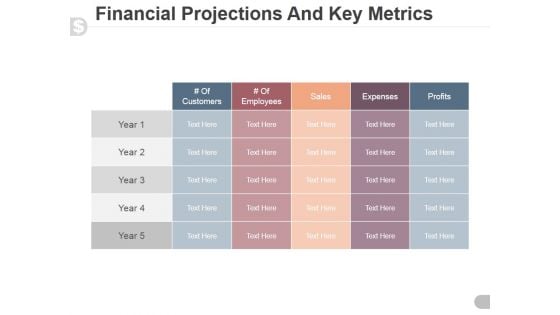
Financial Projections And Key Metrics Ppt PowerPoint Presentation Professional
This is a financial projections and key metrics ppt powerpoint presentation professional. This is a five stage process. The stages in this process are customers, employees, sales, expenses, profits.
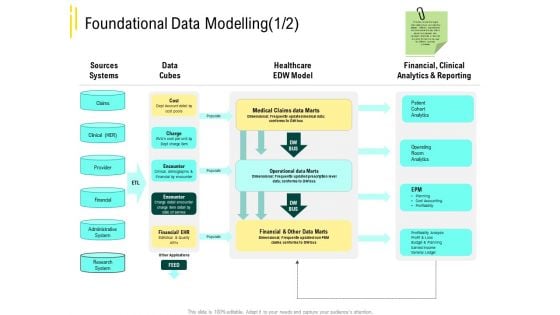
Expert Systems Foundational Data Modelling Medical Claims Information PDF
This is a expert systems foundational data modelling medical claims information pdf. template with various stages. Focus and dispense information on one stages using this creative set, that comes with editable features. It contains large content boxes to add your information on topics like sources systems, healthcare edw model, financial, clinical analytics and reporting, medical claims, analytics, operating. You can also showcase facts, figures, and other relevant content using this PPT layout. Grab it now.
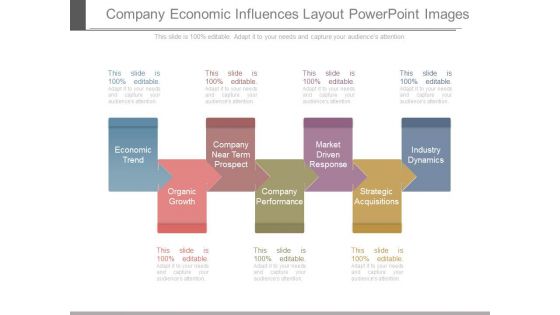
Company Economic Influences Layout Powerpoint Images
This is a company economic influences layout powerpoint images. This is a seven stage process. The stages in this process are economic trend, organic growth, companynear term prospect, company performance, market driven response, strategic acquisitions, industry dynamics.
Big Data Analytics Vector Icon Ppt PowerPoint Presentation Layouts Show
Presenting this set of slides with name big data analytics vector icon ppt powerpoint presentation layouts show. This is a three stage process. The stages in this process are marketing, management, measuring results. This is a completely editable PowerPoint presentation and is available for immediate download. Download now and impress your audience.
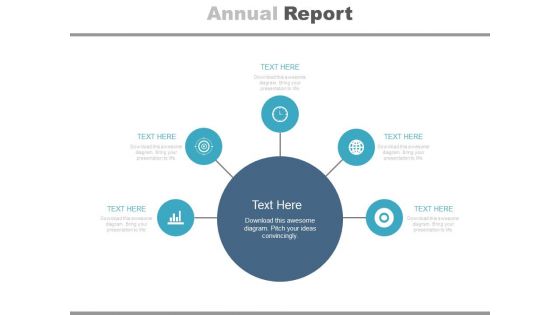
Diagram For Market Research Analysis Powerpoint Slides
This PowerPoint template has been designed with circular infographic diagram. It can be used to display steps for market research and also for financial data analysis. You can download finance PowerPoint template to prepare awesome presentations.
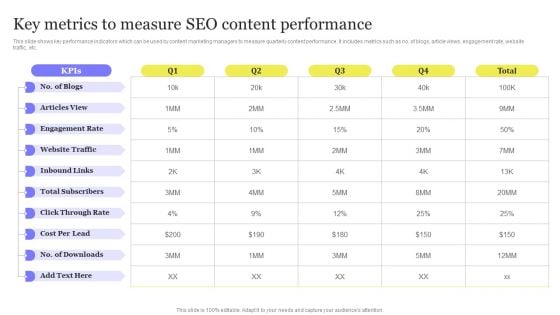
Enhancing Digital Visibility Using SEO Content Strategy Key Metrics To Measure SEO Content Performance Guidelines PDF
This slide shows key performance indicators which can be used by content marketing managers to measure quarterly content performance. It includes metrics such as no. of blogs, article views, engagement rate, website traffic, etc. Make sure to capture your audiences attention in your business displays with our gratis customizable Enhancing Digital Visibility Using SEO Content Strategy Key Metrics To Measure SEO Content Performance Guidelines PDF. These are great for business strategies, office conferences, capital raising or task suggestions. If you desire to acquire more customers for your tech business and ensure they stay satisfied, create your own sales presentation with these plain slides.
International Cloud Kitchen Industry Analysis Emerging Global Trends In Cloud Kitchen Market Icons PDF
The slide highlights emerging trends in global cloud kitchen market for sustainable growth and development. It highlights trends such as vertical consolidation, automation, recipe improvement and data driven. Make sure to capture your audiences attention in your business displays with our gratis customizable International Cloud Kitchen Industry Analysis Emerging Global Trends In Cloud Kitchen Market Icons PDF. These are great for business strategies, office conferences, capital raising or task suggestions. If you desire to acquire more customers for your tech business and ensure they stay satisfied, create your own sales presentation with these plain slides.
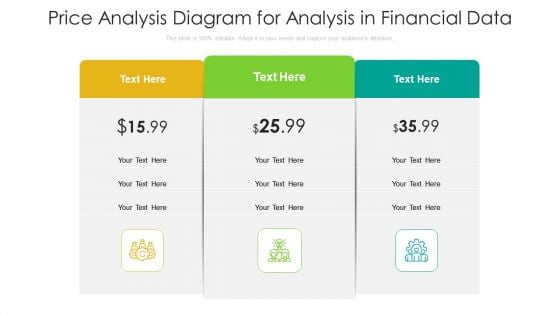
Price Analysis Diagram For Analysis In Financial Data Ppt Infographics Summary PDF
Showcasing this set of slides titled price analysis diagram for analysis in financial data ppt infographics summary pdf. The topics addressed in these templates are price analysis diagram for analysis in financial data. All the content presented in this PPT design is completely editable. Download it and make adjustments in color, background, font etc. as per your unique business setting.
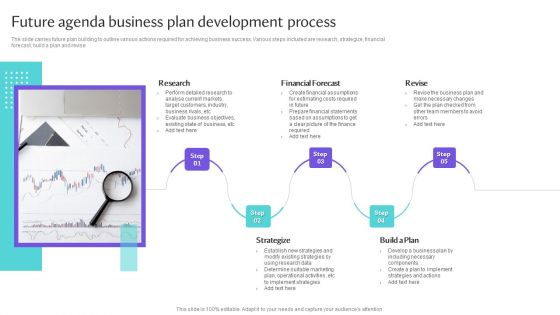
Future Agenda Business Plan Development Process Topics PDF
The slide carries future plan building to outline various actions required for achieving business success. Various steps included are research, strategize, financial forecast, build a plan and revise.Persuade your audience using this Future Agenda Business Plan Development Process Topics PDF. This PPT design covers five stages, thus making it a great tool to use. It also caters to a variety of topics including Financial Forecast, Establish Strategies, Determine Suitable Download this PPT design now to present a convincing pitch that not only emphasizes the topic but also showcases your presentation skills.
Customer Service Focus Ppt PowerPoint Presentation Model Icon
This is a customer service focus ppt powerpoint presentation model icon. This is a four stage process. The stages in this process are marketing automation, sales force automation, customer service automation, financial system integration.
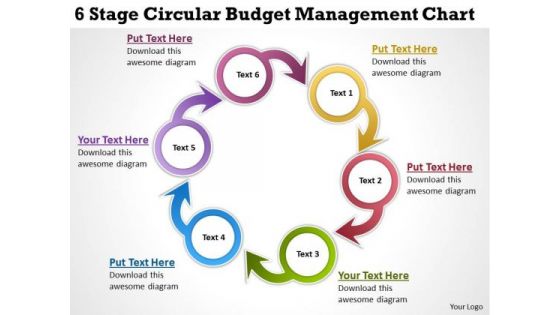
Business Diagram Templates 6 Stage Circular Budget Management Chart PowerPoint
We present our business diagram templates 6 stage circular budget management chart PowerPoint.Use our Circle Charts PowerPoint Templates because Our PowerPoint Templates and Slides will Activate the energies of your audience. Get their creative juices flowing with your words. Download and present our Business PowerPoint Templates because Our PowerPoint Templates and Slides will Activate the energies of your audience. Get their creative juices flowing with your words. Present our Shapes PowerPoint Templates because you should Whip up a frenzy with our PowerPoint Templates and Slides. They will fuel the excitement of your team. Use our Process and Flows PowerPoint Templates because You are an avid believer in ethical practices. Highlight the benefits that accrue with our PowerPoint Templates and Slides. Use our Arrows PowerPoint Templates because Our PowerPoint Templates and Slides will definately Enhance the stature of your presentation. Adorn the beauty of your thoughts with their colourful backgrounds.Use these PowerPoint slides for presentations relating to Arrow, Blue, Business, Chart, Circle, Complex, Concept, Data, Diagram, Financial, Graph, Graphic, Green, Icon, Illustration, Isolated, Model, Pink, Process, Purple, Red, Round, Set, Shape, Vector, Wheel, White, Yellow. The prominent colors used in the PowerPoint template are Yellow, Red, Blue. Engage our Business Diagram Templates 6 Stage Circular Budget Management Chart PowerPoint and experience the difference. Get accustomed to consistent brilliance.
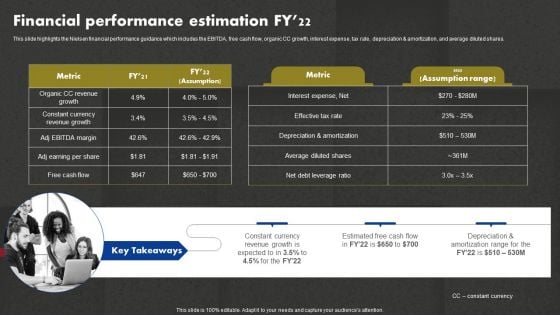
Data And Customer Analysis Company Outline Financial Performance Estimation FY22 Pictures PDF
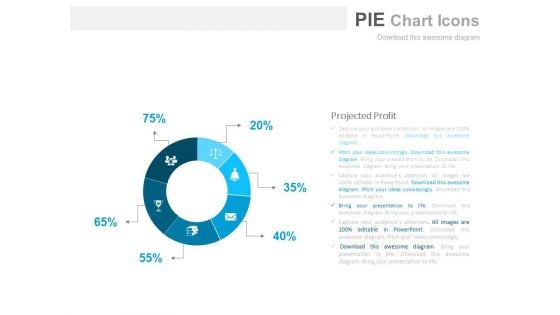
Pie Chart For Projected Profit Report Powerpoint Slides
This PowerPoint template has been designed with diagram of pie chart. This PPT slide can be used to prepare presentations for projected profit report. You can download finance PowerPoint template to prepare awesome presentations.
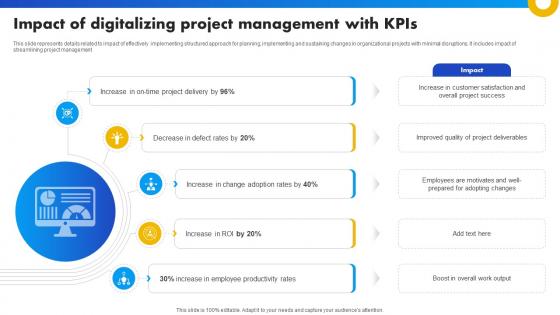
Impact Of Digitalizing Project Management With Kpis Strategies For Success In Digital
This slide represents details related to impact of effectively implementing structured approach for planning, implementing and sustaining changes in organizational projects with minimal disruptions. It includes impact of streamlining project management. Make sure to capture your audiences attention in your business displays with our gratis customizable Impact Of Digitalizing Project Management With Kpis Strategies For Success In Digital. These are great for business strategies, office conferences, capital raising or task suggestions. If you desire to acquire more customers for your tech business and ensure they stay satisfied, create your own sales presentation with these plain slides. This slide represents details related to impact of effectively implementing structured approach for planning, implementing and sustaining changes in organizational projects with minimal disruptions. It includes impact of streamlining project management.

Impact Of Digitalizing Project Management With KPIs Digital Transformation In Project Management
This slide represents details related to impact of effectively implementing structured approach for planning, implementing and sustaining changes in organizational projects with minimal disruptions. It includes impact of streamlining project management. Make sure to capture your audiences attention in your business displays with our gratis customizable Impact Of Digitalizing Project Management With KPIs Digital Transformation In Project Management. These are great for business strategies, office conferences, capital raising or task suggestions. If you desire to acquire more customers for your tech business and ensure they stay satisfied, create your own sales presentation with these plain slides. This slide represents details related to impact of effectively implementing structured approach for planning, implementing and sustaining changes in organizational projects with minimal disruptions. It includes impact of streamlining project management.
KPIs And Metrics To Measure Pharmaceutical Drug Of Pharmaceutical Company Icons PDF
Mentioned slide showcases various key performance indicators KPIs which can be used to measure the development of pharmaceutical companies in different years. The key metrics are productivity, competency, quality of care and financial. Showcasing this set of slides titled KPIs And Metrics To Measure Pharmaceutical Drug Of Pharmaceutical Company Icons PDF. The topics addressed in these templates are Productivity, Competency, Quality Of Care. All the content presented in this PPT design is completely editable. Download it and make adjustments in color, background, font etc. as per your unique business setting.
P And L Kpis Template 1 Ppt PowerPoint Presentation Icon Graphics Download
This is a p and l kpis template 1 ppt powerpoint presentation icon graphics download. This is a four stage process. The stages in this process are net sales, total income, expenses, financing cost, profit after tax.
Illustration Of 9 Stages Market Analysis Diagram Ppt Business Plan Companies PowerPoint Slides
We present our illustration of 9 stages market analysis diagram ppt business plan companies PowerPoint Slides.Present our Communication PowerPoint Templates because Our PowerPoint Templates and Slides will definately Enhance the stature of your presentation. Adorn the beauty of your thoughts with their colourful backgrounds. Present our Marketing PowerPoint Templates because Our PowerPoint Templates and Slides offer you the needful to organise your thoughts. Use them to list out your views in a logical sequence. Download and present our Business PowerPoint Templates because Our PowerPoint Templates and Slides are aesthetically designed to attract attention. We gaurantee that they will grab all the eyeballs you need. Present our Shapes PowerPoint Templates because It is Aesthetically crafted by artistic young minds. Our PowerPoint Templates and Slides are designed to display your dexterity. Download our Process and Flows PowerPoint Templates because Our PowerPoint Templates and Slides offer you the widest possible range of options.Use these PowerPoint slides for presentations relating to Market, sales, statistics, economy, target, achievement, corporate, business, success, presentation, diagram, finance, data, stock, analysis, flowchart, drawing, report, calculation, graph, illustration, economic, chart, money, pie-chart, planning, design, growth, pencil, company, competition, progress, investment, analyze, office, banking, financial, cash, exchange. The prominent colors used in the PowerPoint template are Yellow, Gray, Black. Present like a genius. Our Illustration Of 9 Stages Market Analysis Diagram Ppt Business Plan Companies PowerPoint Slides help you play the part.
International Economic Performance Metrics And Kpis Ppt PowerPoint Presentation Gallery Icon PDF
Presenting this set of slides with name international economic performance metrics and kpis ppt powerpoint presentation gallery icon pdf. The topics discussed in these slides are global, financial, performance. This is a completely editable PowerPoint presentation and is available for immediate download. Download now and impress your audience.
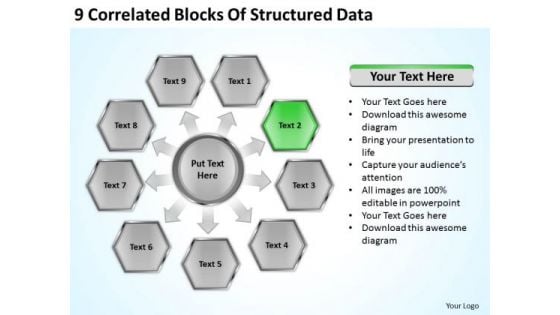
9 Correlated Blocks Of Structured Data Business Plans That Work PowerPoint Templates
We present our 9 correlated blocks of structured data business plans that work PowerPoint templates.Download and present our Marketing PowerPoint Templates because Our PowerPoint Templates and Slides will let you meet your Deadlines. Use our Business PowerPoint Templates because You can Hit the nail on the head with our PowerPoint Templates and Slides. Embed your ideas in the minds of your audience. Present our Finance PowerPoint Templates because Our PowerPoint Templates and Slides are aesthetically designed to attract attention. We gaurantee that they will grab all the eyeballs you need. Use our Process and Flows PowerPoint Templates because You can Be the puppeteer with our PowerPoint Templates and Slides as your strings. Lead your team through the steps of your script. Download and present our Arrows PowerPoint Templates because You canTake a leap off the starting blocks with our PowerPoint Templates and Slides. They will put you ahead of the competition in quick time.Use these PowerPoint slides for presentations relating to Diagram, Chart, Business, Background, Vector, Pie, Brown, Abstract, Wheel, Options, Board, Website, Cross, Statistics, Model, Item, Document, Media, Beehives, Red, Hive, Concept, Presentation, Template, Matt, Brochure, Orange, Guide, Description, Multicolor, Marketing, Gray, Development, Title, Management, Honeycomb, Illustration, Six, Catalog, Direction, Plans, Blue, Text, Reports, Financial, Workplace, Navigation, Parts. The prominent colors used in the PowerPoint template are Green, Gray, Black. Our 9 Correlated Blocks Of Structured Data Business Plans That Work PowerPoint Templates have a feel for it. They automatically create an ambience.
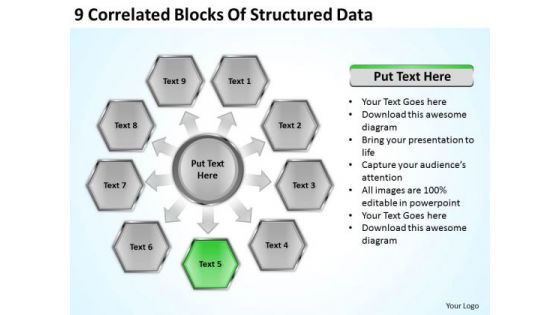
9 Correlated Blocks Of Structured Data How To Present Business Plan PowerPoint Slides
We present our 9 correlated blocks of structured data how to present business plan PowerPoint Slides.Download our Marketing PowerPoint Templates because Our PowerPoint Templates and Slides are focused like a searchlight beam. They highlight your ideas for your target audience. Use our Business PowerPoint Templates because You can Stir your ideas in the cauldron of our PowerPoint Templates and Slides. Cast a magic spell on your audience. Use our Finance PowerPoint Templates because You can Rise to the occasion with our PowerPoint Templates and Slides. You will bring your audience on their feet in no time. Present our Process and Flows PowerPoint Templates because Our PowerPoint Templates and Slides are innately eco-friendly. Their high recall value negate the need for paper handouts. Use our Arrows PowerPoint Templates because our PowerPoint Templates and Slides will give your ideas the shape.Use these PowerPoint slides for presentations relating to Diagram, Chart, Business, Background, Vector, Pie, Brown, Abstract, Wheel, Options, Board, Website, Cross, Statistics, Model, Item, Document, Media, Beehives, Red, Hive, Concept, Presentation, Template, Matt, Brochure, Orange, Guide, Description, Multicolor, Marketing, Gray, Development, Title, Management, Honeycomb, Illustration, Six, Catalog, Direction, Plans, Blue, Text, Reports, Financial, Workplace, Navigation, Parts. The prominent colors used in the PowerPoint template are Green, Gray, Black. Begin with a bang with our 9 Correlated Blocks Of Structured Data How To Present Business Plan PowerPoint Slides. Explode off the blocks with your thoughts.


 Continue with Email

 Home
Home


