Revenue Dashboard
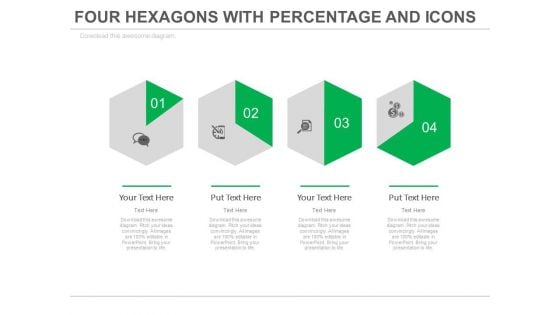
Four Steps Of Financial Growth Analysis Powerpoint Slides
This PowerPoint template with multiple Hexagons can be creatively used to present a timeline in a visual manner. This slide can also help the audience understand a 6 step process in an easier manner. The icons are totally customizable and can be edited to represent the particular process happening at that stage. It can also be used to represent different times or different activities to be carried out at different times in in a day in an office or an organization (e.g. - Medicine schedule) since the hexagon represents a clock and change of shade moves in a clockwise manner. The diagram can be used to represent a comparison or a report or an analysis of the data.

Reporting System Technology PowerPoint Templates And PowerPoint Backgrounds 0311
Microsoft PowerPoint Template and Background with reporting system of online data for reports Formulate plans with our Reporting System Technology PowerPoint Templates And PowerPoint Backgrounds 0311. Download without worries with our money back guaranteee.
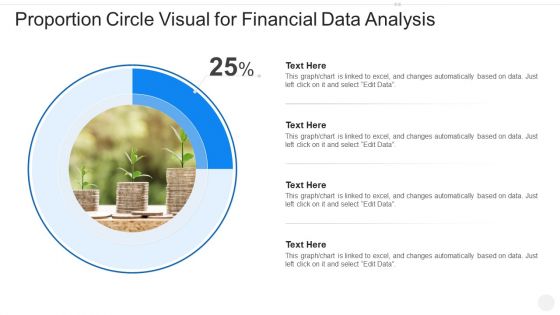
Proportion Circle Visual For Financial Data Analysis Guidelines PDF
Showcasing this set of slides titled proportion circle visual for financial data analysis guidelines pdf. The topics addressed in these templates are proportion circle visual for financial data analysis. All the content presented in this PPT design is completely editable. Download it and make adjustments in color, background, font etc. as per your unique business setting.
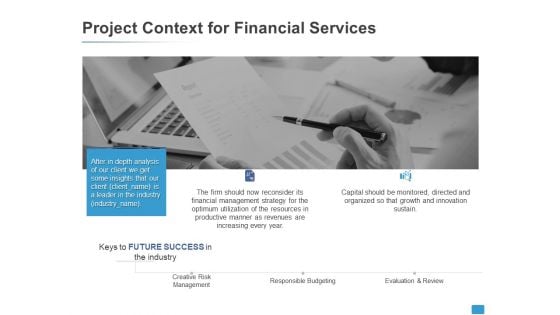
Project Context For Financial Services Data Analysis Ppt PowerPoint Presentation Professional Guidelines
Presenting this set of slides with name project context for financial services data analysis ppt powerpoint presentation professional guidelines. This is a two stage process. The stages in this process are agenda, target audiences, preferred by many, values client, strategy. This is a completely editable PowerPoint presentation and is available for immediate download. Download now and impress your audience.
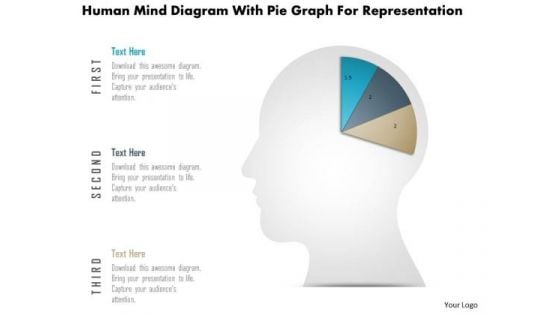
Business Diagram Human Mind Diagram With Pie Graph For Representation PowerPoint Slide
This diagram displays human face graphic divided into sections. This section can be used for data display. Use this diagram to build professional presentations for your viewers.

Business Diagram Six Staged Pie Charts For Text Representation PowerPoint Slide
This slide displays graphic six staged pie charts. Download this diagram to present and compare business data. Use this diagram to display business process workflows in any presentation.
Business Diagram Three Text Boxes For Timer For Time Management PowerPoint Slide
This business diagram displays three text boxes. This diagram contains text boxes for data representation. Use this diagram to display business process workflows in any presentations.
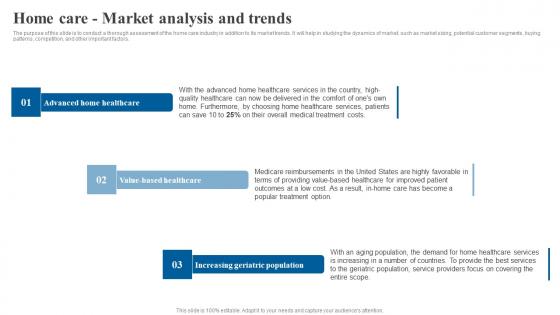
Home Care Market Analysis Trends Elderly Care Business Plan Go To Market Strategy Information Pdf
The purpose of this slide is to conduct a thorough assessment of the home care industry in addition to its market trends. It will help in studying the dynamics of market, such as market sizing, potential customer segments, buying patterns, competition, and other important factors. Make sure to capture your audiences attention in your business displays with our gratis customizable Home Care Market Analysis Trends Elderly Care Business Plan Go To Market Strategy Information Pdf. These are great for business strategies, office conferences, capital raising or task suggestions. If you desire to acquire more customers for your tech business and ensure they stay satisfied, create your own sales presentation with these plain slides. The purpose of this slide is to conduct a thorough assessment of the home care industry in addition to its market trends. It will help in studying the dynamics of market, such as market sizing, potential customer segments, buying patterns, competition, and other important factors.
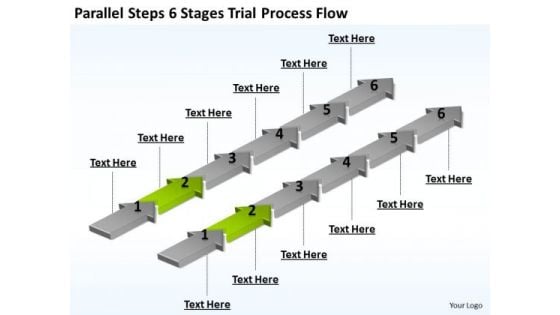
Parallel Data Processing Steps 6 Stages Trial Flow PowerPoint Templates
We present our parallel data processing steps 6 stages trial flow PowerPoint templates.Use our Arrows PowerPoint Templates because Our PowerPoint Templates and Slides are designed to help you succeed. They have all the ingredients you need. Download and present our Steps PowerPoint Templates because You can Bask in the warmth of our PowerPoint Templates and Slides. Enjoy the heartfelt glowing response of your listeners. Download and present our Success PowerPoint Templates because You will get more than you ever bargained for. Download our Process and Flows PowerPoint Templates because It can Bubble and burst with your ideas. Download our Flow Charts PowerPoint Templates because You canTake a leap off the starting blocks with our PowerPoint Templates and Slides. They will put you ahead of the competition in quick time.Use these PowerPoint slides for presentations relating to Arrows,business, chart, concept, connection,cycle, development, diagram, direction, element, environment, exchange, finance,financial, flow, graph, graphic, graphicpresentation, group, icon, illustration,investment, isolated, isometric, market, motion, movement, organization, process, processchart, recycle, report, sign, step, stock,success, symbol, vector. The prominent colors used in the PowerPoint template are Green lime, Gray, White. Presenters tell us our parallel data processing steps 6 stages trial flow PowerPoint templates are designed by a team of presentation professionals. Presenters tell us our connection PowerPoint templates and PPT Slides will get their audience's attention. Customers tell us our parallel data processing steps 6 stages trial flow PowerPoint templates will make the presenter successul in his career/life. Use our development PowerPoint templates and PPT Slides are designed by professionals Customers tell us our parallel data processing steps 6 stages trial flow PowerPoint templates look good visually. Presenters tell us our concept PowerPoint templates and PPT Slides are visually appealing. Our Parallel Data Processing Steps 6 Stages Trial Flow PowerPoint Templates raise the excitement to a fever pitch. Accelerate the action as per your desire.
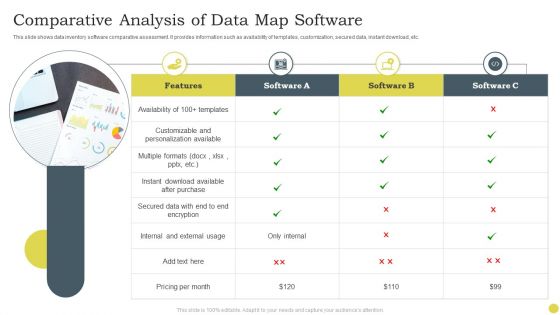
Comparative Analysis Of Data Map Software Ppt PowerPoint Presentation File Objects PDF
This slide shows data inventory software comparative assessment. It provides information such as availability of templates, customization, secured data, instant download, etc. Presenting Comparative Analysis Of Data Map Software Ppt PowerPoint Presentation File Objects PDF to dispense important information. This template comprises four stages. It also presents valuable insights into the topics including Multiple Formats, Secured Data, External Usage. This is a completely customizable PowerPoint theme that can be put to use immediately. So, download it and address the topic impactfully.
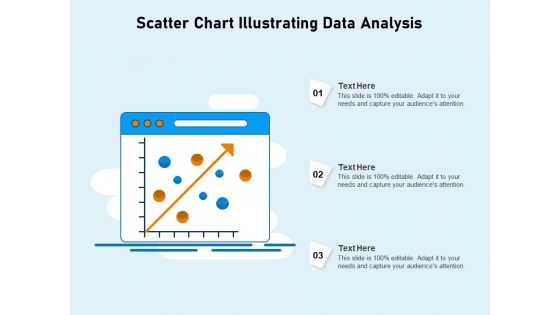
Scatter Chart Illustrating Data Analysis Ppt PowerPoint Presentation Show Graphic Tips PDF
Presenting scatter chart illustrating data analysis ppt powerpoint presentation show graphic tips pdf to dispense important information. This template comprises three stages. It also presents valuable insights into the topics including scatter chart illustrating data analysis. This is a completely customizable PowerPoint theme that can be put to use immediately. So, download it and address the topic impactfully.
Project Management Integration Icon Depicting Data Analysis Ppt Inspiration Elements PDF
Presenting Project Management Integration Icon Depicting Data Analysis Ppt Inspiration Elements PDF to dispense important information. This template comprises three stages. It also presents valuable insights into the topics including Project Management, Integration Icon, Depicting Data Analysis. This is a completely customizable PowerPoint theme that can be put to use immediately. So, download it and address the topic impactfully.

Data Center Infrastructure Management IT What Is Data Center Consolidation Information PDF
This slide depicts the data center consolidation and how it would be beneficial for companies in saving money through operational expenses and facility costs. Deliver an awe inspiring pitch with this creative data center infrastructure management it what is data center consolidation information pdf bundle. Topics like costs, performance, economic, data centers can be discussed with this completely editable template. It is available for immediate download depending on the needs and requirements of the user.
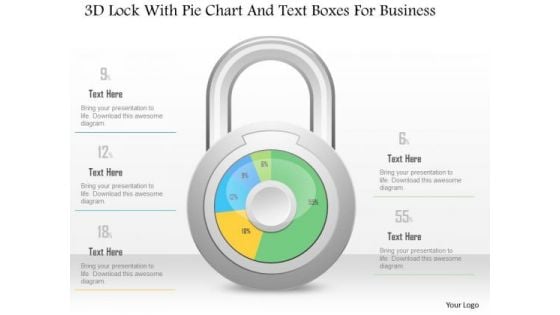
Business Diagram 3d Lock With Pie Chart And Text Boxes For Business PowerPoint Slide
This Power Point diagram has been crafted with pie chart in shape of lock. It contains diagram of lock pie chart to compare and present data in an effective manner. Use this diagram to build professional presentations for your viewers.
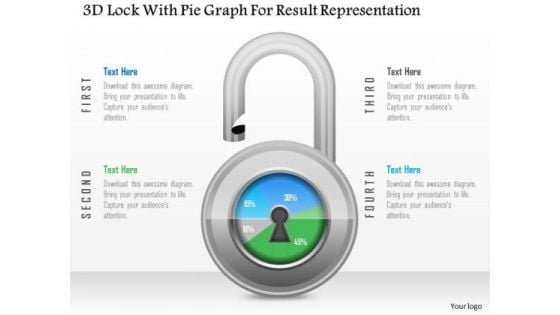
Business Diagram 3d Lock With Pie Graph For Result Representation PowerPoint Slide
This Power Point diagram has been crafted with pie chart in shape of lock. It contains diagram of lock pie chart to compare and present data in an effective manner. Use this diagram to build professional presentations for your viewers.
Business Diagram 3d Pencil With Text Boxes For Representation PowerPoint Slide
This Power Point diagram displays graphic of pencil with icons and text spaces. It contains diagram of colorful pencil for data display. Use this diagram to build professional presentations for your viewers.
Business Diagram Human Icons With Bubbles And Different Icons Inside PowerPoint Slide
This diagram displays graph with percentage value growth. This business slide is suitable to present and compare business data. Use this diagram to build professional presentations for your viewers.

Business Diagram Three Staged Pencil Diagram For Graph Formation PowerPoint Slide
This business diagram displays set of pencils. This Power Point template has been designed to compare and present business data. Download this diagram to represent stages of business growth.
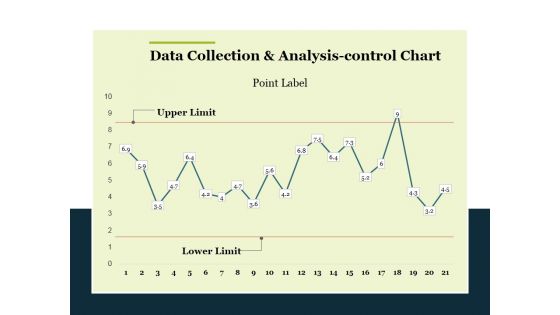
Data Collection And Analysis Control Chart Ppt PowerPoint Presentation Summary Templates
This is a data collection and analysis control chart ppt powerpoint presentation summary templates. This is a one stage process. The stages in this process are business, marketing, point label, upper limit, lower limit.
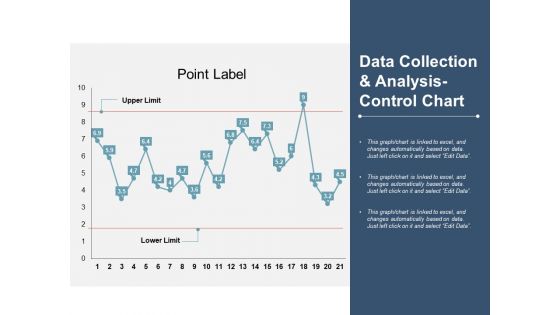
Data Collection And Analysis Control Chart Ppt PowerPoint Presentation Slide Download
This is a data collection and analysis control chart ppt powerpoint presentation slide download. This is a three stage process. The stages in this process are line chart, finance, marketing, management, investment.
Key Kpis To Measure Sustainability At Organization Icons PDF
This slide highlights various performance indicators to measure sustainability performance at workplace to monitor and track practices. It includes key components such as environmental KPIs, social KPIs and economic KPIs. Presenting Key Kpis To Measure Sustainability At Organization Icons PDF to dispense important information. This template comprises three stages. It also presents valuable insights into the topics including Environmental, Social, Economic. This is a completely customizable PowerPoint theme that can be put to use immediately. So, download it and address the topic impactfully.
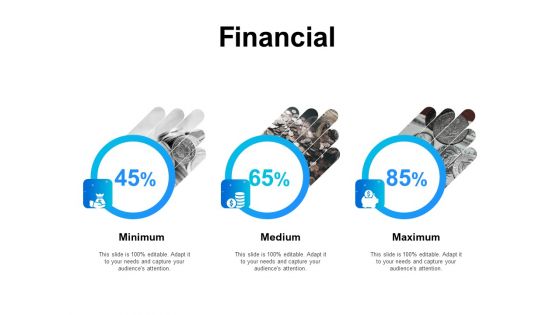
Gap Analysis Budgeting And Reporting Financial Ppt PowerPoint Presentation Portfolio Example File PDF
Presenting this set of slides with name gap analysis budgeting and reporting financial ppt powerpoint presentation portfolio example file pdf. This is a three stage process. The stages in this process are minimum, medium, maximum. This is a completely editable PowerPoint presentation and is available for immediate download. Download now and impress your audience.
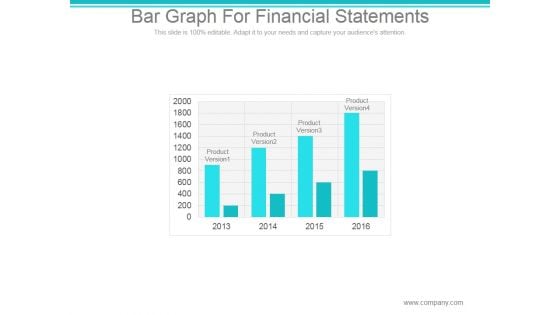
Bar Graph For Financial Statements Ppt PowerPoint Presentation Example
This is a bar graph for financial statements ppt powerpoint presentation example. This is a four stage process. The stages in this process are product version, finance, year.
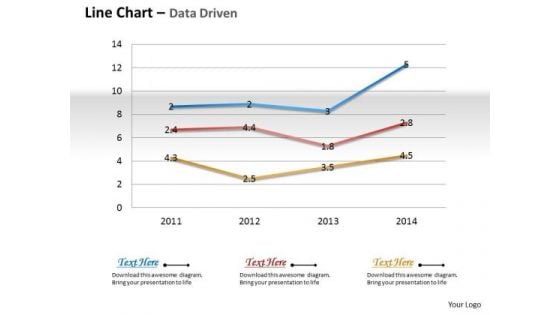
Business Data Analysis Chart Shows Changes Over The Time PowerPoint Templates
Document The Process On Our business data analysis chart shows changes over the time Powerpoint Templates. Make A Record Of Every Detail.
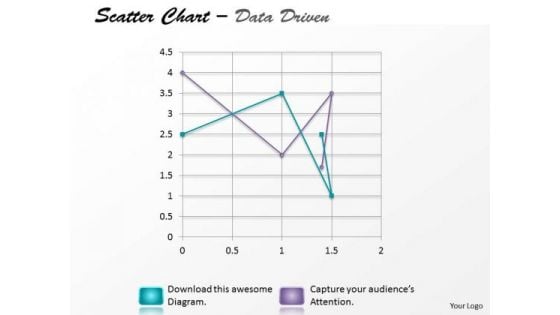
Data Analysis Excel Driven Multiple Series Scatter Chart PowerPoint Slides Templates
Your Listeners Will Never Doodle. Our data analysis excel driven multiple series scatter chart powerpoint slides Templates Will Hold Their Concentration.
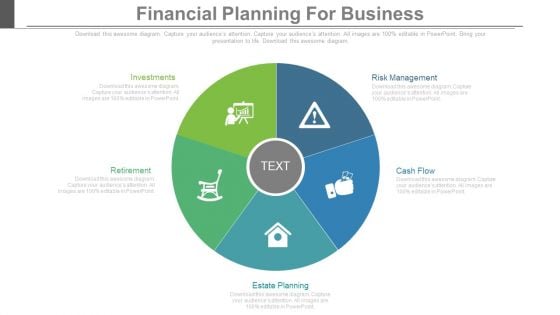
Financial Planning For Business Ppt Slides
This is a financial planning for business ppt slides. This is a five stage process. The stages in this process are business, success, marketing.
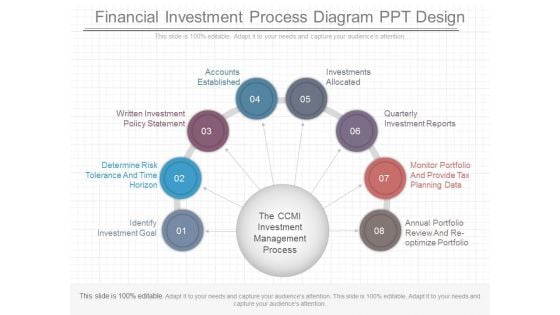
Financial Investment Process Diagram Ppt Design
This is a financial investment process diagram ppt design. This is a eight stage process. The stages in this process are identify investment goal, determine risk tolerance and time horizon, written investment policy statement, accounts established, investments allocated, quarterly investment reports, monitor portfolio and provide tax planning data, annual portfolio review and re optimize portfolio.
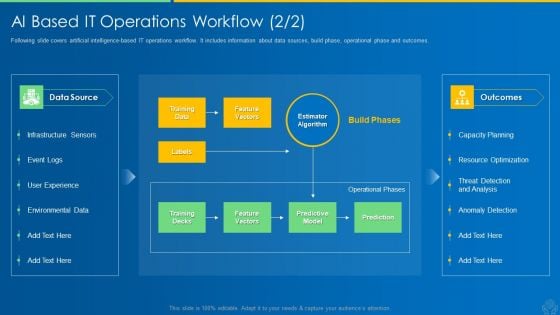
AI And ML Driving Monetary Value For Organization AI Based IT Operations Workflow Prediction Inspiration PDF
Following slide covers artificial intelligence-based IT operations workflow. It includes information about data sources, build phase, operational phase and outcomes. Deliver and pitch your topic in the best possible manner with this ai and ml driving monetary value for organization ai based it operations workflow prediction inspiration pdf. Use them to share invaluable insights on data source, infrastructure sensors, outcomes, capacity planning, resource optimization and impress your audience. This template can be altered and modified as per your expectations. So, grab it now.
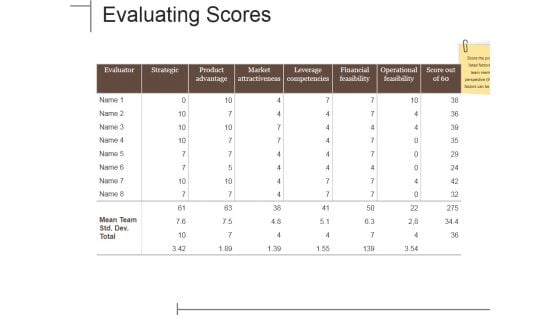
Evaluating Scores Ppt PowerPoint Presentation Infographics Rules
This is a evaluating scores ppt powerpoint presentation infographics rules. This is a seven stage process. The stages in this process are strategic, product advantage, market attractiveness, leverage competencies, financial feasibility, operational feasibility.
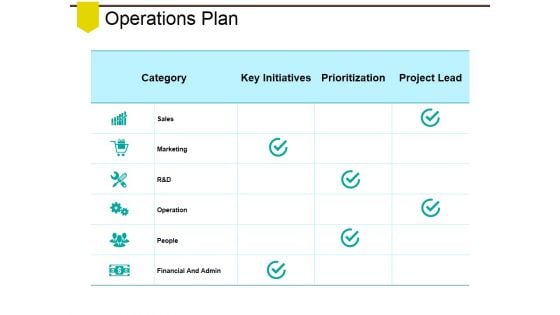
Operations Plan Ppt PowerPoint Presentation Model Samples
This is a operations plan ppt powerpoint presentation model samples. This is a three stage process. The stages in this process are sales, marketing, operation, people, financial and admin.
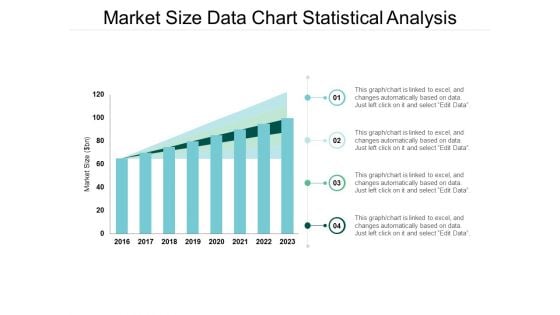
Market Size Data Chart Statistical Analysis Ppt Powerpoint Presentation Model Format
This is a market size data chart statistical analysis ppt powerpoint presentation model format. The topics discussed in this diagram are market growth, market opportunity, market profitability. This is a completely editable PowerPoint presentation, and is available for immediate download.
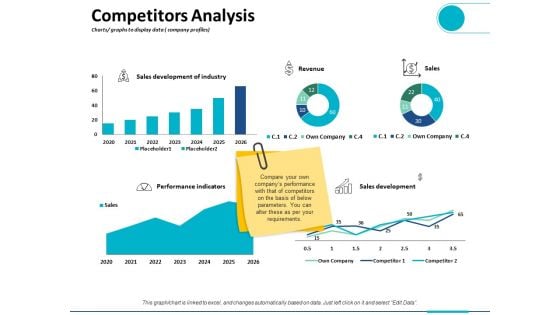
Competitors Analysis Charts Graphs To Display Data Company Profiles Ppt PowerPoint Presentation Outline Visual Aids
This is a competitors analysis charts graphs to display data company profiles ppt powerpoint presentation outline visual aids. This is a five stage process. The stages in this process are finance, analysis, business, investment, marketing.
Business Economic Report For Financial Analysis Icon Ppt PowerPoint Presentation Gallery Slide Portrait PDF
Presenting business economic report for financial analysis icon ppt powerpoint presentation gallery slide portrait pdf to dispense important information. This template comprises three stages. It also presents valuable insights into the topics including business economic report for financial analysis icon. This is a completely customizable PowerPoint theme that can be put to use immediately. So, download it and address the topic impactfully.
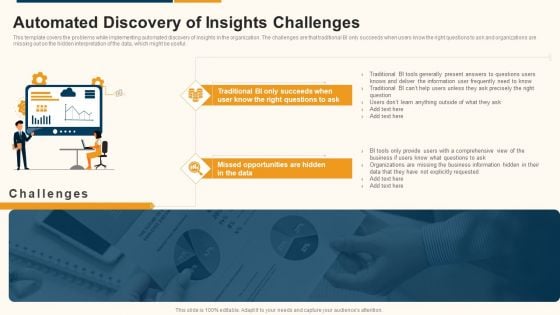
Data Interpretation And Analysis Playbook Automated Discovery Of Insights Challenges Clipart PDF
This template covers the problems while implementing automated discovery of insights in the organization. The challenges are that traditional BI only succeeds when users know the right questions to ask and organizations are missing out on the hidden interpretation of the data, which might be useful. This is a data interpretation and analysis playbook automated discovery of insights challenges clipart pdf template with various stages. Focus and dispense information on two stages using this creative set, that comes with editable features. It contains large content boxes to add your information on topics like opportunities, organizations, business. You can also showcase facts, figures, and other relevant content using this PPT layout. Grab it now.
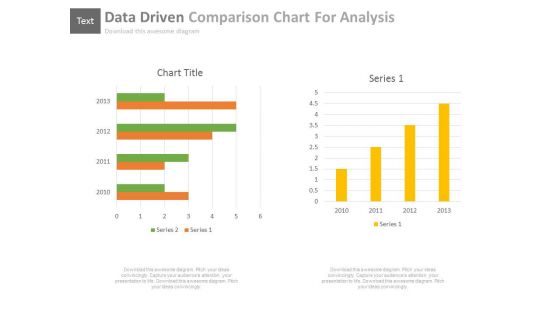
Data Driven Comparison Charts For Analysis Powerpoint Slides
You can download this PowerPoint template to display statistical data and analysis. This PPT slide contains data driven comparison charts. Draw an innovative business idea using this professional diagram.
Data Analysis Vector Icons Ppt Powerpoint Presentation Layouts Gridlines
This is a data analysis vector icons ppt powerpoint presentation layouts gridlines. This is a two stage process. The stages in this process are data presentation, content presentation, information presentation.
Data Interpretation Percentage Analysis Ppt Powerpoint Presentation Summary Icon
This is a data interpretation percentage analysis ppt powerpoint presentation summary icon. This is a six stage process. The stages in this process are data presentation, content presentation, information presentation.
Income Statement Kpis Ppt PowerPoint Presentation Icon Background Images
This is a income statement kpis ppt powerpoint presentation icon background images. This is a four stage process. The stages in this process are net sales, other income, expenses, other expenses, total material consumed.
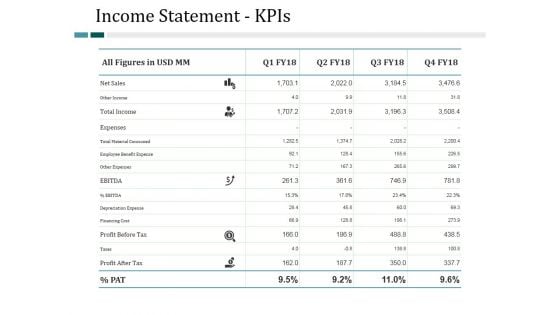
Income Statement Kpis Ppt PowerPoint Presentation Slides Show
This is a income statement kpis ppt powerpoint presentation slides show. This is a four stage process. The stages in this process are business, management, analysis, finance, strategy.
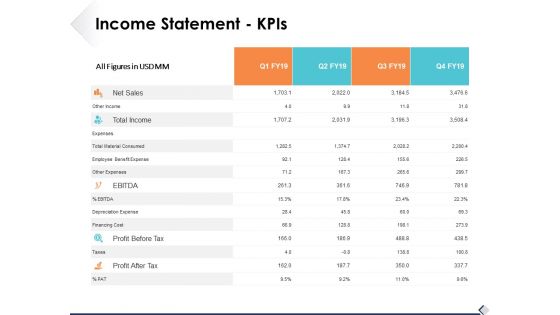
Income Statement Kpis Ppt PowerPoint Presentation Professional Template
This is a income statement kpis ppt powerpoint presentation professional template. This is a four stage process. The stages in this process are business, management, strategy, analysis, icons.
Business Diagram Battery Icon With Power Icons Energy Technology PowerPoint Slide
This business diagram displays battery icon with power charging. Use this diagram, in your presentations to display energy saving, battery and technology. Create professional presentations using this diagram slide.
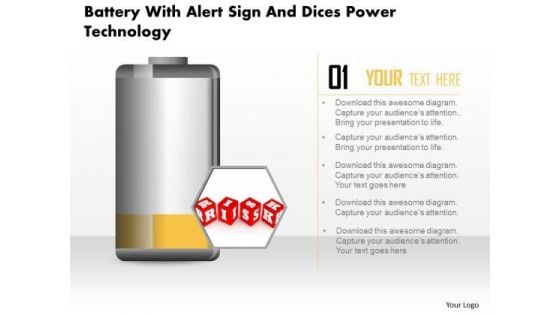
Business Diagram Battery With Alert Sign And Dices Power Technology PowerPoint Slide
This business diagram displays risk alert on battery icon. Use this diagram, in your presentations to display energy saving, battery and technology. Create professional presentations using this diagram slide.
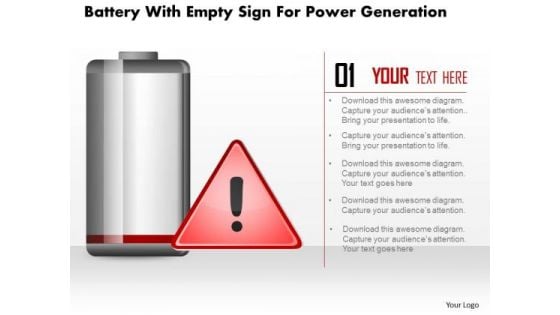
Business Diagram Battery With Empty Sign For Power Generation PowerPoint Slide
This business diagram displays empty sign alert on battery icon. Use this diagram, in your presentations to display energy saving, battery and technology. Create professional presentations using this diagram slide.
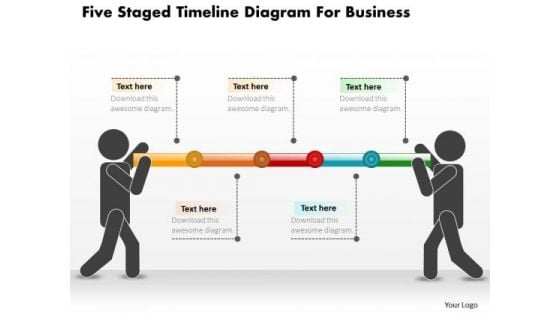
Business Diagram Five Staged Timeline Diagram For Business PowerPoint Slide
This PowerPoint template displays five points timeline diagram. This business diagram has been designed with graphic of timeline with five points, text space and start, end points. Use this diagram, in your presentations to display process steps, stages, timelines and business management. Make wonderful presentations using this business slide.
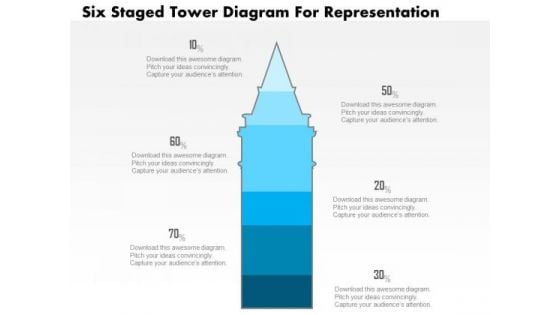
Business Diagram Five Staged Tower Diagram For Representation PowerPoint Slide
This business slide displays five staged tower diagram. It contains blue tower graphic divided into five parts. This diagram slide depicts processes, stages, steps, points, options information display. Use this diagram, in your presentations to express your views innovatively.
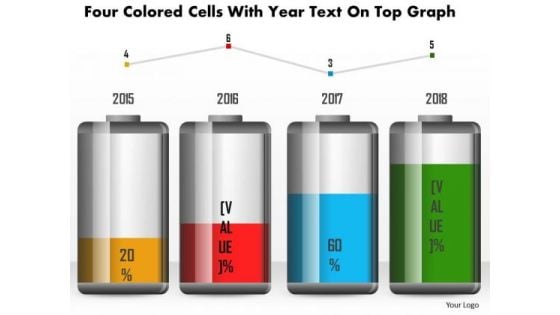
Business Diagram Four Colored Cells With Year Text On Top Graph PowerPoint Slide
This business diagram has been designed with battery cell graphic for business timeline. This slide can be used for business planning and management. Use this diagram for your business and success milestones related presentations.
Business Diagram Green Battery Cell With Full Charging Symbol PowerPoint Slide
This business diagram displays full battery charge icon. Use this diagram, in your presentations to display energy saving, battery and technology. Create professional presentations using this diagram slide.
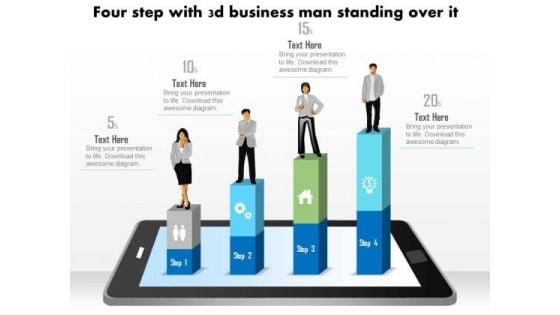
Business Diagram Four Steps With 3d Business Person Standing Over It PowerPoint Slide
This business diagram displays bar graph with business person standing on it. This Power Point template has been designed to display personal growth. You may use this diagram to impart professional appearance to your presentations.
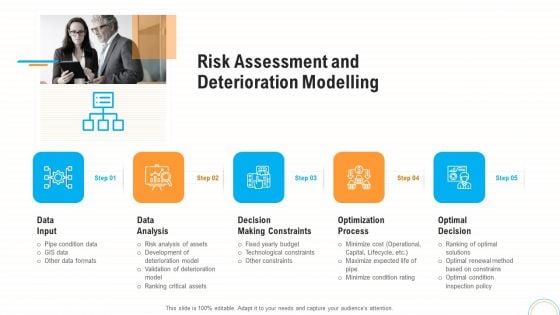
Fiscal And Operational Assessment Risk Assessment And Deterioration Modelling Demonstration PDF
Presenting fiscal and operational assessment risk assessment and deterioration modelling demonstration pdf to provide visual cues and insights. Share and navigate important information on five stages that need your due attention. This template can be used to pitch topics like data analysis, decision making constraints, optimization process. In addtion, this PPT design contains high resolution images, graphics, etc, that are easily editable and available for immediate download.
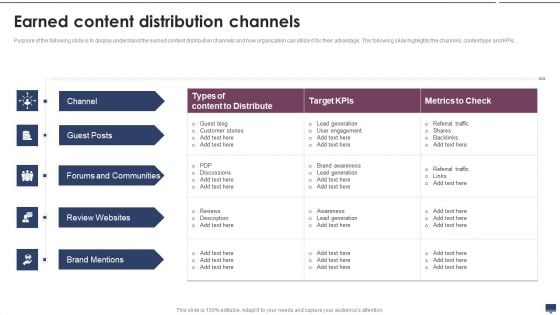
Earned Content Distribution Channels Summary PDF
Purpose of the following slide is to display understand the earned content distribution channels and how organization can utilize it for their advantage. The following slide highlights the channels, content type and KPIs. This is a Earned Content Distribution Channels Summary PDF template with various stages. Focus and dispense information on five stages using this creative set, that comes with editable features. It contains large content boxes to add your information on topics like Forums And Communities, Review Websites, Brand Mentions. You can also showcase facts, figures, and other relevant content using this PPT layout. Grab it now.
Charts Representing Business Data Analysis Icon Introduction PDF
Presenting charts representing business data analysis icon introduction pdf. to dispense important information. This template comprises three stages. It also presents valuable insights into the topics including charts representing business data analysis icon. This is a completely customizable PowerPoint theme that can be put to use immediately. So, download it and address the topic impactfully.
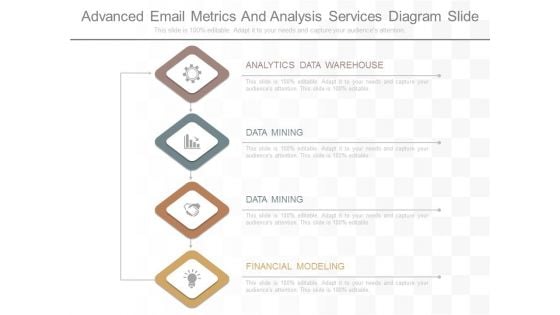
Advanced Email Metrics And Analysis Services Diagram Slide
This is a advanced email metrics and analysis services diagram slide. This is a four stage process. The stages in this process are analytics data warehouse, data mining, financial modeling.
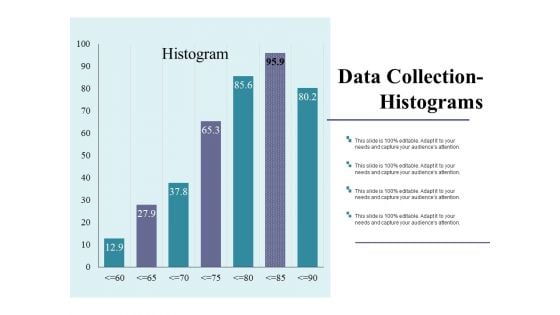
Data Collection Histograms Ppt PowerPoint Presentation Outline Show
This is a data collection histograms ppt powerpoint presentation outline show. This is a seven stage process. The stages in this process are business, marketing, strategy, finance, analysis.
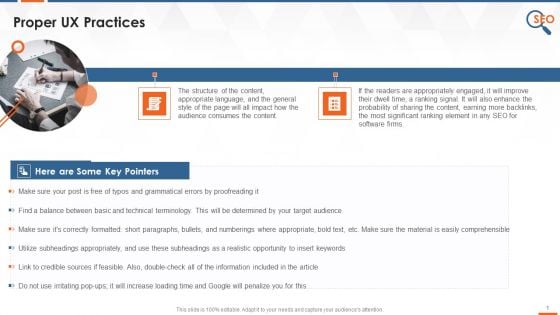
IT Company SEO Approach UX Guidelines Training Ppt
This slide covers optimizing UX or UI as SEO strategy for IT or SaaS or software companies. It also depicts that if the readers are appropriately engaged, it will improve their delay time, a ranking signal, and the probability of sharing the content, earning more backlinks, etc.
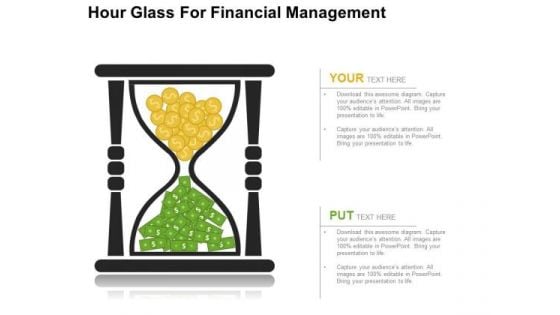
Hour Glass For Financial Management PowerPoint Templates
Create dynamic presentations with this professional slide containing a graphic of hour glass with dollar currency notes and coins. This template is designed to portray the concepts of financial management. Add this slide in your presentations to visually support your content
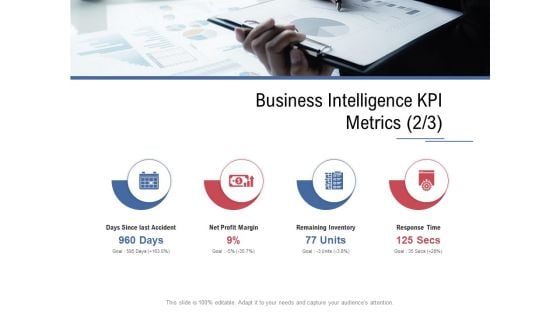
Data Assimilation Business Intelligence KPI Metrics Days Ppt Infographic Template Designs PDF
This is a data assimilation business intelligence kpi metrics days ppt infographic template designs pdf template with various stages. Focus and dispense information on four stages using this creative set, that comes with editable features. It contains large content boxes to add your information on topics like days since last accident, net profit margin, remaining inventory, response time. You can also showcase facts, figures, and other relevant content using this PPT layout. Grab it now.
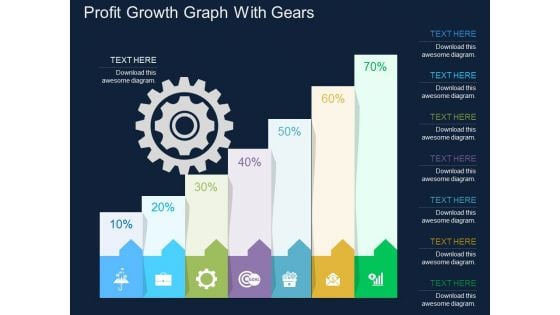
Profit Growth Graph With Gears Powerpoint Template
This business slide contains profit growth graph with gears. This PowerPoint template helps to display outline of business plan. Use this diagram to impart more clarity to data and to create more sound impact on viewers.
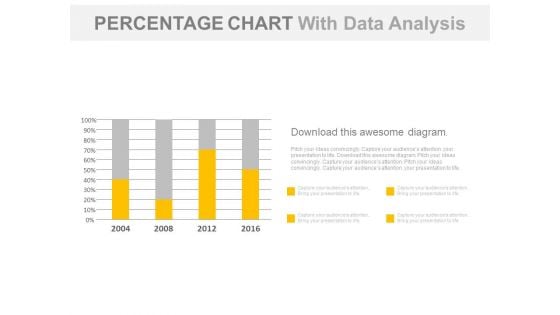
Year Based Chart With Percentage Data Analysis Powerpoint Slides
Our above business slide contains year based statistical chart. This PowerPoint template can be used to display percentage data analysis. Capture the attention of your audience with this slide.
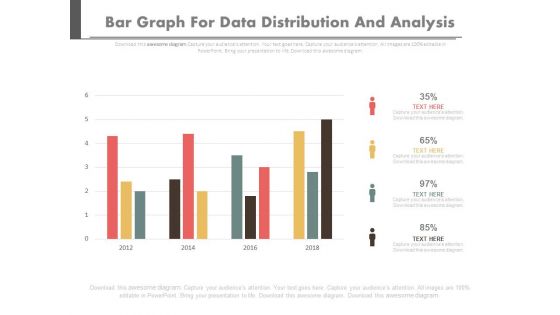
Bar Graph For Data Distribution And Analysis Powerpoint Slides
This PowerPoint template has been designed with bar graph. This PowerPoint diagram is useful for data distribution and analysis This diagram slide can be used to make impressive presentations.

Organisation Structure Financial Analytics Platform Investor Elevator Pitch Deck
This slide covers the organizational structure of a data intelligent company that demonstrate current expertise and operational framework. It includes roles such as founder and chief executive officer, chief people officer, head of sales, chief technology officer, etc. From laying roadmaps to briefing everything in detail, our templates are perfect for you. You can set the stage with your presentation slides. All you have to do is download these easy-to-edit and customizable templates. Organisation Structure Financial Analytics Platform Investor Elevator Pitch Deck will help you deliver an outstanding performance that everyone would remember and praise you for. Do download this presentation today. This slide covers the organizational structure of a data intelligent company that demonstrate current expertise and operational framework. It includes roles such as founder and chief executive officer, chief people officer, head of sales, chief technology officer, etc.


 Continue with Email

 Home
Home


