Revenue Plan
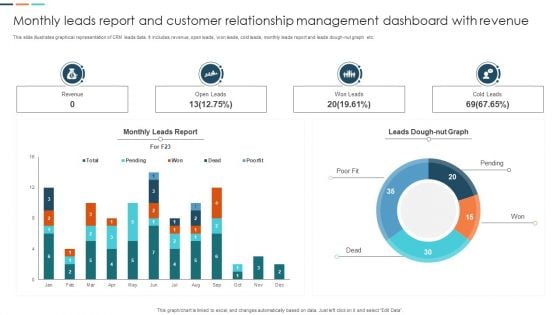
Monthly Leads Report And Customer Relationship Management Dashboard With Revenue Information PDF
This slide illustrates graphical representation of CRM leads data. It includes revenue, open leads, won leads, cold leads, monthly leads report and leads dough nut graph etc. Pitch your topic with ease and precision using this Monthly Leads Report And Customer Relationship Management Dashboard With Revenue Information PDF. This layout presents information on Monthly Leads Report, Customer Relationship Management, Dashboard With Revenue. It is also available for immediate download and adjustment. So, changes can be made in the color, design, graphics or any other component to create a unique layout.
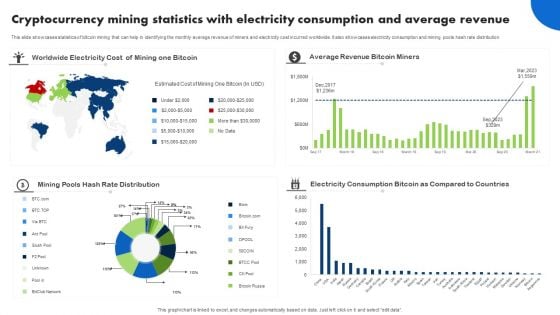
Cryptocurrency Mining Statistics With Electricity Consumption And Average Revenue Clipart PDF
This slide showcases statistics of bitcoin mining that can help in identifying the monthly average revenue of miners and electricity cost incurred worldwide. It also showcases electricity consumption and mining pools hash rate distribution. Showcasing this set of slides titled Cryptocurrency Mining Statistics With Electricity Consumption And Average Revenue Clipart PDF. The topics addressed in these templates are Average Revenue Bitcoin Miners, Mining Pools Hash Rate, Electricity Consumption Bitcoin. All the content presented in this PPT design is completely editable. Download it and make adjustments in color, background, font etc. as per your unique business setting.
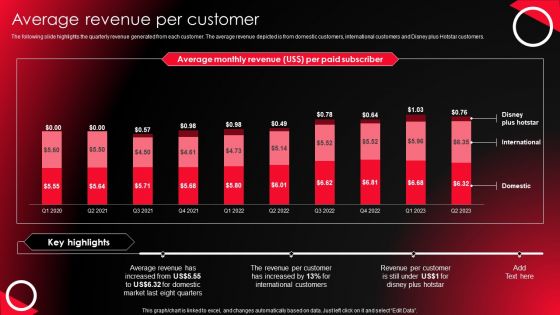
Company Profile For Online Video Service Provider Average Revenue Per Customer Guidelines PDF
The following slide highlights the quarterly revenue generated from each customer. The average revenue depicted is from domestic customers, international customers and Disney plus Hotstar customers. Take your projects to the next level with our ultimate collection of Company Profile For Online Video Service Provider Average Revenue Per Customer Guidelines PDF. Slidegeeks has designed a range of layouts that are perfect for representing task or activity duration, keeping track of all your deadlines at a glance. Tailor these designs to your exact needs and give them a truly corporate look with your own brand colors they will make your projects stand out from the rest.
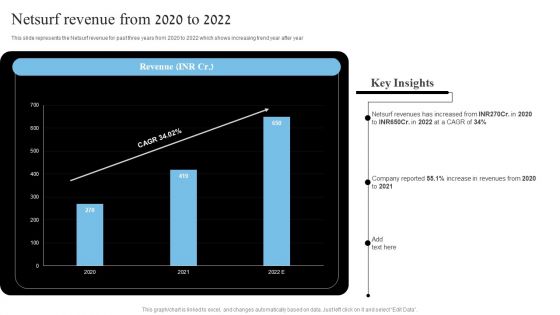
Network Marketing Company Profile Netsurf Revenue From 2020 To 2022 Elements PDF
This slide represents the Netsurf revenue for past three years from 2020 to 2022 which shows increasing trend year after year Get a simple yet stunning designed Network Marketing Company Profile Netsurf Revenue From 2020 To 2022 Elements PDF. It is the best one to establish the tone in your meetings. It is an excellent way to make your presentations highly effective. So, download this PPT today from Slidegeeks and see the positive impacts. Our easy to edit Network Marketing Company Profile Netsurf Revenue From 2020 To 2022 Elements PDF can be your go to option for all upcoming conferences and meetings. So, what are you waiting for Grab this template today.
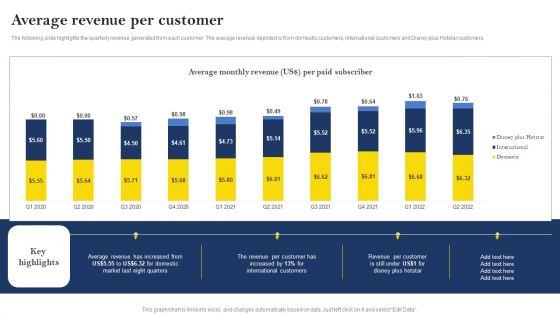
Over The Top Platform Company Profile Average Revenue Per Customer Infographics PDF
The following slide highlights the quarterly revenue generated from each customer. The average revenue depicted is from domestic customers, international customers and Disney plus Hotstar customers. Boost your pitch with our creative Over The Top Platform Company Profile Average Revenue Per Customer Infographics PDF. Deliver an awe-inspiring pitch that will mesmerize everyone. Using these presentation templates you will surely catch everyones attention. You can browse the ppts collection on our website. We have researchers who are experts at creating the right content for the templates. So you do not have to invest time in any additional work. Just grab the template now and use them.
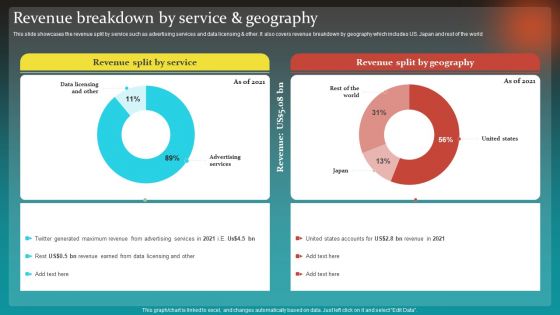
Social Network Business Summary Revenue Breakdown By Service And Geography Summary PDF
This slide showcases the revenue split by service such as advertising services and data licensing and other. It also covers revenue breakdown by geography which includes US. Japan and rest of the world Want to ace your presentation in front of a live audience Our Social Network Business Summary Revenue Breakdown By Service And Geography Summary PDF can help you do that by engaging all the users towards you. Slidegeeks experts have put their efforts and expertise into creating these impeccable powerpoint presentations so that you can communicate your ideas clearly. Moreover, all the templates are customizable, and easy to edit and downloadable. Use these for both personal and commercial use.
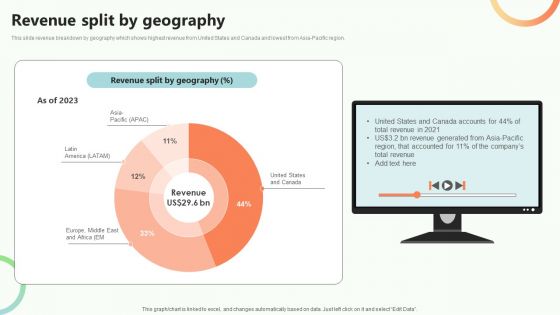
Online Video Content Provider Business Profile Revenue Split By Geography Sample PDF
This slide revenue breakdown by geography which shows highest revenue from United States and Canada and lowest from Asia-Pacific region. The Online Video Content Provider Business Profile Revenue Split By Geography Sample PDF is a compilation of the most recent design trends as a series of slides. It is suitable for any subject or industry presentation, containing attractive visuals and photo spots for businesses to clearly express their messages. This template contains a variety of slides for the user to input data, such as structures to contrast two elements, bullet points, and slides for written information. Slidegeeks is prepared to create an impression.
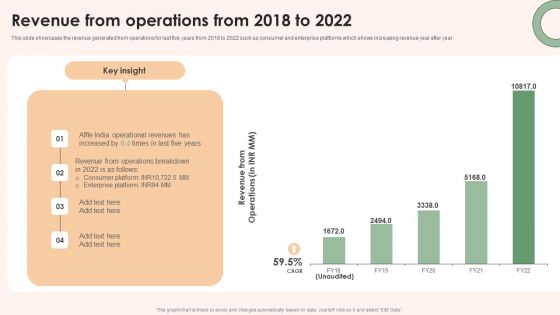
Online Advertising Firm Business Profile Revenue From Operations From 2018 To 2022 Ideas PDF
This slide showcases the revenue generated from operations for last five years from 2018 to 2022 such as consumer and enterprise platforms which shows increasing revenue year after year The best PPT templates are a great way to save time, energy, and resources. Slidegeeks have 100 percent editable powerpoint slides making them incredibly versatile. With these quality presentation templates, you can create a captivating and memorable presentation by combining visually appealing slides and effectively communicating your message. Download Online Advertising Firm Business Profile Revenue From Operations From 2018 To 2022 Ideas PDF from Slidegeeks and deliver a wonderful presentation.

Increase Returns By Examining And Executing New Sales Qualification Procedure Revenue By Geography Introduction PDF
This is a increase returns by examining and executing new sales qualification procedure revenue by geography introduction pdf template with various stages. Focus and dispense information on three stages using this creative set, that comes with editable features. It contains large content boxes to add your information on topics like revenue by geography. You can also showcase facts, figures, and other relevant content using this PPT layout. Grab it now.
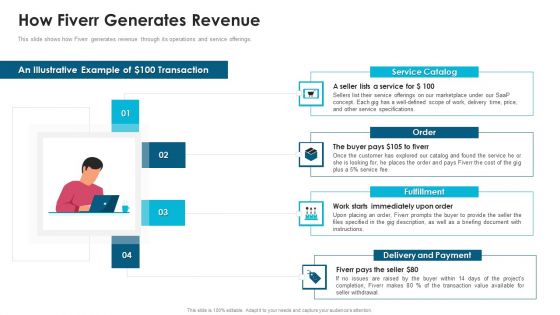
Fiverr Capital Fundraising How Fiverr Generates Revenue Ppt Summary Background PDF
This slide shows how Fiverr generates revenue through its operations and service offerings. Presenting Fiverr Capital Fundraising How Fiverr Generates Revenue Ppt Summary Background PDF to provide visual cues and insights. Share and navigate important information on four stages that need your due attention. This template can be used to pitch topics like Service Catalog Order, Fulfillment Fiverr Pays, Delivery And Payment. In addtion, this PPT design contains high resolution images, graphics, etc, that are easily editable and available for immediate download.
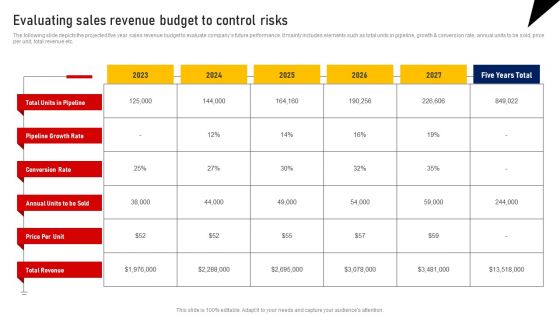
Performing Sales Risk Analysis Procedure Evaluating Sales Revenue Budget To Control Risks Guidelines PDF
The following slide depicts the projected five year sales revenue budget to evaluate companys future performance. It mainly includes elements such as total units in pipeline, growth and conversion rate, annual units to be sold, price per unit, total revenue etc. Formulating a presentation can take up a lot of effort and time, so the content and message should always be the primary focus. The visuals of the PowerPoint can enhance the presenters message, so our Performing Sales Risk Analysis Procedure Evaluating Sales Revenue Budget To Control Risks Guidelines PDF was created to help save time. Instead of worrying about the design, the presenter can concentrate on the message while our designers work on creating the ideal templates for whatever situation is needed. Slidegeeks has experts for everything from amazing designs to valuable content, we have put everything into Performing Sales Risk Analysis Procedure Evaluating Sales Revenue Budget To Control Risks Guidelines PDF
Icons Slide For Blueprint Enhance Organizational Operations Promote Revenue Generation Summary PDF
Introducing our well designed Icons Slide For Blueprint Enhance Organizational Operations Promote Revenue Generation Summary PDF set of slides. The slide displays editable icons to enhance your visual presentation. The icons can be edited easily. So customize according to your business to achieve a creative edge. Download and share it with your audience.

Issue Tree Layout For Business Revenue Maximization Ppt Gallery Designs PDF
Persuade your audience using this issue tree layout for business revenue maximization ppt gallery designs pdf. This PPT design covers four stages, thus making it a great tool to use. It also caters to a variety of topics including minimize cost, increase revenue, improve profit. Download this PPT design now to present a convincing pitch that not only emphasizes the topic but also showcases your presentation skills.

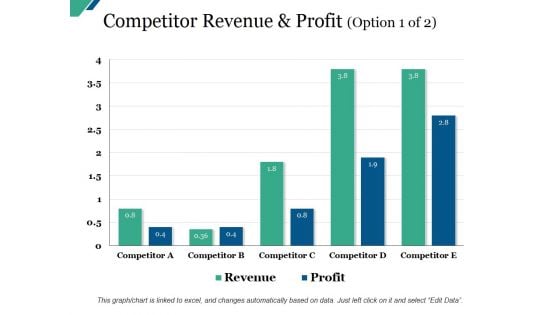
Competitor Revenue And Profit Option 1 Of 2 Ppt PowerPoint Presentation Ideas Gallery
This is a competitor revenue and profit option 1 of 2 ppt powerpoint presentation ideas gallery. This is a two stage process. The stages in this process are finance, business, management, strategy, analysis.
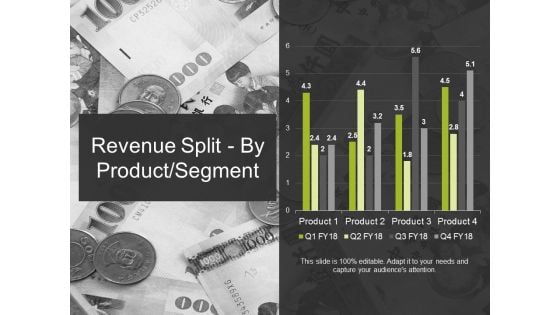
Revenue Split By Product Segment Template 2 Ppt PowerPoint Presentation Ideas Graphic Images
This is a revenue split by product segment template 2 ppt powerpoint presentation ideas graphic images. This is a four stage process. The stages in this process are business, marketing, finance, graph, strategy.
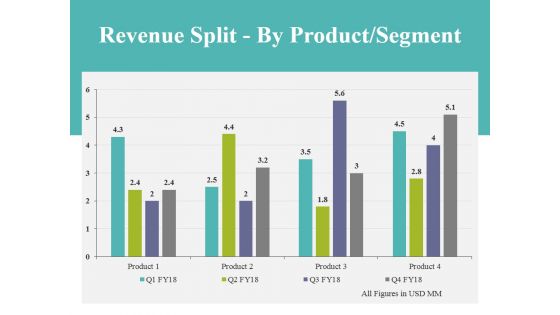
Revenue Split By Product Segment Template 2 Ppt PowerPoint Presentation Styles Guidelines
This is a revenue split by product segment template 2 ppt powerpoint presentation styles guidelines. This is a four stage process. The stages in this process are business, finance, analysis, marketing, strategy.
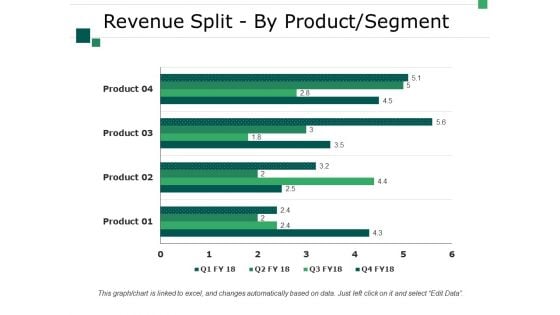
Revenue Split By Product Segment Template 2 Ppt PowerPoint Presentation Summary Good
This is a revenue split by product segment template 2 ppt powerpoint presentation summary good. This is a four stage process. The stages in this process are business, marketing, finance, strategy, graph.
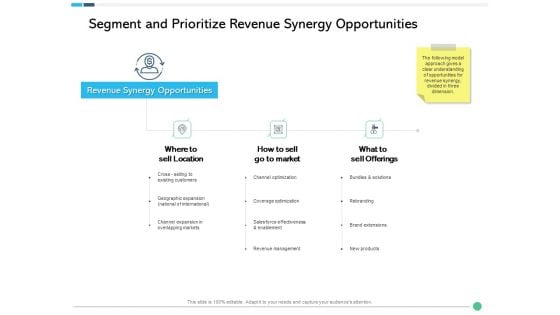
Assessing Synergies Segment And Prioritize Revenue Synergy Opportunities Ppt PowerPoint Presentation Infographic Template Portfolio PDF
This is a assessing synergies segment and prioritize revenue synergy opportunities ppt powerpoint presentation infographic template portfolio pdf template with various stages. Focus and dispense information on three stages using this creative set, that comes with editable features. It contains large content boxes to add your information on topics like location, market, offerings, geographic expansion, revenue management. You can also showcase facts, figures, and other relevant content using this PPT layout. Grab it now.
Business Synergies Segment And Prioritize Revenue Synergy Opportunities Ppt Icon Background Image PDF
This is a business synergies segment and prioritize revenue synergy opportunities ppt icon background image pdf template with various stages. Focus and dispense information on three stages using this creative set, that comes with editable features. It contains large content boxes to add your information on topics like revenue synergy opportunities, location, sell go to market. You can also showcase facts, figures, and other relevant content using this PPT layout. Grab it now.
Revenue Building Approaches To Boost Sales Icon For Business Growth Inspiration PDF
Persuade your audience using this revenue building approaches to boost sales icon for business growth inspiration pdf. This PPT design covers three stages, thus making it a great tool to use. It also caters to a variety of topics including revenue building approaches to boost sales icon for business growth. Download this PPT design now to present a convincing pitch that not only emphasizes the topic but also showcases your presentation skills.
Strategic Focus Areas And Actions To Enhance Business Revenue Icon Sample PDF
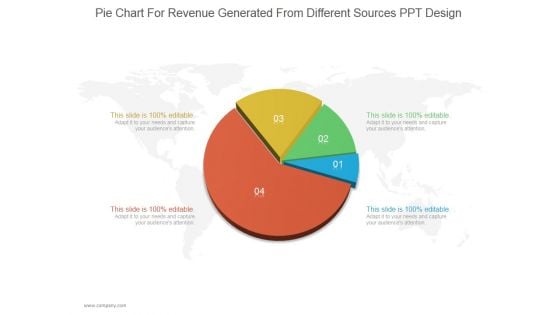
Pie Chart For Revenue Generated From Different Sources Ppt PowerPoint Presentation Styles
This is a pie chart for revenue generated from different sources ppt powerpoint presentation styles. This is a four stage process. The stages in this process are business, strategy, pie chart, finance, marketing, management.
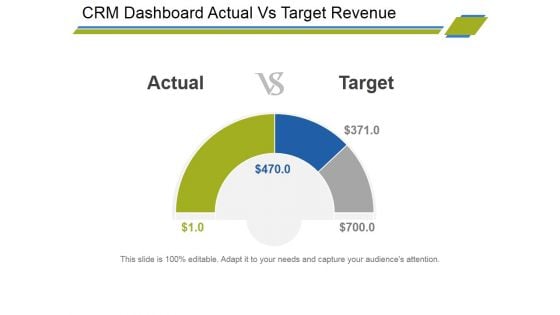
Crm Dashboard Actual Vs Target Revenue Ppt PowerPoint Presentation Outline Example File
This is a crm dashboard actual vs target revenue ppt powerpoint presentation outline example file. This is a three stage process. The stages in this process are actual, target.
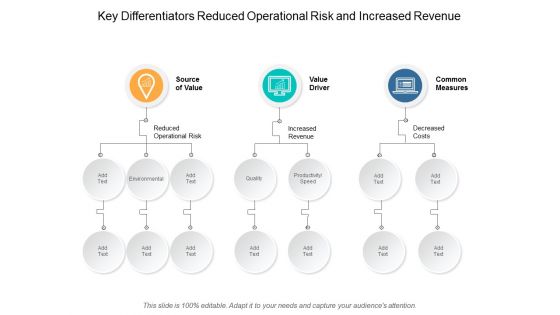
Key Differentiators Reduced Operational Risk And Increased Revenue Ppt Powerpoint Presentation Model Outline
This is a key differentiators reduced operational risk and increased revenue ppt powerpoint presentation model outline. This is a three stage process. The stages in this process are value drivers, utility drivers, worth drivers.
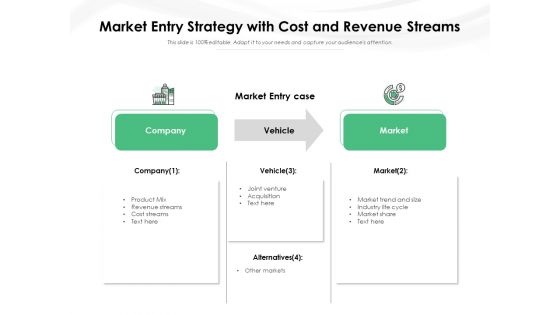
Market Entry Strategy With Cost And Revenue Streams Ppt PowerPoint Presentation Summary Inspiration PDF
Presenting this set of slides with name market entry strategy with cost and revenue streams ppt powerpoint presentation summary inspiration pdf. This is a three stage process. The stages in this process are company vehicle, market, market entry case, alternatives, product mix, revenue streams, cost streams. This is a completely editable PowerPoint presentation and is available for immediate download. Download now and impress your audience.

Implementing Marketing Mix Strategy To Enhance Overall Performance Revenue By Geography Pictures PDF
Presenting Implementing Marketing Mix Strategy To Enhance Overall Performance Revenue By Geography Pictures PDF to provide visual cues and insights. Share and navigate important information on three stages that need your due attention. This template can be used to pitch topics like Revenue By Geography. In addtion, this PPT design contains high resolution images, graphics, etc, that are easily editable and available for immediate download.
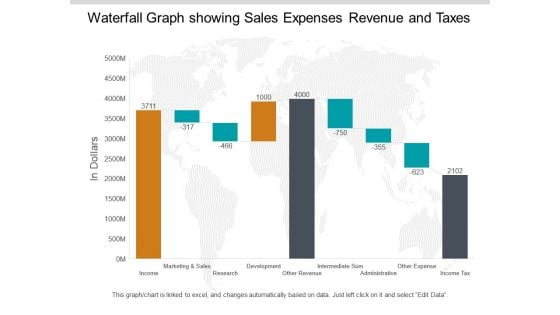
Waterfall Graph Showing Sales Expenses Revenue And Taxes Ppt PowerPoint Presentation Pictures Summary
This is a waterfall graph showing sales expenses revenue and taxes ppt powerpoint presentation pictures summary. This is a three stage process. The stages in this process are profit and loss, balance sheet, income statement, benefit and loss.
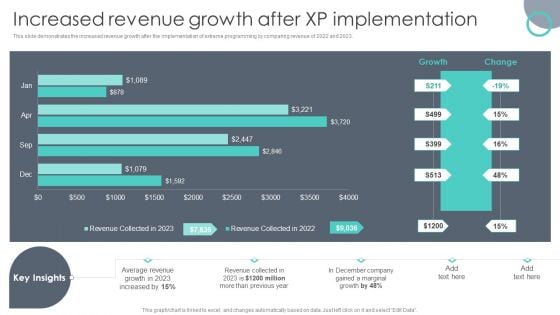
Extreme Programming Methodology Increased Revenue Growth After XP Implementation Summary PDF
This slide demonstrates the increased revenue growth after the implementation of extreme programming by comparing revenue of 2022 and 2023. Do you have to make sure that everyone on your team knows about any specific topic I yes, then you should give Extreme Programming Methodology Increased Revenue Growth After XP Implementation Summary PDF a try. Our experts have put a lot of knowledge and effort into creating this impeccable Extreme Programming Methodology Increased Revenue Growth After XP Implementation Summary PDF. You can use this template for your upcoming presentations, as the slides are perfect to represent even the tiniest detail. You can download these templates from the Slidegeeks website and these are easy to edit. So grab these today.
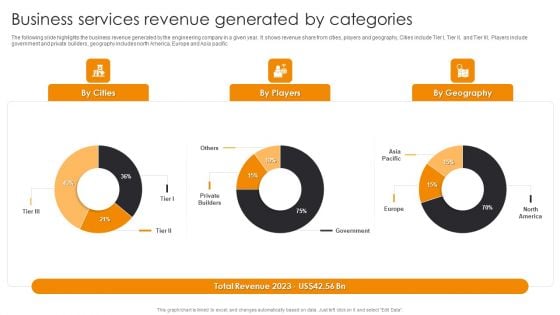
Business Services Revenue Generated By Categories Engineering Company Financial Analysis Report Graphics PDF
The following slide highlights the business revenue generated by the engineering company in a given year. It shows revenue share from cities, players and geography, Cities include Tier I, Tier II, and Tier III, Players include government and private builders, geography includes north America, Europe and Asia pacific.If you are looking for a format to display your unique thoughts, then the professionally designed Business Services Revenue Generated By Categories Engineering Company Financial Analysis Report Graphics PDF is the one for you. You can use it as a Google Slides template or a PowerPoint template. Incorporate impressive visuals, symbols, images, and other charts. Modify or reorganize the text boxes as you desire. Experiment with shade schemes and font pairings. Alter, share or cooperate with other people on your work. Download Business Services Revenue Generated By Categories Engineering Company Financial Analysis Report Graphics PDF and find out how to give a successful presentation. Present a perfect display to your team and make your presentation unforgettable.
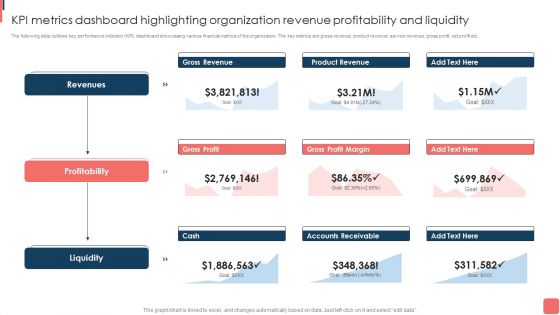
KPI Metrics Dashboard Highlighting Organization Revenue Profitability And Liquidity Template PDF
The following slide outlines key performance indicator KPI dashboard showcasing various financial metrics of the organization. The key metrics are gross revenue, product revenue, service revenue, gross profit, net profit etc. This KPI Metrics Dashboard Highlighting Organization Revenue Profitability And Liquidity Template PDF from Slidegeeks makes it easy to present information on your topic with precision. It provides customization options, so you can make changes to the colors, design, graphics, or any other component to create a unique layout. It is also available for immediate download, so you can begin using it right away. Slidegeeks has done good research to ensure that you have everything you need to make your presentation stand out. Make a name out there for a brilliant performance.
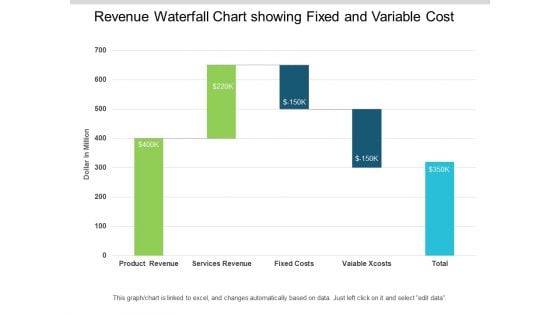
Revenue Waterfall Chart Showing Fixed And Variable Cost Ppt PowerPoint Presentation Infographic Template Images
This is a revenue waterfall chart showing fixed and variable cost ppt powerpoint presentation infographic template images. This is a five stage process. The stages in this process are sales waterfall, waterfall chart, business.
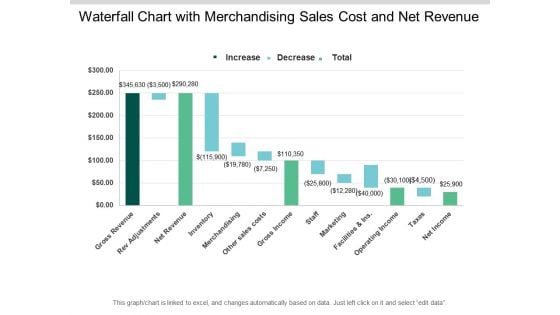
Waterfall Chart With Merchandising Sales Cost And Net Revenue Ppt PowerPoint Presentation Summary Show
This is a waterfall chart with merchandising sales cost and net revenue ppt powerpoint presentation summary show. This is a three stage process. The stages in this process are sales waterfall, waterfall chart, business.
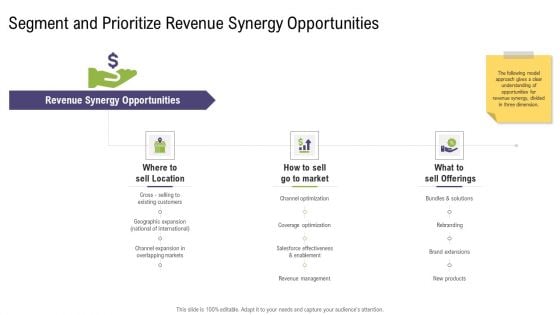
Segment And Prioritize Revenue Synergy Opportunities Mergers And Acquisitions Synergy Ppt Summary Outline PDF
This is a segment and prioritize revenue synergy opportunities mergers and acquisitions synergy ppt summary outline pdf template with various stages. Focus and dispense information on three stages using this creative set, that comes with editable features. It contains large content boxes to add your information on topics like location, market, management, revenue, optimization. You can also showcase facts, figures, and other relevant content using this PPT layout. Grab it now.
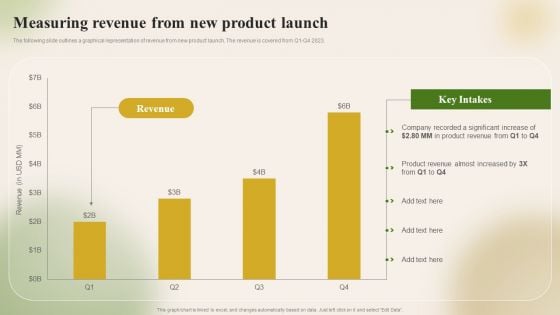
Introducing New Food Commodity Measuring Revenue From New Product Launch Download PDF
The following slide outlines a graphical representation of revenue from new product launch. The revenue is covered from Q1-Q4 2023. If you are looking for a format to display your unique thoughts, then the professionally designed Introducing New Food Commodity Measuring Revenue From New Product Launch Download PDF is the one for you. You can use it as a Google Slides template or a PowerPoint template. Incorporate impressive visuals, symbols, images, and other charts. Modify or reorganize the text boxes as you desire. Experiment with shade schemes and font pairings. Alter, share or cooperate with other people on your work. Download Introducing New Food Commodity Measuring Revenue From New Product Launch Download PDF and find out how to give a successful presentation. Present a perfect display to your team and make your presentation unforgettable.
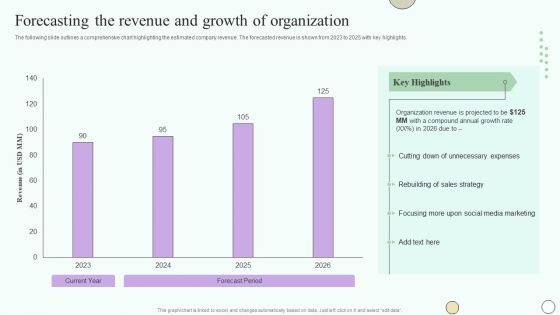
Estimating Business Overall Forecasting The Revenue And Growth Of Organization Topics PDF
The following slide outlines a comprehensive chart highlighting the estimated company revenue. The forecasted revenue is shown from 2023 to 2025 with key highlights. Whether you have daily or monthly meetings, a brilliant presentation is necessary. Estimating Business Overall Forecasting The Revenue And Growth Of Organization Topics PDFcan be your best option for delivering a presentation. Represent everything in detail using Estimating Business Overall Forecasting The Revenue And Growth Of Organization Topics PDF and make yourself stand out in meetings. The template is versatile and follows a structure that will cater to your requirements. All the templates prepared by Slidegeeks are easy to download and edit. Our research experts have taken care of the corporate themes as well. So, give it a try and see the results.
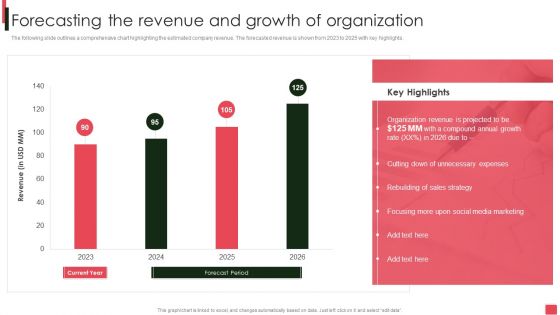
Overview Of Organizational Forecasting The Revenue And Growth Of Organization Template PDF
The following slide outlines a comprehensive chart highlighting the estimated company revenue. The forecasted revenue is shown from 2023 to 2025 with key highlights. Whether you have daily or monthly meetings, a brilliant presentation is necessary. Overview Of Organizational Forecasting The Revenue And Growth Of Organization Template PDF can be your best option for delivering a presentation. Represent everything in detail using Overview Of Organizational Forecasting The Revenue And Growth Of Organization Template PDF and make yourself stand out in meetings. The template is versatile and follows a structure that will cater to your requirements. All the templates prepared by Slidegeeks are easy to download and edit. Our research experts have taken care of the corporate themes as well. So, give it a try and see the results.

Trade Event Tactics To Boost Impact 1 Increase In Annual Sales Revenue SA SS V
This slide showcases an increase in business sales revenue compared to the previous year due to effective sales networking strategy implementation. Explore a selection of the finest Trade Event Tactics To Boost Impact 1 Increase In Annual Sales Revenue SA SS V here. With a plethora of professionally designed and pre-made slide templates, you can quickly and easily find the right one for your upcoming presentation. You can use our Trade Event Tactics To Boost Impact 1 Increase In Annual Sales Revenue SA SS V to effectively convey your message to a wider audience. Slidegeeks has done a lot of research before preparing these presentation templates. The content can be personalized and the slides are highly editable. Grab templates today from Slidegeeks. This slide showcases an increase in business sales revenue compared to the previous year due to effective sales networking strategy implementation.
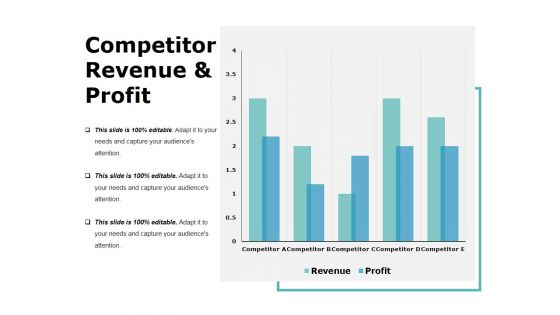
Competitor Revenue And Profit Template Ppt PowerPoint Presentation Model Design Inspiration
This is a competitor revenue and profit template ppt powerpoint presentation model design inspiration. This is a five stage process. The stages in this process are business, marketing, graph, success, growth.
Competitor Revenue And Profit Template 1 Ppt PowerPoint Presentation Layouts Display
This is a competitor revenue and profit template 1 ppt powerpoint presentation layouts display. This is a five stage process. The stages in this process are business, bar graph, finance, marketing, analysis.
Competitor Revenue And Profit Template 2 Ppt PowerPoint Presentation Styles Examples
This is a competitor revenue and profit template 2 ppt powerpoint presentation styles examples. This is a five stage process. The stages in this process are business, process, management, strategy, competitor.
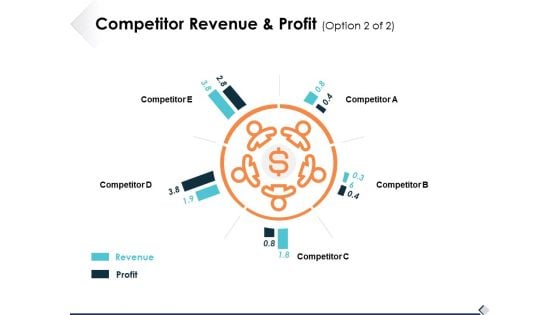
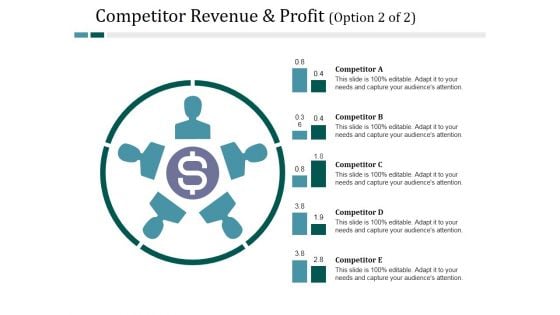
Competitor Revenue And Profit Option 2 Of 2 Ppt PowerPoint Presentation Show Design Templates
This is a competitor revenue and profit option 2 of 2 ppt powerpoint presentation show design templates. This is a five stage process. The stages in this process are business, management, strategy, analysis, marketing.
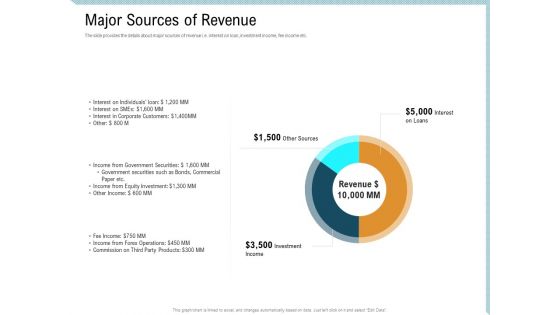
Investor Pitch Deck Collect Capital Financial Market Major Sources Of Revenue Template PDF
The slide provides the details about major sources of revenue i.e. interest on loan, investment income, fee income etc. Deliver an awe-inspiring pitch with this creative investor pitch deck collect capital financial market major sources of revenue template pdf bundle. Topics like other sources, investment income, interest on loans can be discussed with this completely editable template. It is available for immediate download depending on the needs and requirements of the user.
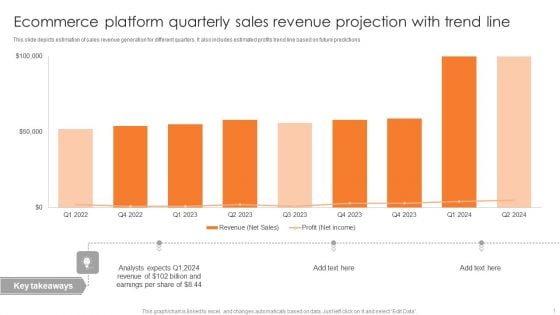
Ecommerce Platform Quarterly Sales Revenue Projection With Trend Line Inspiration PDF
This slide depicts estimation of sales revenue generation for different quarters. It also includes estimated profits trend line based on future predictions. Showcasing this set of slides titled Ecommerce Platform Quarterly Sales Revenue Projection With Trend Line Inspiration PDF. The topics addressed in these templates are Analysts Expects, Earnings Per Share, 2022 To 2024. All the content presented in this PPT design is completely editable. Download it and make adjustments in color, background, font etc. as per your unique business setting.
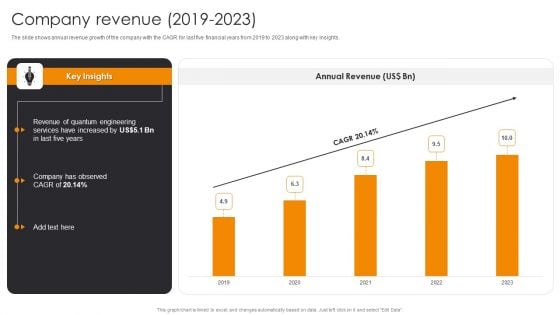
Company Revenue 2019 To 2023 Engineering Company Financial Analysis Report Structure PDF
The slide shows annual revenue growth of the company with the CAGR for last five financial years from 2019 to 2023 along with key insights.Presenting this PowerPoint presentation, titled Company Revenue 2019 To 2023 Engineering Company Financial Analysis Report Structure PDF, with topics curated by our researchers after extensive research. This editable presentation is available for immediate download and provides attractive features when used. Download now and captivate your audience. Presenting this Company Revenue 2019 To 2023 Engineering Company Financial Analysis Report Structure PDF. Our researchers have carefully researched and created these slides with all aspects taken into consideration. This is a completely customizable Company Revenue 2019 To 2023 Engineering Company Financial Analysis Report Structure PDF that is available for immediate downloading. Download now and make an impact on your audience. Highlight the attractive features available with our PPTs.
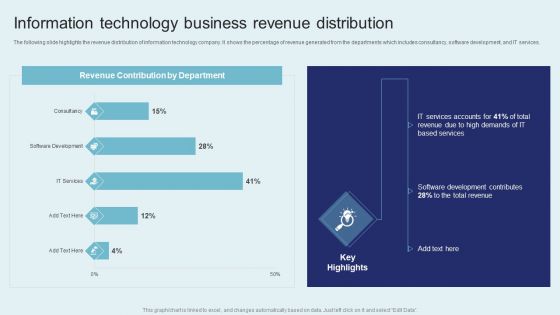
IT Firm Financial Statement Information Technology Business Revenue Distribution Portrait PDF
The following slide highlights the revenue distribution of information technology company. It shows the percentage of revenue generated from the departments which includes consultancy, software development, and IT services. Create an editable IT Firm Financial Statement Information Technology Business Revenue Distribution Portrait PDF that communicates your idea and engages your audience. Whether you are presenting a business or an educational presentation, pre designed presentation templates help save time. IT Firm Financial Statement Information Technology Business Revenue Distribution Portrait PDF is highly customizable and very easy to edit, covering many different styles from creative to business presentations. Slidegeeks has creative team members who have crafted amazing templates. So, go and get them without any delay.
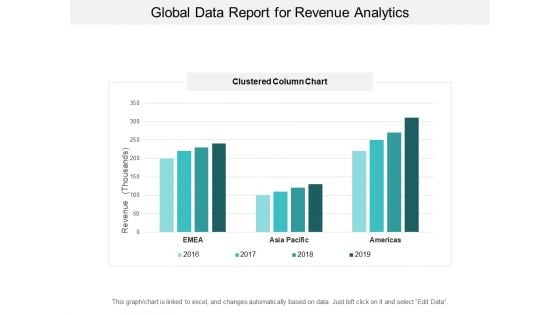
Global Data Report For Revenue Analytics Ppt PowerPoint Presentation Inspiration Visuals
This is a global data report for revenue analytics ppt powerpoint presentation inspiration visuals. This is a four stage process. The stages in this process are financial analysis, quantitative, statistical modelling.
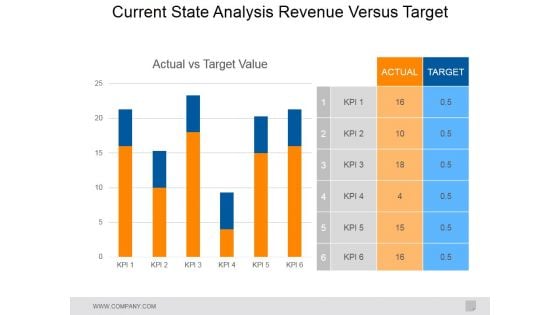
Current State Analysis Revenue Versus Target Ppt PowerPoint Presentation Model Smartart
This is a current state analysis revenue versus target ppt powerpoint presentation model smartart. This is a two stage process. The stages in this process are actual, target, actual vs target value.
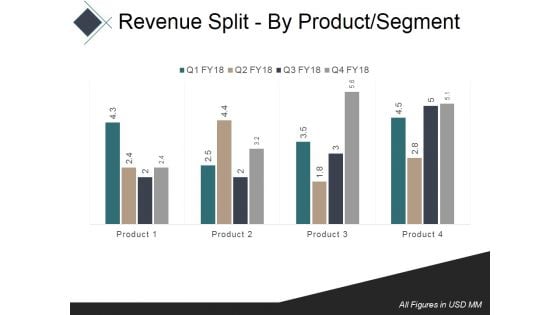
Revenue Split By Product Segment Template 1 Ppt PowerPoint Presentation Summary Example
This is a revenue split by product segment template 1 ppt powerpoint presentation summary example. This is a four stage process. The stages in this process are bar, business, marketing, finance, analysis.
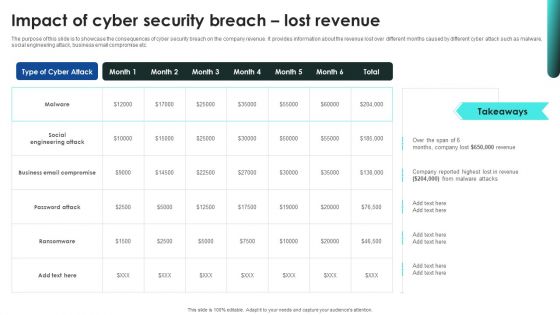
Implementing Cybersecurity Awareness Program To Prevent Attacks Impact Of Cyber Security Breach Lost Revenue Template PDF
The purpose of this slide is to showcase the consequences of cyber security breach on the company revenue. It provides information about the revenue lost over different months caused by different cyber attack such as malware, social engineering attack, business email compromise etc. Crafting an eye catching presentation has never been more straightforward. Let your presentation shine with this tasteful yet straightforward Implementing Cybersecurity Awareness Program To Prevent Attacks Impact Of Cyber Security Breach Lost Revenue Template PDF template. It offers a minimalistic and classy look that is great for making a statement. The colors have been employed intelligently to add a bit of playfulness while still remaining professional. Construct the ideal Implementing Cybersecurity Awareness Program To Prevent Attacks Impact Of Cyber Security Breach Lost Revenue Template PDF that effortlessly grabs the attention of your audience. Begin now and be certain to wow your customers.

Workforce Competency Enhancement Effect Of Poor Cloud Knowledge On Organizational Revenue DTE SS V
This slide showcase decreasing trend of revenue due to lack of skillsets and cloud knowledge to cater project coming in organization. If you are looking for a format to display your unique thoughts, then the professionally designed Workforce Competency Enhancement Effect Of Poor Cloud Knowledge On Organizational Revenue DTE SS V is the one for you. You can use it as a Google Slides template or a PowerPoint template. Incorporate impressive visuals, symbols, images, and other charts. Modify or reorganize the text boxes as you desire. Experiment with shade schemes and font pairings. Alter, share or cooperate with other people on your work. Download Workforce Competency Enhancement Effect Of Poor Cloud Knowledge On Organizational Revenue DTE SS V and find out how to give a successful presentation. Present a perfect display to your team and make your presentation unforgettable. This slide showcase decreasing trend of revenue due to lack of skillsets and cloud knowledge to cater project coming in organization.
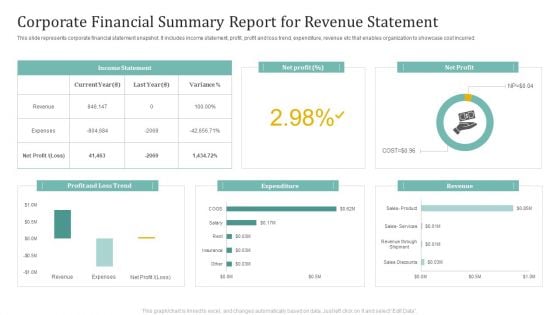
Corporate Financial Summary Report For Revenue Statement Ppt Ideas Graphic Images
This slide represents corporate financial statement snapshot. It includes income statement, profit, profit and loss trend, expenditure, revenue etc that enables organization to showcase cost incurred. Showcasing this set of slides titled Corporate Financial Summary Report For Revenue Statement Ppt Ideas Graphic Images. The topics addressed in these templates are Income Statement, Net Profit, Expenditure. All the content presented in this PPT design is completely editable. Download it and make adjustments in color, background, font etc. as per your unique business setting.
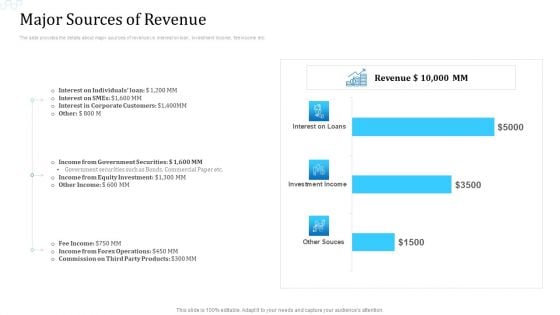
Investor Deck For Procuring Funds From Money Market Major Sources Of Revenue Download PDF
The slide provides the details about major sources of revenue i.e. interest on loan, investment income, fee income etc. Deliver and pitch your topic in the best possible manner with this investor deck for procuring funds from money market major sources of revenue download pdf. Use them to share invaluable insights on interest, investment, equity and impress your audience. This template can be altered and modified as per your expectations. So, grab it now.
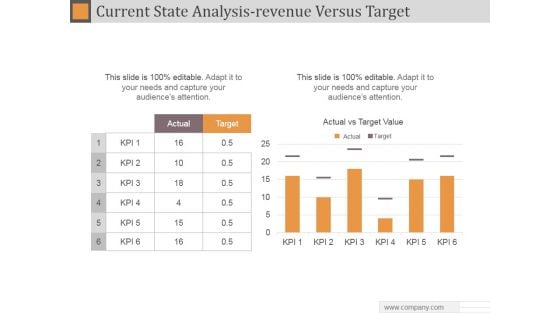
Current State Analysis Revenue Versus Target Ppt PowerPoint Presentation Background Designs
This is a current state analysis revenue versus target ppt powerpoint presentation background designs. This is a six stage process. The stages in this process are actual, target, actual vs target value.
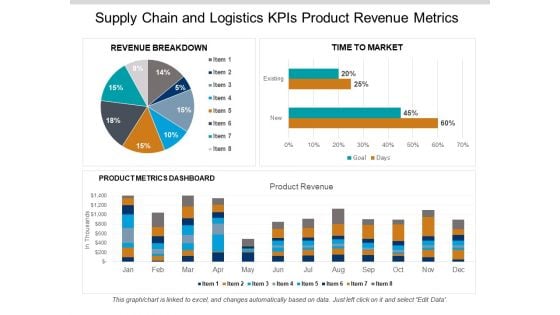
Supply Chain And Logistics Kpis Product Revenue Metrics Ppt PowerPoint Presentation Gallery Aids
This is a supply chain and logistics kpis product revenue metrics ppt powerpoint presentation gallery aids. This is a three stage process. The stages in this process are logistics performance, logistics dashboard, logistics kpis.

Retail KPI Dashboard Showing Revenue Vs Units Sold Ppt PowerPoint Presentation Professional Smartart
This is a retail kpi dashboard showing revenue vs units sold ppt powerpoint presentation professional smartart. This is a four stage process. The stages in this process are finance, analysis, business, investment, marketing.
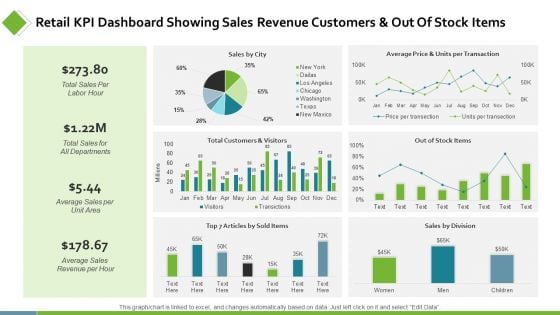
Retail KPI Dashboard Showing Sales Revenue Customers Ppt PowerPoint Presentation Show Background Designs
This is a retail kpi dashboard showing sales revenue customers ppt powerpoint presentation show background designs. This is a six stage process. The stages in this process are finance, analysis, business, investment, marketing.
Revenue Sources Appnexus Capital Raising Elevator Ppt Styles Graphic Tips PDF
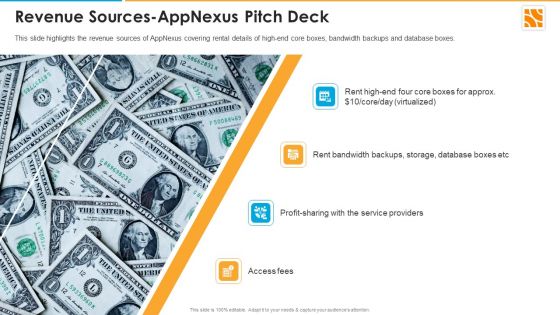
This slide highlights the revenue sources of AppNexus covering rental details of high-end core boxes, bandwidth backups and database boxes. Presenting revenue sources appnexus capital raising elevator ppt styles graphic tips pdf to provide visual cues and insights. Share and navigate important information on four stages that need your due attention. This template can be used to pitch topics like service, database. In addtion, this PPT design contains high resolution images, graphics, etc, that are easily editable and available for immediate download.
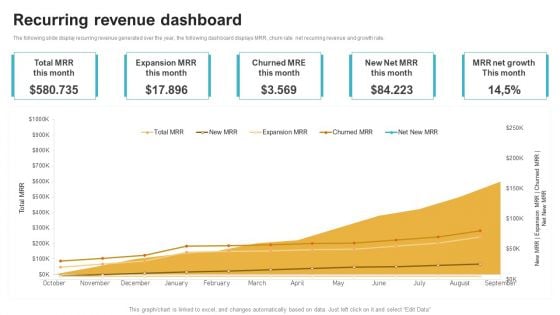
Saas Continuous Income Generation Model For Software Startup Recurring Revenue Dashboard Demonstration PDF
The following slide display recurring revenue generated over the year, the following dashboard displays MRR, churn rate net recurring revenue and growth rate. Explore a selection of the finest Saas Continuous Income Generation Model For Software Startup Recurring Revenue Dashboard Demonstration PDF here. With a plethora of professionally designed and pre made slide templates, you can quickly and easily find the right one for your upcoming presentation. You can use our Saas Continuous Income Generation Model For Software Startup Recurring Revenue Dashboard Demonstration PDF to effectively convey your message to a wider audience. Slidegeeks has done a lot of research before preparing these presentation templates. The content can be personalized and the slides are highly editable. Grab templates today from Slidegeeks.

Smartphone Game Development And Advertising Technique Global Gaming Industry Revenue By Country Inspiration PDF
The following slide highlights revenue of gaming industry per country, it segregated these geographical locations on the basis of total revenue potential and number of active players. Get a simple yet stunning designed Smartphone Game Development And Advertising Technique Global Gaming Industry Revenue By Country Inspiration PDF. It is the best one to establish the tone in your meetings. It is an excellent way to make your presentations highly effective. So, download this PPT today from Slidegeeks and see the positive impacts. Our easy to edit Smartphone Game Development And Advertising Technique Global Gaming Industry Revenue By Country Inspiration PDF can be your go to option for all upcoming conferences and meetings. So, what are you waiting for Grab this template today.
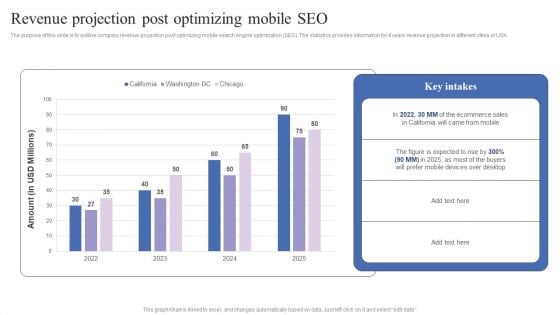
Revenue Projection Post Optimizing Mobile Seo Mobile Search Engine Optimization Guide Mockup PDF
The purpose of this slide is to outline company revenue projection post optimizing mobile search engine optimization SEO. The statistics provides information for 4 years revenue projection in different cities of USA. This Revenue Projection Post Optimizing Mobile Seo Mobile Search Engine Optimization Guide Mockup PDF is perfect for any presentation, be it in front of clients or colleagues. It is a versatile and stylish solution for organizing your meetings. The Revenue Projection Post Optimizing Mobile Seo Mobile Search Engine Optimization Guide Mockup PDF features a modern design for your presentation meetings. The adjustable and customizable slides provide unlimited possibilities for acing up your presentation. Slidegeeks has done all the homework before launching the product for you. So, do not wait, grab the presentation templates today.


 Continue with Email

 Home
Home


