Road Icon
Dashboard Tracking Ambassador Implementing Social Media Tactics For Boosting WOM Demonstration Pdf
This slide covers the KPI dashboard for companies to evaluate the performance of ambassador marketing campaigns. It includes metrics such as the number of brand ambassadors, the total number of shares, clicks, CPS, revenue, commissions, etc.Find highly impressive Dashboard Tracking Ambassador Implementing Social Media Tactics For Boosting WOM Demonstration Pdf on Slidegeeks to deliver a meaningful presentation. You can save an ample amount of time using these presentation templates. No need to worry to prepare everything from scratch because Slidegeeks experts have already done a huge research and work for you. You need to download Dashboard Tracking Ambassador Implementing Social Media Tactics For Boosting WOM Demonstration Pdf for your upcoming presentation. All the presentation templates are 100 percent editable and you can change the color and personalize the content accordingly. Download now This slide covers the KPI dashboard for companies to evaluate the performance of ambassador marketing campaigns. It includes metrics such as the number of brand ambassadors, the total number of shares, clicks, CPS, revenue, commissions, etc.
How To Create Cost Effective Dashboard For Tracking Facebook Post Strategy SS V
The following slide outlines dashboard through which advertisers can manage Facebook post performance and optimize their marketing strategy. Information covered in this slide is related to key metrics such as impressions per post, engagement rate, click-through rate CTR, likes, etc. Do you have an important presentation coming up Are you looking for something that will make your presentation stand out from the rest Look no further than How To Create Cost Effective Dashboard For Tracking Facebook Post Strategy SS V. With our professional designs, you can trust that your presentation will pop and make delivering it a smooth process. And with Slidegeeks, you can trust that your presentation will be unique and memorable. So why wait Grab How To Create Cost Effective Dashboard For Tracking Facebook Post Strategy SS V today and make your presentation stand out from the rest The following slide outlines dashboard through which advertisers can manage Facebook post performance and optimize their marketing strategy. Information covered in this slide is related to key metrics such as impressions per post, engagement rate, click-through rate CTR, likes, etc.
KPI Dashboard For Tracking Business Investment Portfolio Investment Fund PPT Example
Mentioned slide demonstrates the key performance indicator dashboard of the business financial portfolio.It includes key elements such as portfolio value, yield cost ratio, annual dividends, unrealized gains, investment style, investment allocation by sectors, etc. Here you can discover an assortment of the finest PowerPoint and Google Slides templates. With these templates, you can create presentations for a variety of purposes while simultaneously providing your audience with an eye catching visual experience. Download KPI Dashboard For Tracking Business Investment Portfolio Investment Fund PPT Example to deliver an impeccable presentation. These templates will make your job of preparing presentations much quicker, yet still, maintain a high level of quality. Slidegeeks has experienced researchers who prepare these templates and write high quality content for you. Later on, you can personalize the content by editing the KPI Dashboard For Tracking Business Investment Portfolio Investment Fund PPT Example. Mentioned slide demonstrates the key performance indicator dashboard of the business financial portfolio.It includes key elements such as portfolio value, yield cost ratio, annual dividends, unrealized gains, investment style, investment allocation by sectors, etc.
Daily Food Order Delivery Tracking Sheet Strategic Advertising Plan For Bakehouse Introduction Pdf
This slide provides glimpse about tracking chart of all the online orders received by the certain branch of the bakery. It includes order ID, status, date, time, customer, dasher, channel, subtotal, food ratings by customer, etc.There are so many reasons you need a Daily Food Order Delivery Tracking Sheet Strategic Advertising Plan For Bakehouse Introduction Pdf. The first reason is you can not spend time making everything from scratch, Thus, Slidegeeks has made presentation templates for you too. You can easily download these templates from our website easily. This slide provides glimpse about tracking chart of all the online orders received by the certain branch of the bakery. It includes order ID, status, date, time, customer, dasher, channel, subtotal, food ratings by customer, etc.
Monthly Sales Performance Tracking And Implementing Strategies To Improve Template Pdf
This slide showcases a dashboard presenting various metrics to measure and analyze sales performance for revenue growth. It includes key components such as number of sales, revenue, profit, cost, sales revenue, sales increment, cost analysis and cross sell.This Monthly Sales Performance Tracking And Implementing Strategies To Improve Template Pdf is perfect for any presentation, be it in front of clients or colleagues. It is a versatile and stylish solution for organizing your meetings. The product name features a modern design for your presentation meetings. The adjustable and customizable slides provide unlimited possibilities for acing up your presentation. Slidegeeks has done all the homework before launching the product for you. So, do not wait, grab the presentation templates today This slide showcases a dashboard presenting various metrics to measure and analyze sales performance for revenue growth. It includes key components such as number of sales, revenue, profit, cost, sales revenue, sales increment, cost analysis and cross sell.
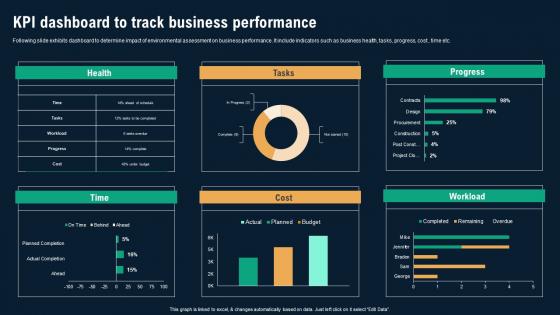
KPI Dashboard To Track Business Performance Business Environmental Analysis Formats Pdf
Following slide exhibits dashboard to determine impact of environmental assessment on business performance. It include indicators such as business health, tasks, progress, cost , time etc. The KPI Dashboard To Track Business Performance Business Environmental Analysis Formats Pdf is a compilation of the most recent design trends as a series of slides. It is suitable for any subject or industry presentation, containing attractive visuals and photo spots for businesses to clearly express their messages. This template contains a variety of slides for the user to input data, such as structures to contrast two elements, bullet points, and slides for written information. Slidegeeks is prepared to create an impression. Following slide exhibits dashboard to determine impact of environmental assessment on business performance. It include indicators such as business health, tasks, progress, cost , time etc.
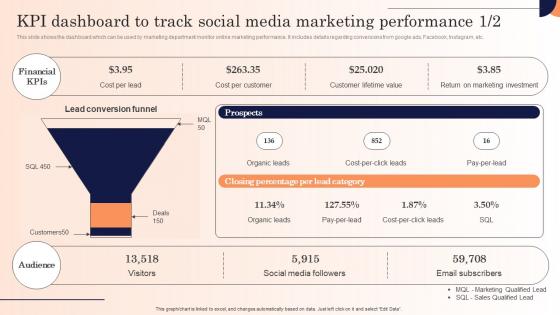
Kpi Dashboard To Track Social Media Marketing Strategic Marketing Campaign Inspiration Pdf
This slide shows the dashboard which can be used by marketing department monitor online marketing performance. It includes details regarding conversions from google ads, Facebook, Instagram, etc.Welcome to our selection of the Kpi Dashboard To Track Social Media Marketing Strategic Marketing Campaign Inspiration Pdf. These are designed to help you showcase your creativity and bring your sphere to life. Planning and Innovation are essential for any business that is just starting out. This collection contains the designs that you need for your everyday presentations. All of our PowerPoints are 100Precent editable, so you can customize them to suit your needs. This multi-purpose template can be used in various situations. Grab these presentation templates today. This slide shows the dashboard which can be used by marketing department monitor online marketing performance. It includes details regarding conversions from google ads, Facebook, Instagram, etc.
Tracking The Improvements Paid Media Advertising For Optimizing Customer Brochure Pdf
This slide showcases the KPIs that would help the business organization to evaluate paid media marketing campaigns improvements. It includes clicks, impressions, conversions, conversion rate, cost, CTR Click Through Rate, cost conversion, etc. Slidegeeks has constructed Tracking The Improvements Paid Media Advertising For Optimizing Customer Brochure Pdf after conducting extensive research and examination. These presentation templates are constantly being generated and modified based on user preferences and critiques from editors. Here, you will find the most attractive templates for a range of purposes while taking into account ratings and remarks from users regarding the content. This is an excellent jumping off point to explore our content and will give new users an insight into our top notch PowerPoint Templates. This slide showcases the KPIs that would help the business organization to evaluate paid media marketing campaigns improvements. It includes clicks, impressions, conversions, conversion rate, cost, CTR Click Through Rate, cost conversion, etc.
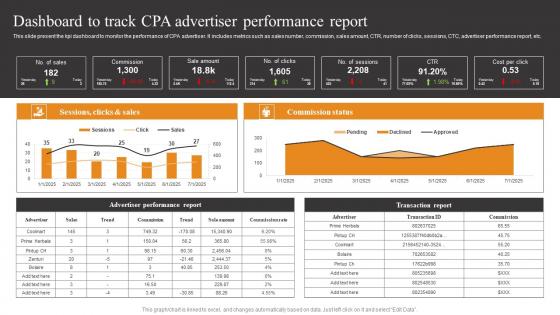
Dashboard To Track CPA Tactics To Optimize Corporate Performance Information Pdf
This slide present the kpi dashboard to monitor the performance of CPA advertiser. It includes metrics such as sales number, commission, sales amount, CTR, number of clicks, sessions, CTC, advertiser performance report, etc. Slidegeeks is here to make your presentations a breeze with Dashboard To Track CPA Tactics To Optimize Corporate Performance Information Pdf With our easy to use and customizable templates, you can focus on delivering your ideas rather than worrying about formatting. With a variety of designs to choose from, you are sure to find one that suits your needs. And with animations and unique photos, illustrations, and fonts, you can make your presentation pop. So whether you are giving a sales pitch or presenting to the board, make sure to check out Slidegeeks first. This slide present the kpi dashboard to monitor the performance of CPA advertiser. It includes metrics such as sales number, commission, sales amount, CTR, number of clicks, sessions, CTC, advertiser performance report, etc.
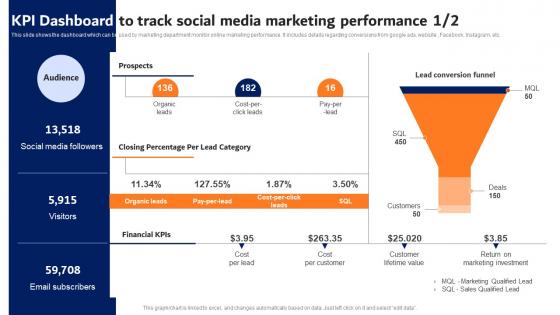
Digital Advertising Strategies KPI Dashboard To Track Social Media Infographics Pdf
This slide shows the dashboard which can be used by marketing department monitor online marketing performance. It includes details regarding conversions from google ads, website , Facebook, Instagram, etc. Make sure to capture your audiences attention in your business displays with our gratis customizable Digital Advertising Strategies KPI Dashboard To Track Social Media Infographics Pdf. These are great for business strategies, office conferences, capital raising or task suggestions. If you desire to acquire more customers for your tech business and ensure they stay satisfied, create your own sales presentation with these plain slides. This slide shows the dashboard which can be used by marketing department monitor online marketing performance. It includes details regarding conversions from google ads, website , Facebook, Instagram, etc.
KPI Dashboard For Tracking Increasing Client Retention Through Efficient Formats Pdf
This slide covers the dashboard for analyzing customer loyalty with metrics such as NPS, loyal customer rate, premium users, CLV, customer churn, revenue churn, net retention, MRR growth, etc. The best PPT templates are a great way to save time, energy, and resources. Slidegeeks have 100 percent editable powerpoint slides making them incredibly versatile. With these quality presentation templates, you can create a captivating and memorable presentation by combining visually appealing slides and effectively communicating your message. Download KPI Dashboard For Tracking Increasing Client Retention Through Efficient Formats Pdf from Slidegeeks and deliver a wonderful presentation. This slide covers the dashboard for analyzing customer loyalty with metrics such as NPS, loyal customer rate, premium users, CLV, customer churn, revenue churn, net retention, MRR growth, etc.
Action Measures To Build Staff Employee Performance Tracking And Management Background Pdf
This slide showcases a dashboard presenting various metrics to measure and analyze employee overall performance. It outlines information about average absenteeism rate, yearly average overtime hours, training costs and overall labor effectiveness. Present like a pro with Action Measures To Build Staff Employee Performance Tracking And Management Background Pdf Create beautiful presentations together with your team, using our easy-to-use presentation slides. Share your ideas in real-time and make changes on the fly by downloading our templates. So whether you are in the office, on the go, or in a remote location, you can stay in sync with your team and present your ideas with confidence. With Slidegeeks presentation got a whole lot easier. Grab these presentations today. This slide showcases a dashboard presenting various metrics to measure and analyze employee overall performance. It outlines information about average absenteeism rate, yearly average overtime hours, training costs and overall labor effectiveness.
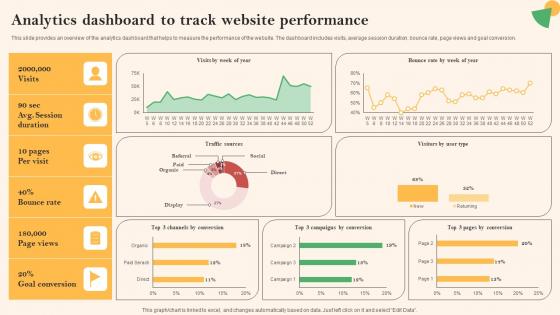
Social Media Marketing To Boost Analytics Dashboard To Track Website Performance Pictures Pdf
This slide provides an overview of the analytics dashboard that helps to measure the performance of the website. The dashboard includes visits, average session duration, bounce rate, page views and goal conversion. Slidegeeks is one of the best resources for PowerPoint templates. You can download easily and regulate Social Media Marketing To Boost Analytics Dashboard To Track Website Performance Pictures Pdf for your personal presentations from our wonderful collection. A few clicks is all it takes to discover and get the most relevant and appropriate templates. Use our Templates to add a unique zing and appeal to your presentation and meetings. All the slides are easy to edit and you can use them even for advertisement purposes. This slide provides an overview of the analytics dashboard that helps to measure the performance of the website. The dashboard includes visits, average session duration, bounce rate, page views and goal conversion.
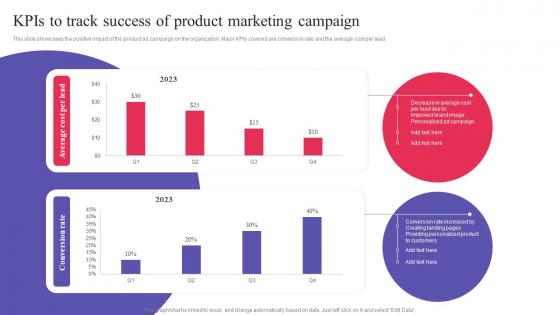
KPIs To Track Success Of Product Marketing Digital Promotional Campaign Demonstration Pdf
This slide showcases the positive impact of the product ad campaign on the organization. Major KPIs covered are conversion rate and the average cost per lead. Welcome to our selection of the KPIs To Track Success Of Product Marketing Digital Promotional Campaign Demonstration Pdf. These are designed to help you showcase your creativity and bring your sphere to life. Planning and Innovation are essential for any business that is just starting out. This collection contains the designs that you need for your everyday presentations. All of our PowerPoints are 100 percent editable, so you can customize them to suit your needs. This multi-purpose template can be used in various situations. Grab these presentation templates today. This slide showcases the positive impact of the product ad campaign on the organization. Major KPIs covered are conversion rate and the average cost per lead.
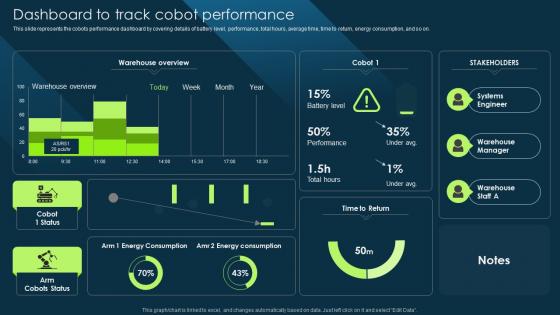
Dashboard To Track Cobot Performance Cobot Safety Measures And Risk Template PDF
This slide represents the cobots performance dashboard by covering details of battery level, performance, total hours, average time, time to return, energy consumption, and so on. Are you in need of a template that can accommodate all of your creative concepts This one is crafted professionally and can be altered to fit any style. Use it with Google Slides or PowerPoint. Include striking photographs, symbols, depictions, and other visuals. Fill, move around, or remove text boxes as desired. Test out color palettes and font mixtures. Edit and save your work, or work with colleagues. Download Dashboard To Track Cobot Performance Cobot Safety Measures And Risk Template PDF and observe how to make your presentation outstanding. Give an impeccable presentation to your group and make your presentation unforgettable. This slide represents the cobots performance dashboard by covering details of battery level, performance, total hours, average time, time to return, energy consumption, and so on.
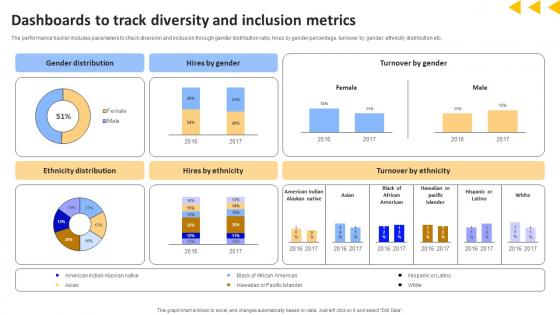
Workforce Productivity Improvement Dashboards To Track Diversity And Inclusion Metrics Structure Pdf
The performance tracker includes parameters to check diversion and inclusion through gender distribution ratio, hires by gender percentage, turnover by gender, ethnicity distribution etc. Coming up with a presentation necessitates that the majority of the effort goes into the content and the message you intend to convey. The visuals of a PowerPoint presentation can only be effective if it supplements and supports the story that is being told. Keeping this in mind our experts created Workforce Productivity Improvement Dashboards To Track Diversity And Inclusion Metrics Structure Pdf to reduce the time that goes into designing the presentation. This way, you can concentrate on the message while our designers take care of providing you with the right template for the situation. The performance tracker includes parameters to check diversion and inclusion through gender distribution ratio, hires by gender percentage, turnover by gender, ethnicity distribution etc.
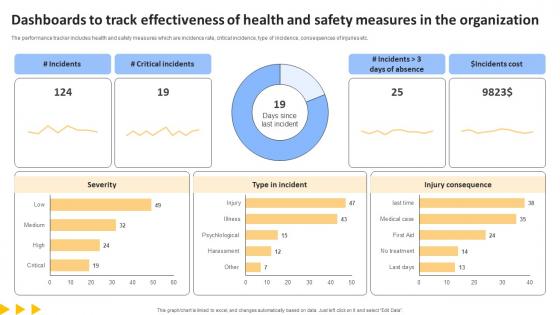
Workforce Productivity Improvement Dashboards To Track Effectiveness Of Health And Safety Topics Pdf
The performance tracker includes health and safety measures which are incidence rate, critical incidence, type of incidence, consequences of injuries etc. This modern and well arranged Workforce Productivity Improvement Dashboards To Track Effectiveness Of Health And Safety Topics Pdf provides lots of creative possibilities. It is very simple to customize and edit with the Powerpoint Software. Just drag and drop your pictures into the shapes. All facets of this template can be edited with Powerpoint, no extra software is necessary. Add your own material, put your images in the places assigned for them, adjust the colors, and then you can show your slides to the world, with an animated slide included. The performance tracker includes health and safety measures which are incidence rate, critical incidence, type of incidence, consequences of injuries etc.
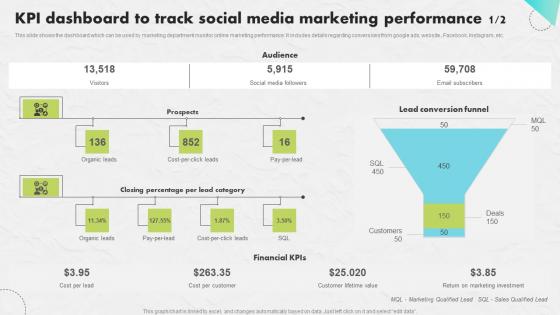
KPI Dashboard Track Social Developing An Impactful SEO Marketing Plan Graphics Pdf
This slide shows the dashboard which can be used by marketing department monitor online marketing performance. It includes details regarding conversions from google ads, website , Facebook, Instagram, etc. If your project calls for a presentation, then Slidegeeks is your go to partner because we have professionally designed, easy to edit templates that are perfect for any presentation. After downloading, you can easily edit KPI Dashboard Track Social Developing An Impactful SEO Marketing Plan Graphics Pdf and make the changes accordingly. You can rearrange slides or fill them with different images. Check out all the handy templates This slide shows the dashboard which can be used by marketing department monitor online marketing performance. It includes details regarding conversions from google ads, website , Facebook, Instagram, etc.
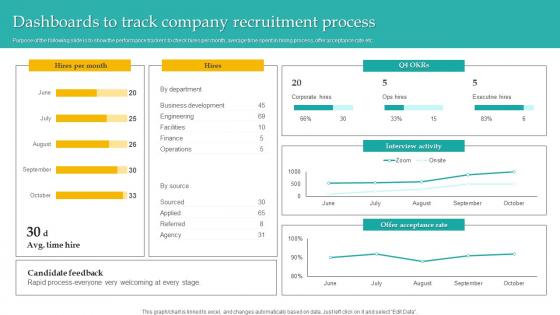
Dashboards To Track Company Administering Diversity And Inclusion At Workplace Mockup Pdf
Purpose of the following slide is to show the performance trackers to check hires per month, average time spent in hiring process, offer acceptance rate etc. From laying roadmaps to briefing everything in detail, our templates are perfect for you. You can set the stage with your presentation slides. All you have to do is download these easy to edit and customizable templates. Dashboards To Track Company Administering Diversity And Inclusion At Workplace Mockup Pdf will help you deliver an outstanding performance that everyone would remember and praise you for. Do download this presentation today. Purpose of the following slide is to show the performance trackers to check hires per month, average time spent in hiring process, offer acceptance rate etc.
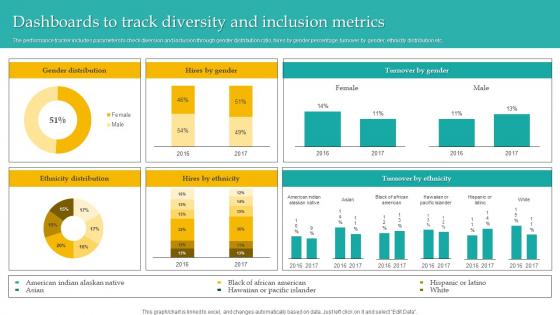
Dashboards Track Diversity Inclusion Administering Diversity And Inclusion At Workplace Template Pdf
The performance tracker includes parameters to check diversion and inclusion through gender distribution ratio, hires by gender percentage, turnover by gender, ethnicity distribution etc. Present like a pro with Dashboards Track Diversity Inclusion Administering Diversity And Inclusion At Workplace Template Pdf Create beautiful presentations together with your team, using our easy to use presentation slides. Share your ideas in real time and make changes on the fly by downloading our templates. So whether you are in the office, on the go, or in a remote location, you can stay in sync with your team and present your ideas with confidence. With Slidegeeks presentation got a whole lot easier. Grab these presentations today. The performance tracker includes parameters to check diversion and inclusion through gender distribution ratio, hires by gender percentage, turnover by gender, ethnicity distribution etc.
KPI Dashboard For Tracking Major Promotional Analytics Future Trends Clipart Pdf
This slide covers the dashboard for analysing email marketing metrics such as overall open rate, click through rate, click to open ratio, unsubscribe rate, hard bounce rate, soft rate, monthly open rate, total monthly subscribers, etc. The best PPT templates are a great way to save time, energy, and resources. Slidegeeks have 100 percent editable powerpoint slides making them incredibly versatile. With these quality presentation templates, you can create a captivating and memorable presentation by combining visually appealing slides and effectively communicating your message. Download KPI Dashboard For Tracking Major Promotional Analytics Future Trends Clipart Pdf from Slidegeeks and deliver a wonderful presentation. This slide covers the dashboard for analysing email marketing metrics such as overall open rate, click through rate, click to open ratio, unsubscribe rate, hard bounce rate, soft rate, monthly open rate, total monthly subscribers, etc.
Leveraging Logistics Automation Dashboard For Tracking Impact Of Procurement Ideas Pdf
This slide covers the dashboard for analysing procurement performance after automation. It include KPIs such as on time delivery, percentage of returns, compliance index percentage, procurement ROI, cost saving, budget spent on training, etc. Slidegeeks is here to make your presentations a breeze with Leveraging Logistics Automation Dashboard For Tracking Impact Of Procurement Ideas Pdf With our easy to use and customizable templates, you can focus on delivering your ideas rather than worrying about formatting. With a variety of designs to choose from, you are sure to find one that suits your needs. And with animations and unique photos, illustrations, and fonts, you can make your presentation pop. So whether you are giving a sales pitch or presenting to the board, make sure to check out Slidegeeks first. This slide covers the dashboard for analysing procurement performance after automation. It include KPIs such as on time delivery, percentage of returns, compliance index percentage, procurement ROI, cost saving, budget spent on training, etc.
Wom Marketing Campaign Return On Tracking Word Mouth Marketing Download PDF
This slide covers the graphical representation of return on investment from various promotional channels, such as referral marketing, affiliate marketing, influencer marketing, social media marketing, ambassador, etc. It also includes information about maximum and minimum ROI campaigns. Present like a pro with Wom Marketing Campaign Return On Tracking Word Mouth Marketing Download PDF Create beautiful presentations together with your team, using our easy-to-use presentation slides. Share your ideas in real-time and make changes on the fly by downloading our templates. So whether you are in the office, on the go, or in a remote location, you can stay in sync with your team and present your ideas with confidence. With Slidegeeks presentation got a whole lot easier. Grab these presentations today. This slide covers the graphical representation of return on investment from various promotional channels, such as referral marketing, affiliate marketing, influencer marketing, social media marketing, ambassador, etc. It also includes information about maximum and minimum ROI campaigns.
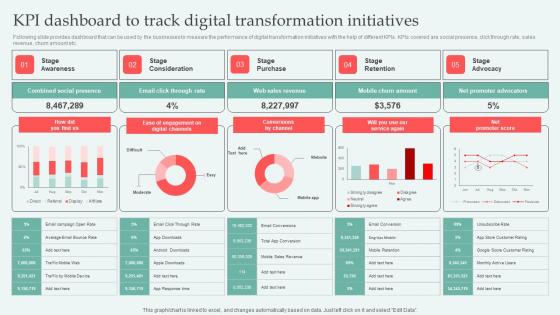
KPI Dashboard To Track Digital Approaches To Increase Business Growth Professional Pdf
Following slide provides dashboard that can be used by the businesses to measure the performance of digital transformation initiatives with the help of different KPIs. KPIs covered are social presence, click through rate, sales revenue, churn amount etc. If your project calls for a presentation, then Slidegeeks is your go to partner because we have professionally designed, easy to edit templates that are perfect for any presentation. After downloading, you can easily edit KPI Dashboard To Track Digital Approaches To Increase Business Growth Professional Pdf and make the changes accordingly. You can rearrange slides or fill them with different images. Check out all the handy templates Following slide provides dashboard that can be used by the businesses to measure the performance of digital transformation initiatives with the help of different KPIs. KPIs covered are social presence, click through rate, sales revenue, churn amount etc.
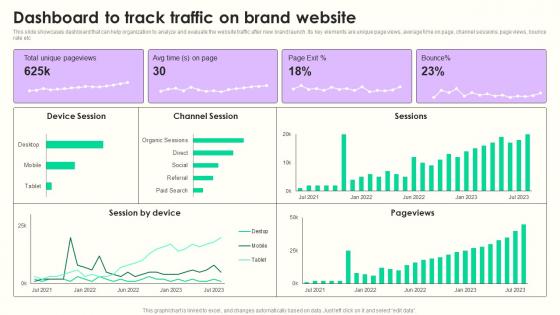
Dashboard To Track Traffic Maximizing Sales Via Online Brand Marketing Strategies Portrait Pdf
This slide showcases dashboard that can help organization to analyze and evaluate the website traffic after new brand launch. Its key elements are unique page views, average time on page, channel sessions, page views, bounce rate etc Boost your pitch with our creative Dashboard To Track Traffic Maximizing Sales Via Online Brand Marketing Strategies Portrait Pdf. Deliver an awe inspiring pitch that will mesmerize everyone. Using these presentation templates you will surely catch everyones attention. You can browse the ppts collection on our website. We have researchers who are experts at creating the right content for the templates. So you do not have to invest time in any additional work. Just grab the template now and use them. This slide showcases dashboard that can help organization to analyze and evaluate the website traffic after new brand launch. Its key elements are unique page views, average time on page, channel sessions, page views, bounce rate etc
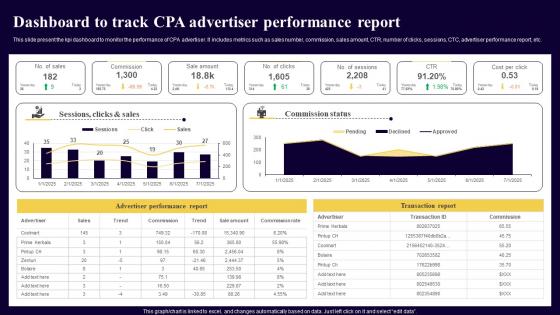
Dashboard To Track CPA Advertiser Performance Executing Cost Per Action Marketing Brochure Pdf
This slide present the kpi dashboard to monitor the performance of CPA advertiser. It includes metrics such as sales number, commission, sales amount, CTR, number of clicks, sessions, CTC, advertiser performance report, etc. Slidegeeks is here to make your presentations a breeze with Dashboard To Track CPA Advertiser Performance Executing Cost Per Action Marketing Brochure Pdf With our easy-to-use and customizable templates, you can focus on delivering your ideas rather than worrying about formatting. With a variety of designs to choose from, you are sure to find one that suits your needs. And with animations and unique photos, illustrations, and fonts, you can make your presentation pop. So whether you are giving a sales pitch or presenting to the board, make sure to check out Slidegeeks first. This slide present the kpi dashboard to monitor the performance of CPA advertiser. It includes metrics such as sales number, commission, sales amount, CTR, number of clicks, sessions, CTC, advertiser performance report, etc.
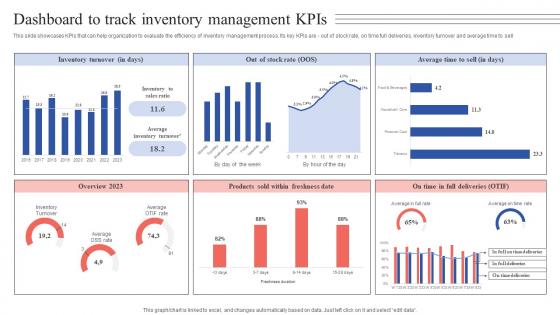
Dashboard To Track Inventory Management Kpis Tactical Guide Stock Administration Pictures Pdf
This slide showcases KPIs that can help organization to evaluate the efficiency of inventory management process. Its key KPIs are - out of stock rate, on time full deliveries, inventory turnover and average time to sell. Present like a pro with Dashboard To Track Inventory Management Kpis Tactical Guide Stock Administration Pictures Pdf Create beautiful presentations together with your team, using our easy-to-use presentation slides. Share your ideas in real-time and make changes on the fly by downloading our templates. So whether you are in the office, on the go, or in a remote location, you can stay in sync with your team and present your ideas with confidence. With Slidegeeks presentation got a whole lot easier. Grab these presentations today. This slide showcases KPIs that can help organization to evaluate the efficiency of inventory management process. Its key KPIs are - out of stock rate, on time full deliveries, inventory turnover and average time to sell.
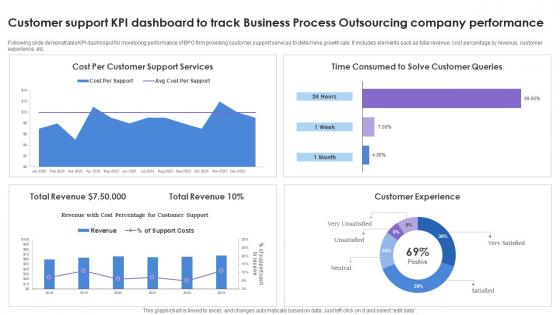
Customer Support KPI Dashboard To Track Business Process Outsourcing Company Performance Rules Pdf Wd
Following slide demonstrates KPI dashboard for monitoring performance of BPO firm providing customer support services to determine growth rate. It includes elements such as total revenue, cost percentage by revenue, customer experience, etc. Showcasing this set of slides titled Customer Support KPI Dashboard To Track Business Process Outsourcing Company Performance Rules Pdf Wd. The topics addressed in these templates are Customer Experience, Total Revenue. All the content presented in this PPT design is completely editable. Download it and make adjustments in color, background, font etc. as per your unique business setting. Following slide demonstrates KPI dashboard for monitoring performance of BPO firm providing customer support services to determine growth rate. It includes elements such as total revenue, cost percentage by revenue, customer experience, etc.
Bounce Rate KPI Tracking Dashboard With Average Pages And Time Inspiration Pdf
The following slide showcases dashboard that helps to identify the average time spent on page by visitors and the bounce rate. It also includes page load time, bounce rate by browser and details on internet explorer. Pitch your topic with ease and precision using this Bounce Rate KPI Tracking Dashboard With Average Pages And Time Inspiration Pdf. This layout presents information on Page Load Time, Bounce Rate, Internet Explorer. It is also available for immediate download and adjustment. So, changes can be made in the color, design, graphics or any other component to create a unique layout. The following slide showcases dashboard that helps to identify the average time spent on page by visitors and the bounce rate. It also includes page load time, bounce rate by browser and details on internet explorer.
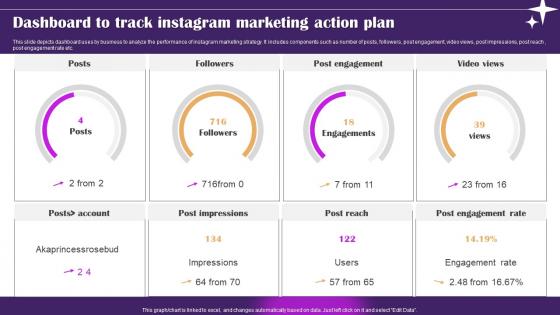
Dashboard To Track Instagram Marketing Action Plan Ppt Professional Image pdf
This slide depicts dashboard uses by business to analyze the performance of instagram marketing strategy. It includes components such as number of posts, followers, post engagement, video views, post impressions, post reach, post engagement rate etc. Showcasing this set of slides titled Dashboard To Track Instagram Marketing Action Plan Ppt Professional Image pdf. The topics addressed in these templates are Post Engagement, Video Views. All the content presented in this PPT design is completely editable. Download it and make adjustments in color, background, font etc. as per your unique business setting. This slide depicts dashboard uses by business to analyze the performance of instagram marketing strategy. It includes components such as number of posts, followers, post engagement, video views, post impressions, post reach , post engagement rate etc.
Student Data Tracking Application Dashboard Impact Of IoT Technology On Education IoT SS V
Following slide represents dashboard that provides accurate student data to analyze performance using educational apps. It includes metrics such as grades, attendance, average grades, progress rate, etc. From laying roadmaps to briefing everything in detail, our templates are perfect for you. You can set the stage with your presentation slides. All you have to do is download these easy-to-edit and customizable templates. Student Data Tracking Application Dashboard Impact Of IoT Technology On Education IoT SS V will help you deliver an outstanding performance that everyone would remember and praise you for. Do download this presentation today. Following slide represents dashboard that provides accurate student data to analyze performance using educational apps. It includes metrics such as grades, attendance, average grades, progress rate, etc.
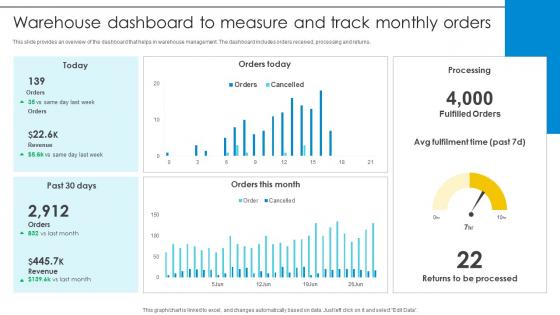
Warehouse Dashboard To Measure And Track Monthly Orders Optimizing Inventory Management IoT SS V
This slide provides an overview of the dashboard that helps in warehouse management. The dashboard includes orders received, processing and returns. Want to ace your presentation in front of a live audience Our Warehouse Dashboard To Measure And Track Monthly Orders Optimizing Inventory Management IoT SS V can help you do that by engaging all the users towards you. Slidegeeks experts have put their efforts and expertise into creating these impeccable powerpoint presentations so that you can communicate your ideas clearly. Moreover, all the templates are customizable, and easy-to-edit and downloadable. Use these for both personal and commercial use. This slide provides an overview of the dashboard that helps in warehouse management. The dashboard includes orders received, processing and returns.
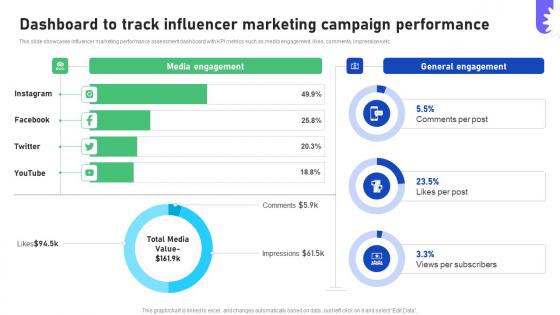
Improving Business Marketing Performance Dashboard To Track Influencer CRP DK SS V
This slide showcases influencer marketing performance assessment dashboard with KPI metrics such as media engagement, likes, comments, impressions etc. Are you in need of a template that can accommodate all of your creative concepts This one is crafted professionally and can be altered to fit any style. Use it with Google Slides or PowerPoint. Include striking photographs, symbols, depictions, and other visuals. Fill, move around, or remove text boxes as desired. Test out color palettes and font mixtures. Edit and save your work, or work with colleagues. Download Improving Business Marketing Performance Dashboard To Track Influencer CRP DK SS V and observe how to make your presentation outstanding. Give an impeccable presentation to your group and make your presentation unforgettable. This slide showcases influencer marketing performance assessment dashboard with KPI metrics such as media engagement, likes, comments, impressions etc.
Kpi Dashboard For Tracking Social Media Campaign Results Powerful Marketing Techniques Strategy SS V
This slide covers the dashboard for analyzing social media marketing campaigns. It includes metrics such as tweets, followers, followings, listed favorites, reach, views, Facebook engagement, clicks, likes, Instagram photos, etc. This Kpi Dashboard For Tracking Social Media Campaign Results Powerful Marketing Techniques Strategy SS V from Slidegeeks makes it easy to present information on your topic with precision. It provides customization options, so you can make changes to the colors, design, graphics, or any other component to create a unique layout. It is also available for immediate download, so you can begin using it right away. Slidegeeks has done good research to ensure that you have everything you need to make your presentation stand out. Make a name out there for a brilliant performance. This slide covers the dashboard for analyzing social media marketing campaigns. It includes metrics such as tweets, followers, followings, listed favorites, reach, views, Facebook engagement, clicks, likes, Instagram photos, etc.
Dashboards For Social Media Analytics Tracking And Monitoring Cracking The Code Of Social Media
This slide depicts the dashboard for Social Media Analytics insights. The purpose of this slide is to highlight insights such as brand awareness, audience growth, post engagement rate, provider analytics, etc. Boost your pitch with our creative Dashboards For Social Media Analytics Tracking And Monitoring Cracking The Code Of Social Media. Deliver an awe-inspiring pitch that will mesmerize everyone. Using these presentation templates you will surely catch everyones attention. You can browse the ppts collection on our website. We have researchers who are experts at creating the right content for the templates. So you do not have to invest time in any additional work. Just grab the template now and use them. This slide depicts the dashboard for Social Media Analytics insights. The purpose of this slide is to highlight insights such as brand awareness, audience growth, post engagement rate, provider analytics, etc.

Product Analytics Dashboard To Track Engagement Driving Business Success Integrating Product
This slide illustrates a dashboard to monitor customer engagement on company website by leveraging product analytics tools aimed at making necessary improvements. It covers insights regarding active monthly users, new users, total completed purchases, screen views, average duration of session, etc. There are so many reasons you need a Product Analytics Dashboard To Track Engagement Driving Business Success Integrating Product. The first reason is you can not spend time making everything from scratch, Thus, Slidegeeks has made presentation templates for you too. You can easily download these templates from our website easily. This slide illustrates a dashboard to monitor customer engagement on company website by leveraging product analytics tools aimed at making necessary improvements. It covers insights regarding active monthly users, new users, total completed purchases, screen views, average duration of session, etc.
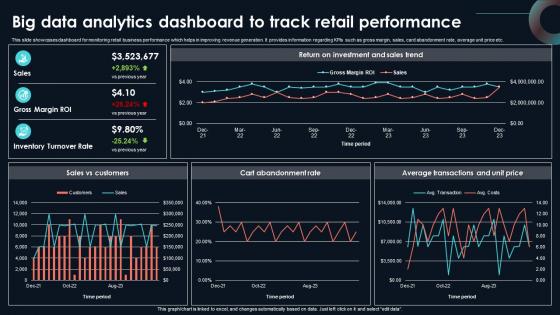
Big Data Analytics Dashboard To Track Developing Strategic Insights Using Big Data Analytics SS V
This slide showcases dashboard for monitoring retail business performance which helps in improving revenue generation. It provides information regarding KPIs such as gross margin, sales, card abandonment rate, average unit price etc. If your project calls for a presentation, then Slidegeeks is your go-to partner because we have professionally designed, easy-to-edit templates that are perfect for any presentation. After downloading, you can easily edit Big Data Analytics Dashboard To Track Developing Strategic Insights Using Big Data Analytics SS V and make the changes accordingly. You can rearrange slides or fill them with different images. Check out all the handy templates This slide showcases dashboard for monitoring retail business performance which helps in improving revenue generation. It provides information regarding KPIs such as gross margin, sales, card abandonment rate, average unit price etc.

Track Sales Performance Across Territories Efficient Sales Territory Management To Build SA SS V
This slide exhibits a graphical representation showcasing sales performance across segmented territories to compare revenue earned with set targets and optimise processes. The best PPT templates are a great way to save time, energy, and resources. Slidegeeks have 100 percent editable powerpoint slides making them incredibly versatile. With these quality presentation templates, you can create a captivating and memorable presentation by combining visually appealing slides and effectively communicating your message. Download Track Sales Performance Across Territories Efficient Sales Territory Management To Build SA SS V from Slidegeeks and deliver a wonderful presentation. This slide exhibits a graphical representation showcasing sales performance across segmented territories to compare revenue earned with set targets and optimise processes.
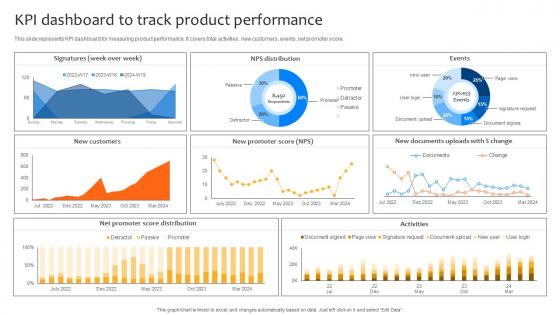
Deploying Strategies For Business KPI Dashboard To Track Product Performance Strategy SS V
This slide represents KPI dashboard for measuring product performance. It covers total activities, new customers, events, net promoter score. Coming up with a presentation necessitates that the majority of the effort goes into the content and the message you intend to convey. The visuals of a PowerPoint presentation can only be effective if it supplements and supports the story that is being told. Keeping this in mind our experts created Deploying Strategies For Business KPI Dashboard To Track Product Performance Strategy SS V to reduce the time that goes into designing the presentation. This way, you can concentrate on the message while our designers take care of providing you with the right template for the situation. This slide represents KPI dashboard for measuring product performance. It covers total activities, new customers, events, net promoter score.
Unlocking Potential IoTs Application Dashboard For Tracking IoT Devices Performance IoT SS V
This slide provides a dashboard for monitoring IoT devices that enhance agricultural practices. It incorporates IoT sensors to measure water tank capacity, Live crop monitoring, temperature and humidity measurements, control sprinklers, etc. Make sure to capture your audiences attention in your business displays with our gratis customizable Unlocking Potential IoTs Application Dashboard For Tracking IoT Devices Performance IoT SS V. These are great for business strategies, office conferences, capital raising or task suggestions. If you desire to acquire more customers for your tech business and ensure they stay satisfied, create your own sales presentation with these plain slides. This slide provides a dashboard for monitoring IoT devices that enhance agricultural practices. It incorporates IoT sensors to measure water tank capacity, Live crop monitoring, temperature and humidity measurements, control sprinklers, etc.

Product Analytics Dashboard To Track Engagement Product Analytics Implementation Data Analytics V
This slide illustrates a dashboard to monitor customer engagement on company website by leveraging product analytics tools aimed at making necessary improvements. It covers insights regarding active monthly users, new users, total completed purchases, screen views, average duration of session, etc Want to ace your presentation in front of a live audience Our Product Analytics Dashboard To Track Engagement Product Analytics Implementation Data Analytics V can help you do that by engaging all the users towards you. Slidegeeks experts have put their efforts and expertise into creating these impeccable powerpoint presentations so that you can communicate your ideas clearly. Moreover, all the templates are customizable, and easy-to-edit and downloadable. Use these for both personal and commercial use. This slide illustrates a dashboard to monitor customer engagement on company website by leveraging product analytics tools aimed at making necessary improvements. It covers insights regarding active monthly users, new users, total completed purchases, screen views, average duration of session, etc
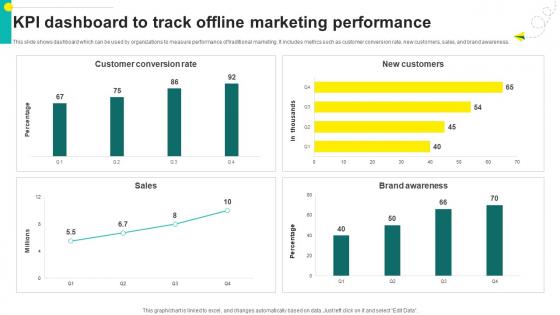
One On One Advertising Kpi Dashboard To Track Offline Marketing Performance Strategy SS V
This slide shows dashboard which can be used by organizations to measure performance of traditional marketing. It includes metrics such as customer conversion rate, new customers, sales, and brand awareness. Welcome to our selection of the One On One Advertising Kpi Dashboard To Track Offline Marketing Performance Strategy SS V. These are designed to help you showcase your creativity and bring your sphere to life. Planning and Innovation are essential for any business that is just starting out. This collection contains the designs that you need for your everyday presentations. All of our PowerPoints are 100Percent editable, so you can customize them to suit your needs. This multi-purpose template can be used in various situations. Grab these presentation templates today. This slide shows dashboard which can be used by organizations to measure performance of traditional marketing. It includes metrics such as customer conversion rate, new customers, sales, and brand awareness.
Marketing Tech Stack Impact Tracking Dashboard Comprehensive Guide For Marketing Technology
Following slide demonstrates performance monitoring dashboard. It includes key KPIs such as website visits, blog traffic, social share, click through rate, conversion rate, bounce rate, and impressions. Slidegeeks is here to make your presentations a breeze with Marketing Tech Stack Impact Tracking Dashboard Comprehensive Guide For Marketing Technology With our easy-to-use and customizable templates, you can focus on delivering your ideas rather than worrying about formatting. With a variety of designs to choose from, you are sure to find one that suits your needs. And with animations and unique photos, illustrations, and fonts, you can make your presentation pop. So whether you are giving a sales pitch or presenting to the board, make sure to check out Slidegeeks first Following slide demonstrates performance monitoring dashboard. It includes key KPIs such as website visits, blog traffic, social share, click through rate, conversion rate, bounce rate, and impressions.
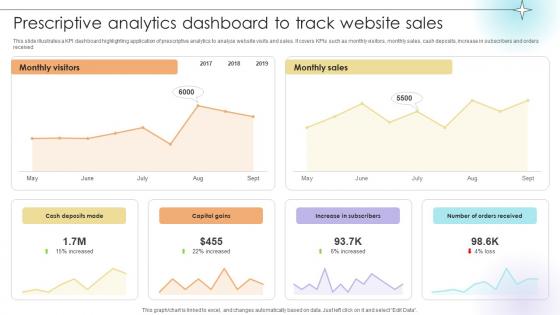
Prescriptive Analytics Dashboard To Track Website Sales Data Analytics SS V
This slide illustrates a KPI dashboard highlighting application of prescriptive analytics to analyze website visits and sales. It covers KPIs such as monthly visitors, monthly sales, cash deposits, increase in subscribers and orders received.This modern and well-arranged Prescriptive Analytics Dashboard To Track Website Sales Data Analytics SS V provides lots of creative possibilities. It is very simple to customize and edit with the Powerpoint Software. Just drag and drop your pictures into the shapes. All facets of this template can be edited with Powerpoint, no extra software is necessary. Add your own material, put your images in the places assigned for them, adjust the colors, and then you can show your slides to the world, with an animated slide included. This slide illustrates a KPI dashboard highlighting application of prescriptive analytics to analyze website visits and sales. It covers KPIs such as monthly visitors, monthly sales, cash deposits, increase in subscribers and orders received.
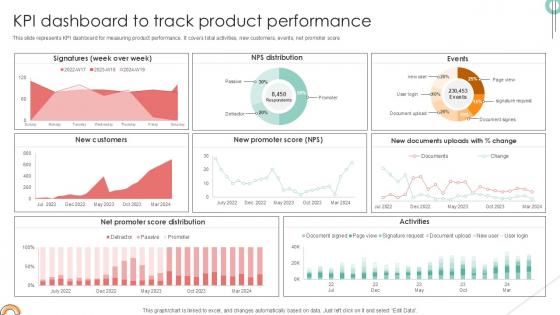
KPI Dashboard To Track Implementing Product Diversification PPT Presentation Strategy SS V
This slide represents KPI dashboard for measuring product performance. It covers total activities, new customers, events, net promoter score. This modern and well-arranged KPI Dashboard To Track Implementing Product Diversification PPT Presentation Strategy SS V provides lots of creative possibilities. It is very simple to customize and edit with the Powerpoint Software. Just drag and drop your pictures into the shapes. All facets of this template can be edited with Powerpoint, no extra software is necessary. Add your own material, put your images in the places assigned for them, adjust the colors, and then you can show your slides to the world, with an animated slide included. This slide represents KPI dashboard for measuring product performance. It covers total activities, new customers, events, net promoter score
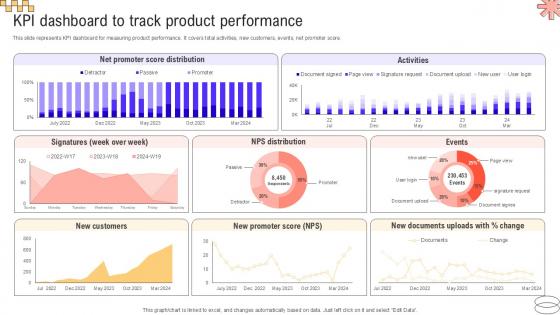
KPI Dashboard To Track Product Implementing Geographic Extension PPT Example Strategy SS V
This slide represents KPI dashboard for measuring product performance. It covers total activities, new customers, events, net promoter score. Coming up with a presentation necessitates that the majority of the effort goes into the content and the message you intend to convey. The visuals of a PowerPoint presentation can only be effective if it supplements and supports the story that is being told. Keeping this in mind our experts created KPI Dashboard To Track Product Implementing Geographic Extension PPT Example Strategy SS V to reduce the time that goes into designing the presentation. This way, you can concentrate on the message while our designers take care of providing you with the right template for the situation. This slide represents KPI dashboard for measuring product performance. It covers total activities, new customers, events, net promoter score.
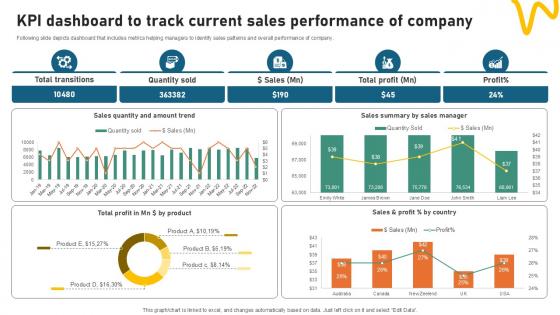
KPI Dashboard To Track Current Sales Sample Pitch Deck For Video Ppt Example
Following slide depicts dashboard that includes metrics helping managers to identify sales patterns and overall performance of company. Welcome to our selection of the KPI Dashboard To Track Current Sales Sample Pitch Deck For Video Ppt Example. These are designed to help you showcase your creativity and bring your sphere to life. Planning and Innovation are essential for any business that is just starting out. This collection contains the designs that you need for your everyday presentations. All of our PowerPoints are 100Percent editable, so you can customize them to suit your needs. This multi-purpose template can be used in various situations. Grab these presentation templates today. Following slide depicts dashboard that includes metrics helping managers to identify sales patterns and overall performance of company.
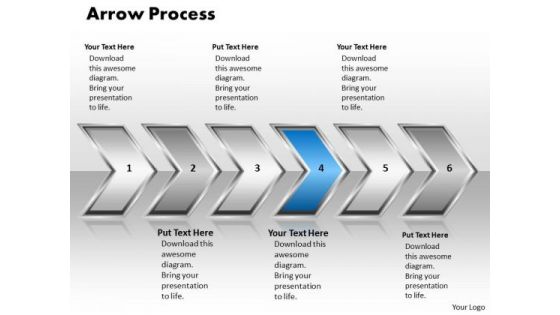
Ppt Pointing Continous Arrow Process 6 Stages PowerPoint Templates
PPT pointing continous arrow process 6 stages PowerPoint Templates-Most events and in every aspect of life are invariably interlinked. Use this graphic to outline your thoughts and their inherent interdependence to achieve the final outcome. You can show various processes with these linear designed arrow pieces. This image has been conceived to enable you to emphatically communicate your ideas in your Business PPT presentation.-PPT pointing continous arrow process 6 stages PowerPoint Templates-Aim, Arrow, Arrowheads, Badge, Border, Click, Connection, Curve, Design, Direction, Download, Element, Fuchsia, Icon, Illustration, Indicator, Internet, Magenta, Mark, Object, Orientation, Pointer, Shadow, Shape, Sign Set your eyes on our Ppt Pointing Continous Arrow Process 6 Stages PowerPoint Templates. You will find it difficult to look away.
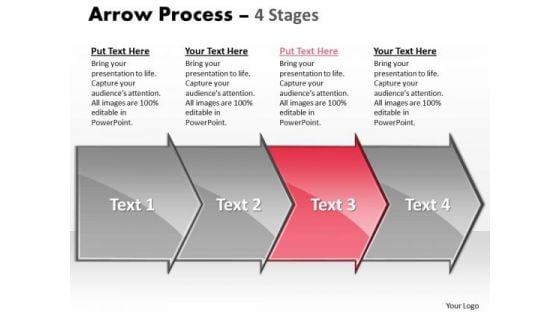
Editable Ppt Sequential Demonstration By 4 Arrows Business Communication PowerPoint Image
We present our editable PPT sequential Demonstration by 4 arrows business communication powerpoint Image.Use our Arrows PowerPoint Templates because; The alphabetical order is a time honored concept. Use our Signs PowerPoint Templates because, Business ethics is an essential element in your growth. Use our Process and flows PowerPoint Templates because; Use our templates to illustrate your ability. Use our Business PowerPoint Templates because, guaranteed to focus the minds of your team. Use our Shapes PowerPoint Templates because; Anoint it with your really bright ideas. Use these PowerPoint slides for presentations relating to Arrow process, business, circle, circular, collection, connection, cursor, decoration, design, dimensional, direction, element, icon, illustration, information, modern, motion, paper, perspective, plastic, pointer, pointing, recycle, recycling, reflective, set, shape, shiny, sign, symbol, technology. The prominent colors used in the PowerPoint template are Pink, Gray, Black Our Editable Ppt Sequential Demonstration By 4 Arrows Business Communication PowerPoint Image ensure your credentials are established. Your abilities will be acknowledged by all.
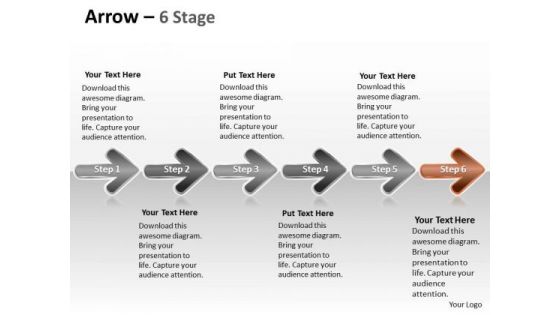
Usa PowerPoint Template Linear Abstraction By 6 Arrows 2010 Design
We present our USA PowerPoint template linear abstraction by 6 arrows 2010 design. Use our Arrows PowerPoint Templates because; represent the progress in our lives. Use our Sign PowerPoint Templates because; Take your team along by explaining your plans. Use our Shapes PowerPoint Templates because, You have it all down to a T. Use our Business PowerPoint Templates because, Now use this slide to bullet point your views. Use our Process and Flows PowerPoint Templates because, Knowledge is power goes the popular saying. Use these PowerPoint slides for presentations relating to arrow, badge, banner, button, colorful, connection, cursor, cyan, design element, designator, directional, download, emblem, icon, indicator, internet, link, load, magenta, marker, pictogram, pointer, right, stained, sign, signpost, symbol, upload, vector . The prominent colors used in the PowerPoint template are Brown, Gray, and Black Achieve best in class with our Usa PowerPoint Template Linear Abstraction By 6 Arrows 2010 Design. They will make you look good.
Business Ppt Template Linear Process Using 2 Bubble PowerPoint Graphics Arrows 1
We present our Business PPT template linear process using 2 bubble PowerPoint graphics arrows 1.Use our Arrows PowerPoint Templates because, creating a winner is your passion and dream. Use our Process and Flows PowerPoint Templates because, they highlight the depth of your thought process. Use our Business PowerPoint Templates because, be the cynosure of all eyes with our template depicting. Use our Marketing PowerPoint Templates because, are the symbols of human growth. Use our Shapes PowerPoint Templates because; Highlight the key components of your entire manufacturing/ business process. Use these PowerPoint slides for presentations relating to Arrow, Process, Business, Circle, Circular, Collection, Connection, Cursor, Decoration, Design, Dimensional, Direction, Element, Icon, Illustration, Information, Modern, Motion, Paper, Perspective, Plastic, Pointer, Pointing, Recycle, Recycling, Reflective, Set, Shape, Shiny, Sign, Symbol, Technology. The prominent colors used in the PowerPoint template are Red, Green, and Gray Create alliances with our Business Ppt Template Linear Process Using 2 Bubble PowerPoint Graphics Arrows 1. Generate familiarity within your team.
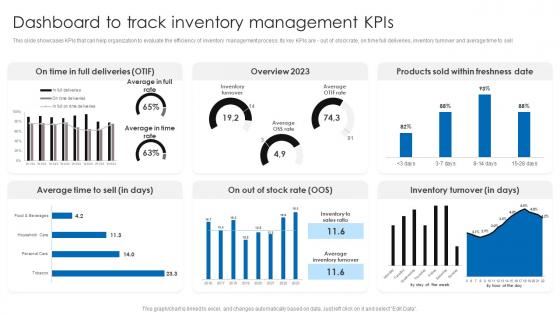
Dashboard To Track Inventory Management Kpis Retail Stock Administration Strategies Rules Pdf
This slide showcases KPIs that can help organization to evaluate the efficiency of inventory management process. Its key KPIs are - out of stock rate, on time full deliveries, inventory turnover and average time to sell.Coming up with a presentation necessitates that the majority of the effort goes into the content and the message you intend to convey. The visuals of a PowerPoint presentation can only be effective if it supplements and supports the story that is being told. Keeping this in mind our experts created Dashboard To Track Inventory Management Kpis Retail Stock Administration Strategies Rules Pdf to reduce the time that goes into designing the presentation. This way, you can concentrate on the message while our designers take care of providing you with the right template for the situation. This slide showcases KPIs that can help organization to evaluate the efficiency of inventory management process. Its key KPIs are out of stock rate, on time full deliveries, inventory turnover and average time to sell
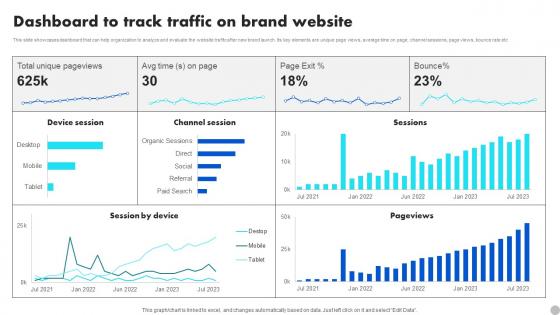
Dashboard To Track Traffic On Brand Website Brand Diversification Approach Rules Pdf
This slide showcases dashboard that can help organization to analyze and evaluate the website traffic after new brand launch. Its key elements are unique page views, average time on page, channel sessions, page views, bounce rate etc. Are you in need of a template that can accommodate all of your creative concepts This one is crafted professionally and can be altered to fit any style. Use it with Google Slides or PowerPoint. Include striking photographs, symbols, depictions, and other visuals. Fill, move around, or remove text boxes as desired. Test out color palettes and font mixtures. Edit and save your work, or work with colleagues. Download Dashboard To Track Traffic On Brand Website Brand Diversification Approach Rules Pdf and observe how to make your presentation outstanding. Give an impeccable presentation to your group and make your presentation unforgettable. This slide showcases dashboard that can help organization to analyze and evaluate the website traffic after new brand launch. Its key elements are unique page views, average time on page, channel sessions, page views, bounce rate etc.
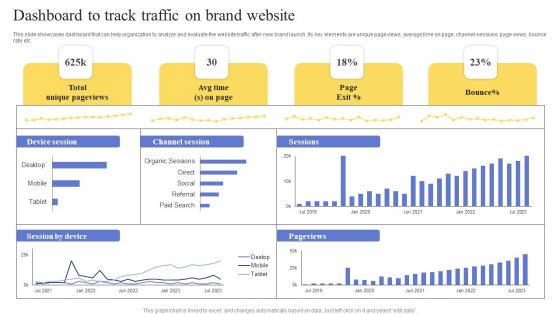
Dashboard To Track Traffic On Brand Website Maximizing Revenue Using Professional Pdf
This slide showcases dashboard that can help organization to analyze and evaluate the website traffic after new brand launch. Its key elements are unique page views, average time on page, channel sessions, page views, bounce rate etc. Are you in need of a template that can accommodate all of your creative concepts This one is crafted professionally and can be altered to fit any style. Use it with Google Slides or PowerPoint. Include striking photographs, symbols, depictions, and other visuals. Fill, move around, or remove text boxes as desired. Test out color palettes and font mixtures. Edit and save your work, or work with colleagues. Download Dashboard To Track Traffic On Brand Website Maximizing Revenue Using Professional Pdf and observe how to make your presentation outstanding. Give an impeccable presentation to your group and make your presentation unforgettable. This slide showcases dashboard that can help organization to analyze and evaluate the website traffic after new brand launch. Its key elements are unique page views, average time on page, channel sessions, page views, bounce rate etc.
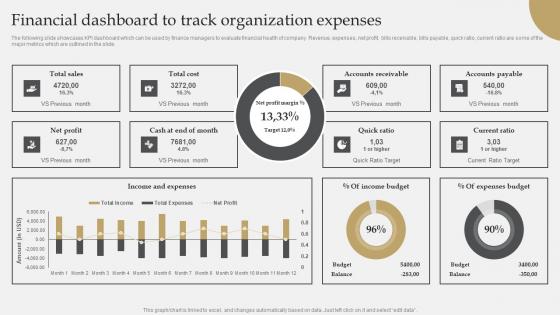
IT Industry Market Research Financial Dashboard To Track Organization Expenses Introduction Pdf
The following slide showcases KPI dashboard which can be used by finance managers to evaluate financial health of company. Revenue, expenses, net profit, bills receivable, bills payable, quick ratio, current ratio are some of the major metrics which are outlined in the slide. Present like a pro with IT Industry Market Research Financial Dashboard To Track Organization Expenses Introduction Pdf Create beautiful presentations together with your team, using our easy-to-use presentation slides. Share your ideas in real-time and make changes on the fly by downloading our templates. So whether you are in the office, on the go, or in a remote location, you can stay in sync with your team and present your ideas with confidence. With Slidegeeks presentation got a whole lot easier. Grab these presentations today. The following slide showcases KPI dashboard which can be used by finance managers to evaluate financial health of company. Revenue, expenses, net profit, bills receivable, bills payable, quick ratio, current ratio are some of the major metrics which are outlined in the slide.
Performance Enhancement Plan Monthly Sales Performance Tracking And Monitoring Portrait Pdf
This slide showcases a dashboard presenting various metrics to measure and analyze sales performance for revenue growth. It includes key components such as number of sales, revenue, profit, cost, sales revenue, sales increment, cost analysis and cross sell. Coming up with a presentation necessitates that the majority of the effort goes into the content and the message you intend to convey. The visuals of a PowerPoint presentation can only be effective if it supplements and supports the story that is being told. Keeping this in mind our experts created Performance Enhancement Plan Monthly Sales Performance Tracking And Monitoring Portrait Pdf to reduce the time that goes into designing the presentation. This way, you can concentrate on the message while our designers take care of providing you with the right template for the situation. This slide showcases a dashboard presenting various metrics to measure and analyze sales performance for revenue growth. It includes key components such as number of sales, revenue, profit, cost, sales revenue, sales increment, cost analysis and cross sell.
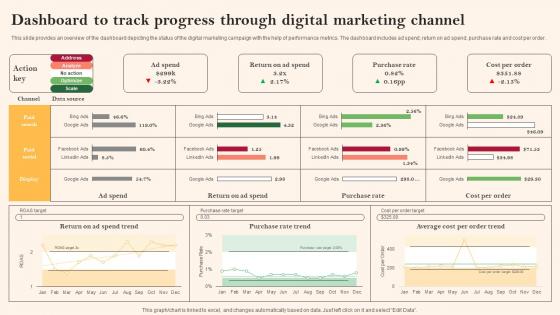
Social Media Marketing To Boost Dashboard To Track Progress Through Digital Sample Pdf
This slide provides an overview of the dashboard depicting the status of the digital marketing campaign with the help of performance metrics. The dashboard includes ad spend, return on ad spend, purchase rate and cost per order. Are you in need of a template that can accommodate all of your creative concepts This one is crafted professionally and can be altered to fit any style. Use it with Google Slides or PowerPoint. Include striking photographs, symbols, depictions, and other visuals. Fill, move around, or remove text boxes as desired. Test out color palettes and font mixtures. Edit and save your work, or work with colleagues. Download Social Media Marketing To Boost Dashboard To Track Progress Through Digital Sample Pdf and observe how to make your presentation outstanding. Give an impeccable presentation to your group and make your presentation unforgettable. This slide provides an overview of the dashboard depicting the status of the digital marketing campaign with the help of performance metrics. The dashboard includes ad spend, return on ad spend, purchase rate and cost per order.
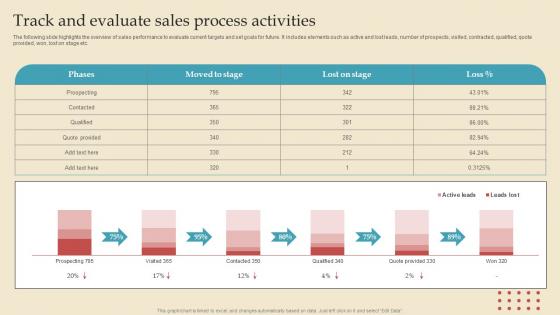
Track And Evaluate Sales Describing Business Performance Administration Goals Information Pdf
The following slide highlights the overview of sales performance to evaluate current targets and set goals for future. It includes elements such as active and lost leads, number of prospects, visited, contracted, qualified, quote provided, won, lost on stage etc. Coming up with a presentation necessitates that the majority of the effort goes into the content and the message you intend to convey. The visuals of a PowerPoint presentation can only be effective if it supplements and supports the story that is being told. Keeping this in mind our experts created Track And Evaluate Sales Describing Business Performance Administration Goals Information Pdf to reduce the time that goes into designing the presentation. This way, you can concentrate on the message while our designers take care of providing you with the right template for the situation. The following slide highlights the overview of sales performance to evaluate current targets and set goals for future. It includes elements such as active and lost leads, number of prospects, visited, contracted, qualified, quote provided, won, lost on stage etc.
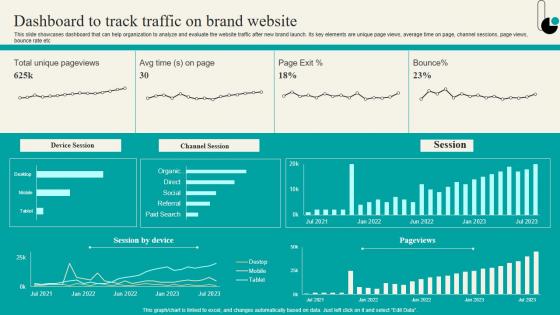
Dashboard To Track Traffic On Brand Website Strategic Marketing Plan Structure PDF
This slide showcases dashboard that can help organization to analyze and evaluate the website traffic after new brand launch. Its key elements are unique page views, average time on page, channel sessions, page views, bounce rate etc. Are you in need of a template that can accommodate all of your creative concepts This one is crafted professionally and can be altered to fit any style. Use it with Google Slides or PowerPoint. Include striking photographs, symbols, depictions, and other visuals. Fill, move around, or remove text boxes as desired. Test out color palettes and font mixtures. Edit and save your work, or work with colleagues. Download Dashboard To Track Traffic On Brand Website Strategic Marketing Plan Structure PDF and observe how to make your presentation outstanding. Give an impeccable presentation to your group and make your presentation unforgettable. This slide showcases dashboard that can help organization to analyze and evaluate the website traffic after new brand launch. Its key elements are unique page views, average time on page, channel sessions, page views, bounce rate etc.
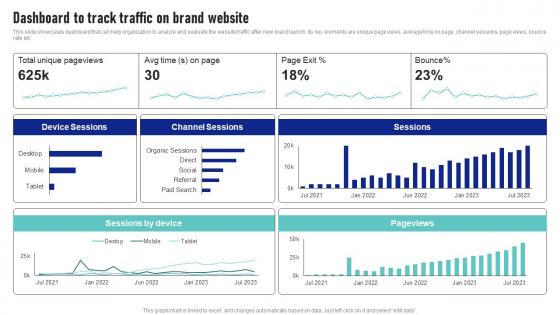
Dashboard To Track Traffic On Brand Website Launching New Product Brand Sample Pdf
This slide showcases dashboard that can help organization to analyze and evaluate the website traffic after new brand launch. Its key elements are unique page views, average time on page, channel sessions, page views, bounce rate etc Are you in need of a template that can accommodate all of your creative concepts This one is crafted professionally and can be altered to fit any style. Use it with Google Slides or PowerPoint. Include striking photographs, symbols, depictions, and other visuals. Fill, move around, or remove text boxes as desired. Test out color palettes and font mixtures. Edit and save your work, or work with colleagues. Download Dashboard To Track Traffic On Brand Website Launching New Product Brand Sample Pdf and observe how to make your presentation outstanding. Give an impeccable presentation to your group and make your presentation unforgettable. This slide showcases dashboard that can help organization to analyze and evaluate the website traffic after new brand launch. Its key elements are unique page views, average time on page, channel sessions, page views, bounce rate etc

 Home
Home