Sales Graph
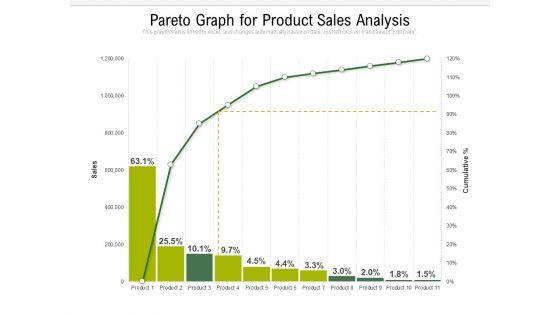
Pareto Graph For Product Sales Analysis Ppt PowerPoint Presentation File Clipart PDF
Presenting this set of slides with name pareto graph for product sales analysis ppt powerpoint presentation file clipart pdf. The topics discussed in these slide is pareto graph for product sales analysis. This is a completely editable PowerPoint presentation and is available for immediate download. Download now and impress your audience.

Bar Graph Depicting Business Sales Revenue With Cagr Value Ppt PowerPoint Presentation File Outline PDF
Showcasing this set of slides titled bar graph depicting business sales revenue with cagr value ppt powerpoint presentation file outline pdf. The topics addressed in these templates are bar graph depicting business sales revenue with cagr value. All the content presented in this PPT design is completely editable. Download it and make adjustments in color, background, font etc. as per your unique business setting.

Increase Graph And Dollar Sales PowerPoint Templates And PowerPoint Themes 0612
Increase Graph And Dollar Sales PowerPoint Templates And PowerPoint Themes PPT Slides-Microsoft Powerpoint Templates and Background with graph dollar Award yourself with our Increase Graph And Dollar Sales PowerPoint Templates And PowerPoint Themes 0612. You deserve to deal with the best.
Bar Graph Showing Future Sales Vector Icon Ppt PowerPoint Presentation File Master Slide PDF
Presenting bar graph showing future sales vector icon ppt powerpoint presentation file master slide pdf to dispense important information. This template comprises three stages. It also presents valuable insights into the topics including bar graph showing future sales vector icon. This is a completely customizable PowerPoint theme that can be put to use immediately. So, download it and address the topic impactfully.
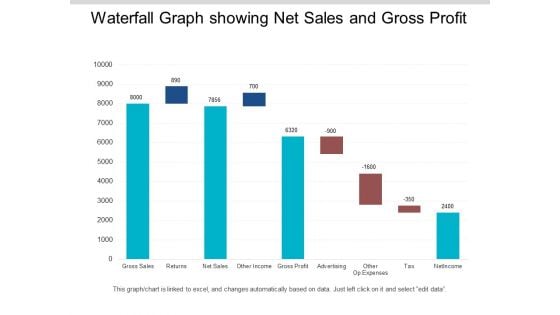
Waterfall Graph Showing Net Sales And Gross Profit Ppt PowerPoint Presentation Infographics Format
This is a waterfall graph showing net sales and gross profit ppt powerpoint presentation infographics format. This is a three stage process. The stages in this process are profit and loss, balance sheet, income statement, benefit and loss.
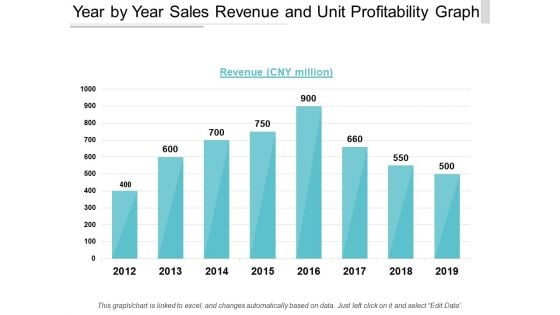
Year By Year Sales Revenue And Unit Profitability Graph Ppt PowerPoint Presentation Show Professional
This is a year by year sales revenue and unit profitability graph ppt powerpoint presentation show professional. This is a eight stage process. The stages in this process are business unit profitability, profitable organization, corporate unit profitability.

Graph Indicating Business Sales Growth Trend Ppt PowerPoint Presentation File Slide Portrait PDF
Persuade your audience using this graph indicating business sales growth trend ppt powerpoint presentation file slide portrait pdf. This PPT design covers three stages, thus making it a great tool to use. It also caters to a variety of topics including graph indicating business sales growth trend. Download this PPT design now to present a convincing pitch that not only emphasizes the topic but also showcases your presentation skills.
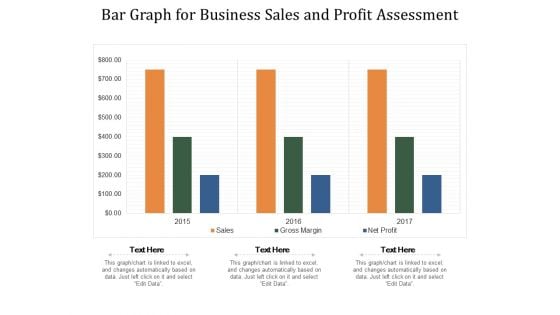
Bar Graph For Business Sales And Profit Assessment Ppt PowerPoint Presentation File Tips PDF
Presenting this set of slides with name bar graph for business sales and profit assessment ppt powerpoint presentation file tips pdf. The topics discussed in these slides are sales, gross margin, net profit. This is a completely editable PowerPoint presentation and is available for immediate download. Download now and impress your audience.
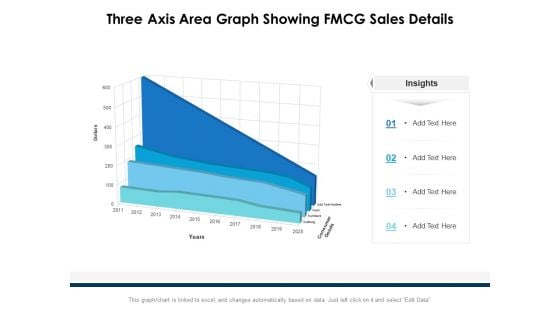
Three Axis Area Graph Showing FMCG Sales Details Ppt PowerPoint Presentation Ideas Layouts PDF
Presenting this set of slides with name three axis area graph showing fmcg sales details ppt powerpoint presentation ideas layouts pdf. The topics discussed in these slides are consumer goods, dollars, 2011 to 2020. This is a completely editable PowerPoint presentation and is available for immediate download. Download now and impress your audience.
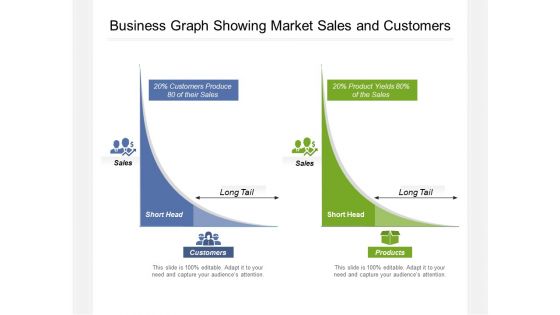
Business Graph Showing Market Sales And Customers Ppt PowerPoint Presentation Ideas Inspiration PDF
Presenting this set of slides with name business graph showing market sales and customers ppt powerpoint presentation ideas inspiration pdf. This is a two stage process. The stages in this process are Short Head, Customers, Sales, Long Tail, Short Head, Products. This is a completely editable PowerPoint presentation and is available for immediate download. Download now and impress your audience.
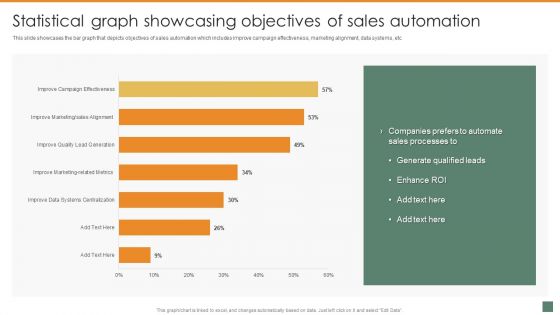
Statistical Graph Showcasing Objectives Of Sales Automation Summary And Significance Of Sales Automation Inspiration PDF
This slide showcases the bar graph that depicts objectives of sales automation which includes improve campaign effectiveness, marketing alignment, data systems, etc. The Statistical Graph Showcasing Objectives Of Sales Automation Summary And Significance Of Sales Automation Inspiration PDF is a compilation of the most recent design trends as a series of slides. It is suitable for any subject or industry presentation, containing attractive visuals and photo spots for businesses to clearly express their messages. This template contains a variety of slides for the user to input data, such as structures to contrast two elements, bullet points, and slides for written information. Slidegeeks is prepared to create an impression.
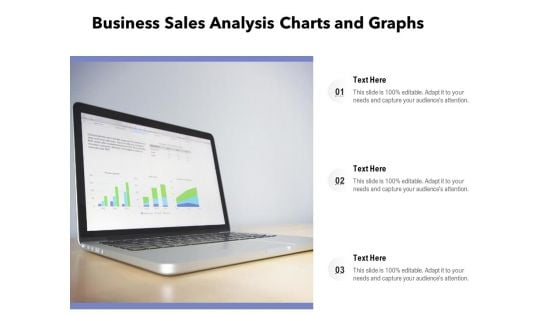
Business Sales Analysis Charts And Graphs Ppt PowerPoint Presentation File Deck PDF
Presenting business sales analysis charts and graphs ppt powerpoint presentation file deck pdf to dispense important information. This template comprises three stages. It also presents valuable insights into the topics including business sales analysis charts and graphs. This is a completely customizable PowerPoint theme that can be put to use immediately. So, download it and address the topic impactfully.
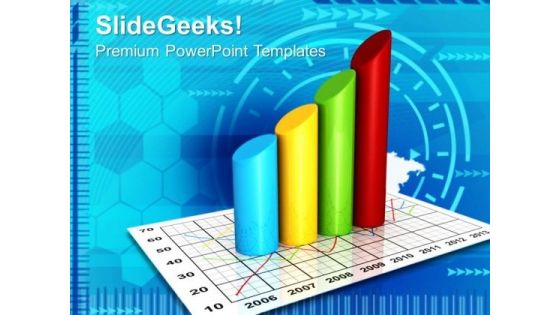
Graph Of Products Sale Business PowerPoint Templates And PowerPoint Themes 0912
Graph Of Products Sale Business PowerPoint Templates And PowerPoint Themes Presentations-Microsoft Powerpoint Templates and Background with graph of products sale-Graph Of Products Sale Business PowerPoint Templates And PowerPoint Themes PresentationsThis PPT can be used for presentations relating to-Graph of products sale, business, cylinders, success, finance, shapes Be bold and dramatic with our Graph Of Products Sale Business PowerPoint Templates And PowerPoint Themes 0912. State the facts with elan.
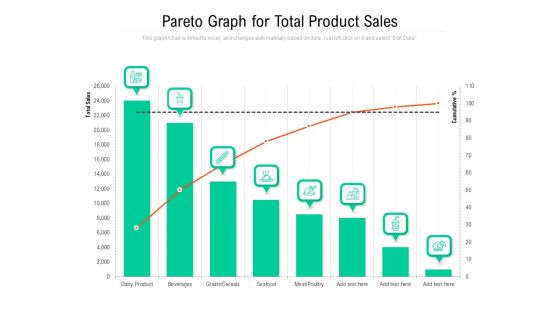
Pareto Graph For Total Product Sales Ppt PowerPoint Presentation Gallery Guidelines PDF
Presenting this set of slides with name pareto graph for total product sales ppt powerpoint presentation gallery guidelines pdf. The topics discussed in these slide is pareto graph for total product sales. This is a completely editable PowerPoint presentation and is available for immediate download. Download now and impress your audience.
Chart Icon Illustrates Diminishing Graph And Chart Company Sales Professional PDF
Presenting Chart Icon Illustrates Diminishing Graph And Chart Company Sales Professional PDF to dispense important information. This template comprises four stages. It also presents valuable insights into the topics including Chart Icon Illustrates Diminishing, Graph Chart Company Sales. This is a completely customizable PowerPoint theme that can be put to use immediately. So, download it and address the topic impactfully.
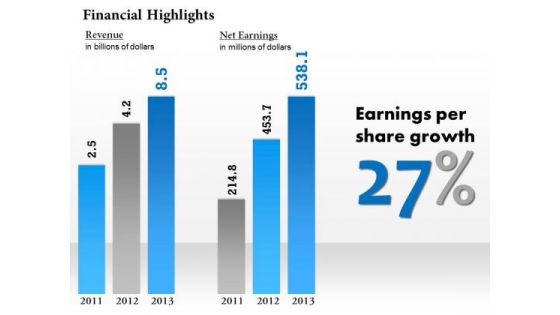
Sales Diagram Financial Result Display Bar Graph Diagram Business Framework Model
Our Sales Diagram Financial Result Display Bar Graph Diagram Business Framework Model Powerpoint Templates Deliver At Your Doorstep. Let Them In For A Wonderful Experience. Dig Out The Dope With Our Sales Diagram Financial Result Display Bar Graph Diagram Business Framework Model Powerpoint Templates. Your Thoughts Will Expose The Truth.
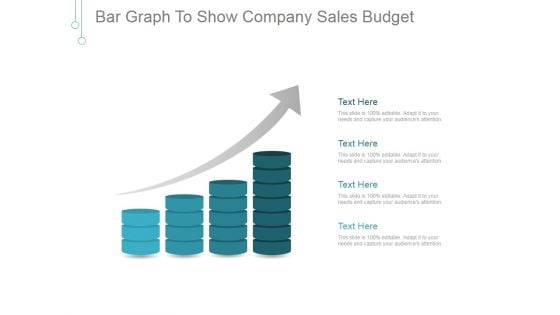
Bar Graph To Show Company Sales Budget Ppt PowerPoint Presentation Sample
This is a bar graph to show company sales budget ppt powerpoint presentation sample. This is a four stage process. The stages in this process are business, finance, growth, success, marketing, arrow.
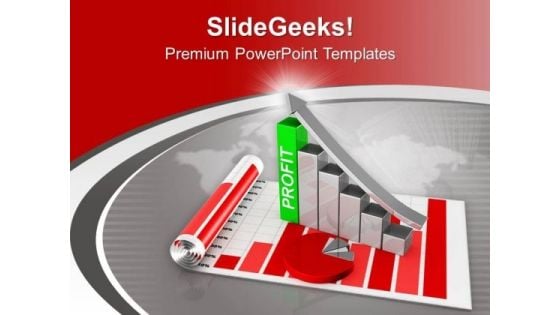
Bar Graph With Profit Marketing Sales PowerPoint Templates Ppt Backgrounds For Slides 0513
Doll up your thoughts with our Bar Graph With Profit Marketing Sales PowerPoint Templates PPT Backgrounds For Slides. They will make a pretty picture. They say a dog is man's best friend. Our marketing PowerPoint Templates come a close second. Establish the dominance of your ideas. Our finance PowerPoint Templates will put them on top. Our Bar Graph With Profit Marketing Sales PowerPoint Templates Ppt Backgrounds For Slides 0513 will become an extension of you. They will get in character with your thoughts.
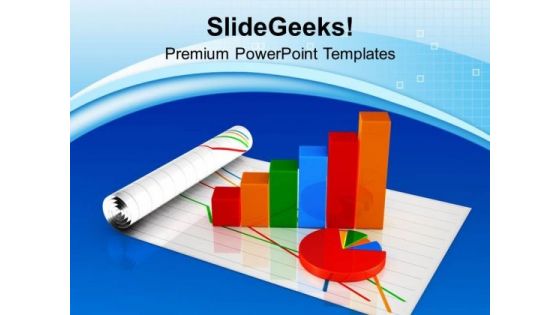
Bar Graph With Pie Chart Sales PowerPoint Templates Ppt Backgrounds For Slides 0613
Open up doors that lead to success. Our Bar Graph With Pie Chart Sales PowerPoint Templates PPT Backgrounds For Slides provide the handles. Oppurtunity will come knocking at your door. Welcome it with our business PowerPoint Templates. Our marketing PowerPoint Templates abhor doodling. They never let the interest flag. Our Bar Graph With Pie Chart Sales PowerPoint Templates Ppt Backgrounds For Slides 0613 pick up on many a fable. They contain the wisdom of business lore.
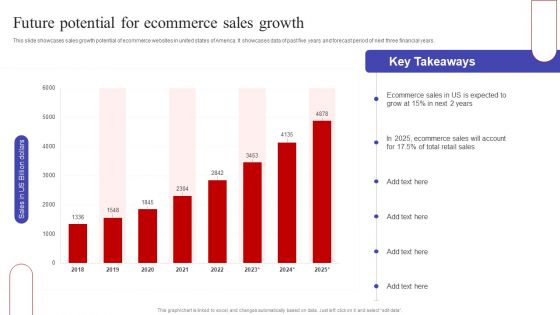
Future Potential For Ecommerce Sales Growth Ppt PowerPoint Presentation Diagram Graph Charts PDF
This slide showcases sales growth potential of ecommerce websites in united states of America. It showcases data of past five years and forecast period of next three financial years. Here you can discover an assortment of the finest PowerPoint and Google Slides templates. With these templates, you can create presentations for a variety of purposes while simultaneously providing your audience with an eye catching visual experience. Download Future Potential For Ecommerce Sales Growth Ppt PowerPoint Presentation Diagram Graph Charts PDF to deliver an impeccable presentation. These templates will make your job of preparing presentations much quicker, yet still, maintain a high level of quality. Slidegeeks has experienced researchers who prepare these templates and write high quality content for you. Later on, you can personalize the content by editing the Future Potential For Ecommerce Sales Growth Ppt PowerPoint Presentation Diagram Graph Charts PDF.
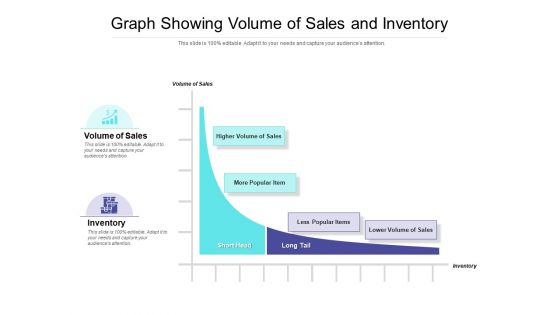
Graph Showing Volume Of Sales And Inventory Ppt PowerPoint Presentation Outline Professional PDF
Presenting this set of slides with name graph showing volume of sales and inventory ppt powerpoint presentation outline professional pdf. This is a two stage process. The stages in this process are volume of sales, inventory, higher volume of sales, higher volume of sales, less popular items, lower volume of sales. This is a completely editable PowerPoint presentation and is available for immediate download. Download now and impress your audience.
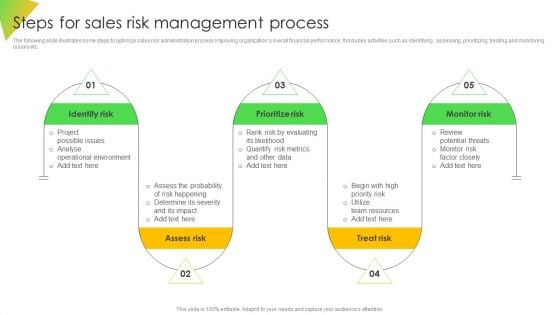
Steps For Sales Risk Management Process Ppt Diagram Graph Charts PDF
The following slide illustrates some steps to optimize sales risk administration process improving organizations overall financial performance. It includes activities such as identifying , assessing, prioritizing, treating and monitoring issues etc. The Steps For Sales Risk Management Process Ppt Diagram Graph Charts PDF is a compilation of the most recent design trends as a series of slides. It is suitable for any subject or industry presentation, containing attractive visuals and photo spots for businesses to clearly express their messages. This template contains a variety of slides for the user to input data, such as structures to contrast two elements, bullet points, and slides for written information. Slidegeeks is prepared to create an impression.
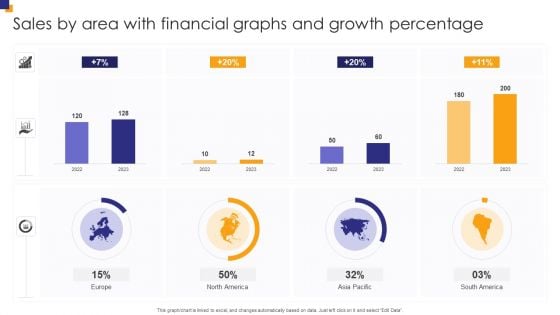
Sales By Area With Financial Graphs And Growth Percentage Inspiration PDF
Pitch your topic with ease and precision using this Sales By Area With Financial Graphs And Growth Percentage Inspiration PDF. This layout presents information on Sales Area, Financial Graphs, Growth Percentage. It is also available for immediate download and adjustment. So, changes can be made in the color, design, graphics or any other component to create a unique layout.
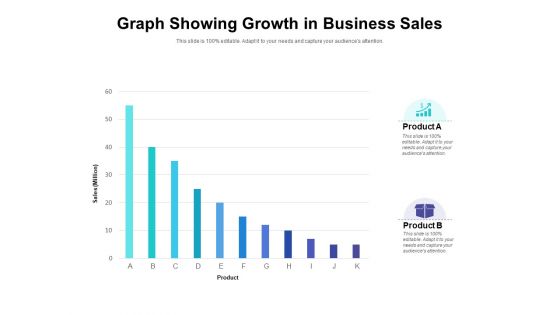
Graph Showing Growth In Business Sales Ppt PowerPoint Presentation Portfolio Designs PDF
Presenting this set of slides with name graph showing growth in business sales ppt powerpoint presentation portfolio designs pdf. The topics discussed in these slide is graph showing growth in business sales. This is a completely editable PowerPoint presentation and is available for immediate download. Download now and impress your audience.
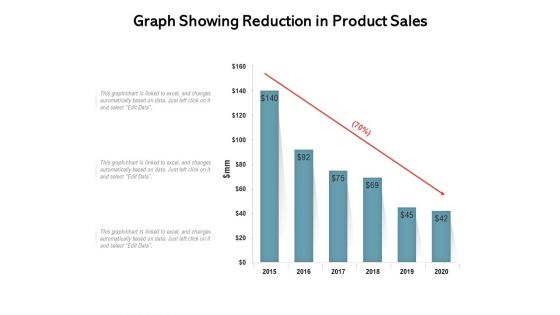
Graph Showing Reduction In Product Sales Ppt PowerPoint Presentation Infographic Template Graphics Design PDF
Pitch your topic with ease and precision using this graph showing reduction in product sales ppt powerpoint presentation infographic template graphics design pdf. This layout presents information on graph showing reduction in product sales, 2015 to 2020. It is also available for immediate download and adjustment. So, changes can be made in the color, design, graphics or any other component to create a unique layout.

Bar Graph Showing Revenues Generated By Sales Department Ppt Portfolio Graphics Example PDF
This graph or chart is linked to excel, and changes automatically based on data. Just left click on it and select edit data. Showcasing this set of slides titled bar graph showing revenues generated by sales department ppt portfolio graphics example pdf. The topics addressed in these templates are yearly sales revenues, sales team, profits. All the content presented in this PPT design is completely editable. Download it and make adjustments in color, background, font etc. as per your unique business setting.
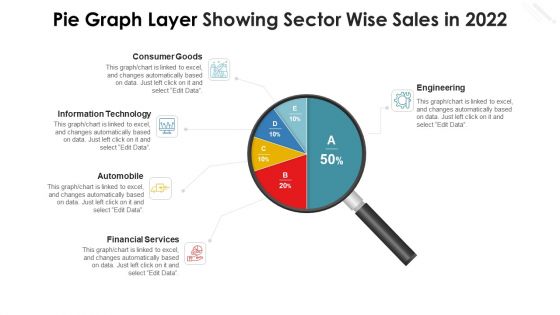
Pie Graph Layer Showing Sector Wise Sales In 2022 Microsoft PDF
Pitch your topic with ease and precision using this pie graph layer showing sector wise sales in 2022 microsoft pdf. This layout presents information on consumer goods, information technology, automobile, financial services, engineering. It is also available for immediate download and adjustment. So, changes can be made in the color, design, graphics or any other component to create a unique layout.
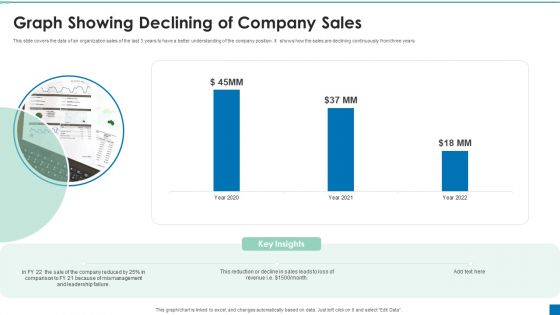
Graph Showing Declining Of Company Sales Ppt PowerPoint Presentation Portfolio Graphics Example PDF
This slide covers the data of an organization sales of the last 3 years to have a better understanding of the company position. It shows how the sales are declining continuously from three years.Pitch your topic with ease and precision using this Graph Showing Declining Of Company Sales Ppt PowerPoint Presentation Portfolio Graphics Example PDF. This layout presents information on Reduction Decline, Comparison, Mismanagement. It is also available for immediate download and adjustment. So, changes can be made in the color, design, graphics or any other component to create a unique layout.
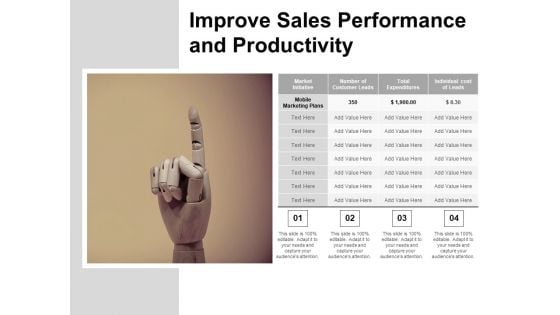
Improve Sales Performance And Productivity Ppt PowerPoint Presentation Diagram Graph Charts
This is a improve sales performance and productivity ppt powerpoint presentation diagram graph charts. This is a four stage process. The stages in this process are marketing effort, branding initiative, marketing initiatives.
Sales Performance Report With Charts And Graphs Ppt PowerPoint Presentation Icon Master Slide PDF
Presenting sales performance report with charts and graphs ppt powerpoint presentation icon master slide pdf to dispense important information. This template comprises three stages. It also presents valuable insights into the topics including sales performance report with charts and graphs. This is a completely customizable PowerPoint theme that can be put to use immediately. So, download it and address the topic impactfully.
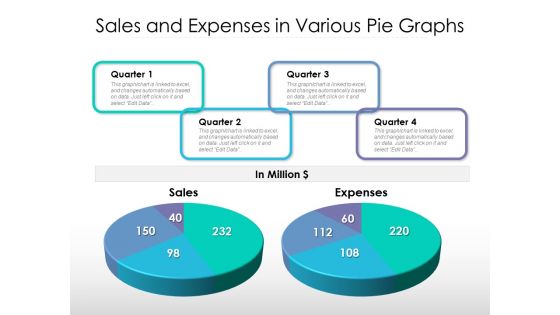
Sales And Expenses In Various Pie Graphs Ppt PowerPoint Presentation Ideas Backgrounds PDF
Pitch your topic with ease and precision using this sales and expenses in various pie graphs ppt powerpoint presentation ideas backgrounds pdf. This layout presents information on sales, expenses, quarter. It is also available for immediate download and adjustment. So, changes can be made in the color, design, graphics or any other component to create a unique layout.
Key Drivers Of Sales And Marketing Growth With Bar Graph Vector Icon Ppt PowerPoint Presentation File Inspiration PDF
Presenting key drivers of sales and marketing growth with bar graph vector icon ppt powerpoint presentation file inspiration pdf to dispense important information. This template comprises one stages. It also presents valuable insights into the topics including key drivers of sales and marketing growth with bar graph vector icon. This is a completely customizable PowerPoint theme that can be put to use immediately. So, download it and address the topic impactfully.
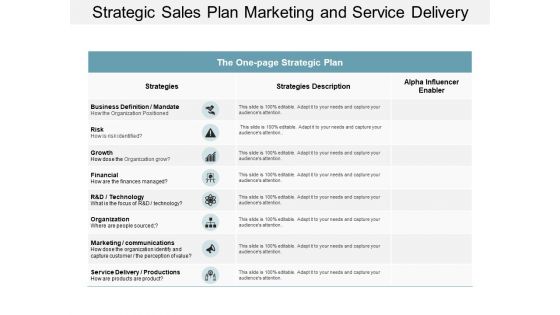
Strategic Sales Plan Marketing And Service Delivery Ppt Powerpoint Presentation Diagram Graph Charts
This is a strategic sales plan marketing and service delivery ppt powerpoint presentation diagram graph charts. This is a three stage process. The stages in this process are one page strategy, one page plan, one page approach.
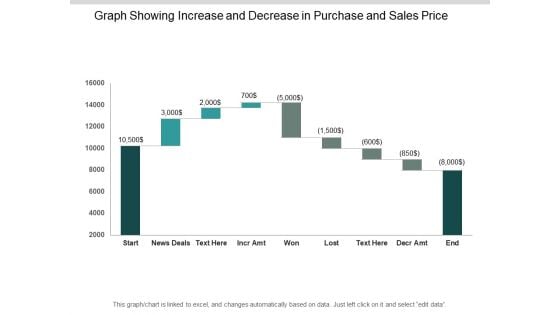
Graph Showing Increase And Decrease In Purchase And Sales Price Ppt PowerPoint Presentation Outline Gallery
This is a graph showing increase and decrease in purchase and sales price ppt powerpoint presentation outline gallery. This is a nine stage process. The stages in this process are sales waterfall, waterfall chart, business.

Graph Business PowerPoint Template 0810
An illustration of 3d colorful graph design element Entertain the audience in your adorable way. Our Graph Business PowerPoint Template 0810 will make them your fans.
Bar Graph PowerPoint Icon C
3D style of a vector bar graph . Be explicit with our Bar Graph PowerPoint Icon C. Express your views clearly and fully.
Bar Graph PowerPoint Icon Cc
3D style of a vector bar graph . Buyers like to associate with brands. Create one of your own with our Bar Graph PowerPoint Icon Cc.
Bar Graph PowerPoint Icon S
3D style of a vector bar graph . Display visionary leadership with our Bar Graph PowerPoint Icon S. They will make you look good.
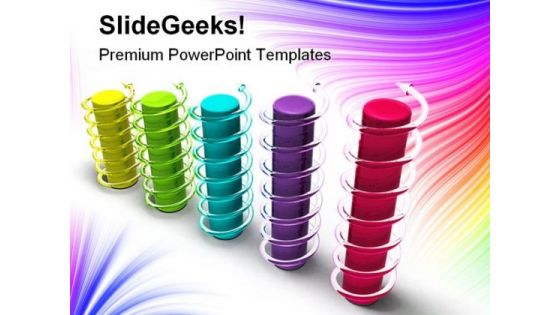
Graph Business PowerPoint Template 0910
Business 3d graph multi colored with spiral arrows around bars. Get the break you have been waiting for. Earn it with the help of our Graph Business PowerPoint Template 0910.

Graph Success PowerPoint Template 0810
business success concept computer generated illustration for special design Arouse their curiosity with our Graph Success PowerPoint Template 0810. Your thoughts will provide the answers.
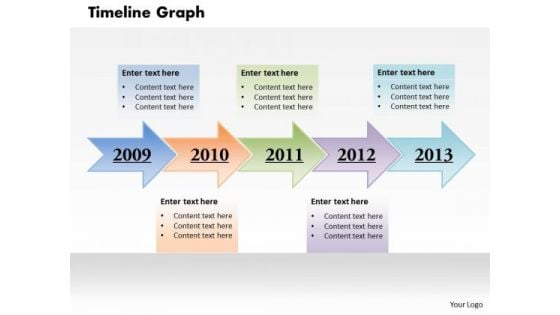
Timeline Graph PowerPoint Presentation Template
Our Timeline Graph PowerPoint Presentation Template Powerpoint Templates Enjoy Drama. They Provide Entertaining Backdrops. Our Business Plan Powerpoint Templates Help To Make A Draft. They Give You A Good Place To Start.
Bar Graph Slashed PowerPoint Icon C
budget cuts layoffs and dropped sales business model Attract customers with our Bar Graph Slashed PowerPoint Icon C. Just download, type and present.
Bar Graph Slashed PowerPoint Icon Cc
budget cuts layoffs and dropped sales business model Establish benchmarks with our Bar Graph Slashed PowerPoint Icon Cc. Your thoughts will be an example to live upto.

Market Graph Business PowerPoint Template 0810
Closeup of pen showing on sales report Let your thoughts evolve. Our Market Graph Business PowerPoint Template 0810 will nurture their growth.
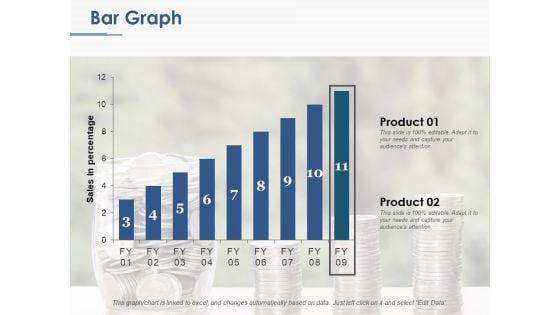
Bar Graph Ppt PowerPoint Presentation Ideas Display
This is a bar graph ppt powerpoint presentation ideas display. This is a two stage process. The stages in this process are product, sales in percentage, bar graph.
Bar Graph Slashed PowerPoint Icon S
budget cuts layoffs and dropped sales business model Impress the rank and file with our Bar Graph Slashed PowerPoint Icon S. Everyone will be awed by their ability.
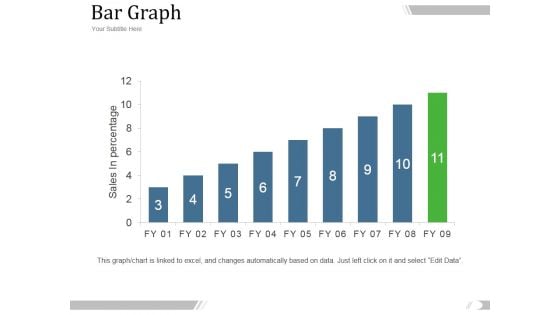
Bar Graph Ppt PowerPoint Presentation Introduction
This is a bar graph ppt powerpoint presentation introduction. This is a eleven stage process. The stages in this process are management, marketing, business, fy, graph, sales in percentage.
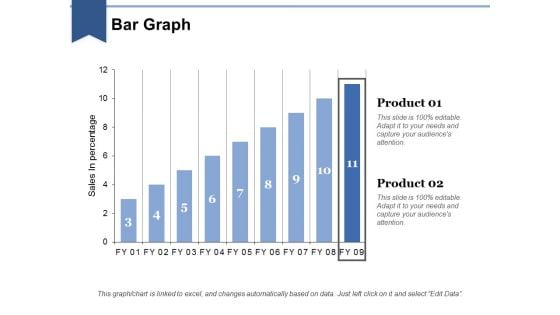
Bar Graph Ppt PowerPoint Presentation Layouts Influencers
This is a bar graph ppt powerpoint presentation layouts influencers. This is a two stage process. The stages in this process are business, marketing, in bar graph, sales in percentage, finance.
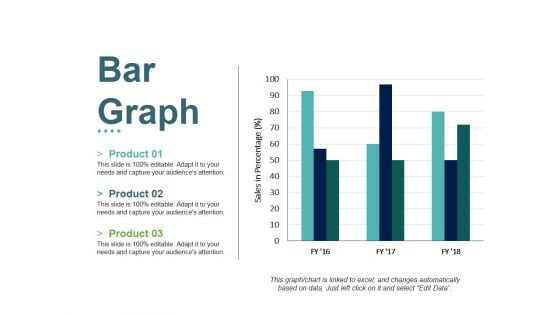
Bar Graph Ppt PowerPoint Presentation File Slides
This is a bar graph ppt powerpoint presentation file slides. This is a three stage process. The stages in this process are product, sales in percentage, bar graph, growth, success.
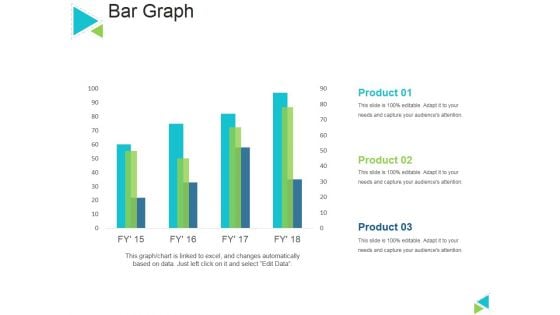
Bar Graph Ppt PowerPoint Presentation Outline Layout
This is a bar graph ppt powerpoint presentation outline layout. This is a four stage process. The stages in this process are sales in percentage, product, bar graph, business, marketing.
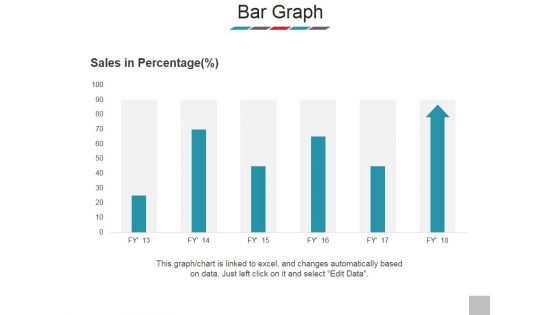
Bar Graph Ppt PowerPoint Presentation Model Clipart
This is a bar graph ppt powerpoint presentation model clipart. This is a six stage process. The stages in this process are sales in percentage, product, bar graph, business, marketing.
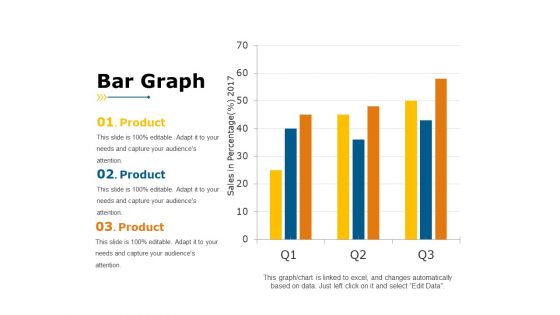
Bar Graph Ppt PowerPoint Presentation Portfolio Example
This is a bar graph ppt powerpoint presentation portfolio example. This is a three stage process. The stages in this process are sales in percentage, year, business, product, business, graph.
Dices On Financial Graph PowerPoint Icon F
Microsoft PowerPoint Template and Background with dices on financial graph Stitch together the fabric of your thoughts. Thread through with our Dices On Financial Graph PowerPoint Icon F.
Dices On Financial Graph PowerPoint Icon C
Microsoft PowerPoint Template and Background with dices on financial graph Prescribe changes with our Dices On Financial Graph PowerPoint Icon C. Download without worries with our money back guaranteee.
Dices On Financial Graph PowerPoint Icon Cc
Microsoft PowerPoint Template and Background with dices on financial graph Give your presentations a great look with our Dices On Financial Graph PowerPoint Icon Cc. You will be at the top of your game.
Dices On Financial Graph PowerPoint Icon R
Microsoft PowerPoint Template and Background with dices on financial graph Demonstrate your work ethic with our Dices On Financial Graph PowerPoint Icon R. Give credence to your impeccable reputation.
Dices On Financial Graph PowerPoint Icon S
Microsoft PowerPoint Template and Background with dices on financial graph Our Dices On Financial Graph PowerPoint Icon S project your erudite nature. They bring your depth of knowledge to the surface.

Bar Graph Business PowerPoint Template 0810
3d illustration of growing graph and arrow Close deals with our Bar Graph Business PowerPoint Template 0810. Download without worries with our money back guaranteee.
Business Data Graph PowerPoint Icon Cc
Increasing Bar Chart - Business Data Graph With World Map Lead your army with our Business Data Graph PowerPoint Icon Cc. You will come out on top.
Business Data Graph PowerPoint Icon S
Increasing Bar Chart - Business Data Graph With World Map Our Business Data Graph PowerPoint Icon S do not compromise. Excellence is always the aim.


 Continue with Email

 Home
Home


