Sales Graph

Pharmaceutical Company Sales Analysis On Power BI Ppt Presentation SS
This Pharmaceutical Company Sales Analysis On Power BI Ppt Presentation SS from Slidegeeks makes it easy to present information on your topic with precision. It provides customization options, so you can make changes to the colors, design, graphics, or any other component to create a unique layout. It is also available for immediate download, so you can begin using it right away. Slidegeeks has done good research to ensure that you have everything you need to make your presentation stand out. Make a name out there for a brilliant performance. Our Pharmaceutical Company Sales Analysis On Power BI Ppt Presentation SS are topically designed to provide an attractive backdrop to any subject. Use them to look like a presentation pro.

Strategies For Stabilizing Corporate Analysing Business Monthly Sales Revenue Report
This slide showcases the sales revenue report in order to monitor, analyze and track monthly sales trends. Key reasons for the decline include new competitors in the market, unable to adopt new technology, and production haltered. Create an editable Strategies For Stabilizing Corporate Analysing Business Monthly Sales Revenue Report that communicates your idea and engages your audience. Whether you are presenting a business or an educational presentation, pre-designed presentation templates help save time. Strategies For Stabilizing Corporate Analysing Business Monthly Sales Revenue Report is highly customizable and very easy to edit, covering many different styles from creative to business presentations. Slidegeeks has creative team members who have crafted amazing templates. So, go and get them without any delay. This slide showcases the sales revenue report in order to monitor, analyze and track monthly sales trends. Key reasons for the decline include new competitors in the market, unable to adopt new technology, and production haltered.
Social Media Performance Tracking Sales Performance Enhancement Infographics Pdf
The following slide showcases a dashboard to track and measure social media platforms performance. It includes key elements such as website traffic, social media referral rate, site revenue, social media site revenue, etc. Here you can discover an assortment of the finest PowerPoint and Google Slides templates. With these templates, you can create presentations for a variety of purposes while simultaneously providing your audience with an eye catching visual experience. Download Social Media Performance Tracking Sales Performance Enhancement Infographics Pdf to deliver an impeccable presentation. These templates will make your job of preparing presentations much quicker, yet still, maintain a high level of quality. Slidegeeks has experienced researchers who prepare these templates and write high quality content for you. Later on, you can personalize the content by editing the Social Media Performance Tracking Sales Performance Enhancement Infographics Pdf. The following slide showcases a dashboard to track and measure social media platforms performance. It includes key elements such as website traffic, social media referral rate, site revenue, social media site revenue, etc.
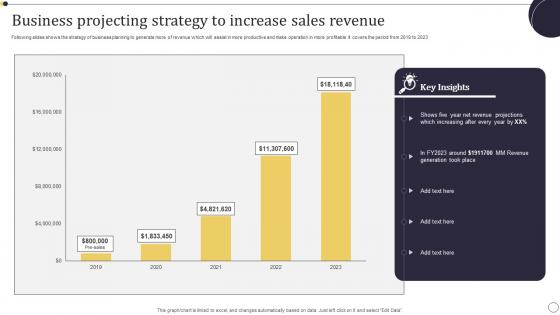
Business Projecting Strategy To Increase Sales Revenue Background Pdf
Following slides shows the strategy of business planning to generate more of revenue which will assist in more productive and make operation in more profitable .It covers the period from 2019 to 2023 Pitch your topic with ease and precision using this Business Projecting Strategy To Increase Sales Revenue Background Pdf. This layout presents information on Key Insights, Revenue Projections, Business Projecting Strategy. It is also available for immediate download and adjustment. So, changes can be made in the color, design, graphics or any other component to create a unique layout. Following slides shows the strategy of business planning to generate more of revenue which will assist in more productive and make operation in more profitable .It covers the period from 2019 to 2023
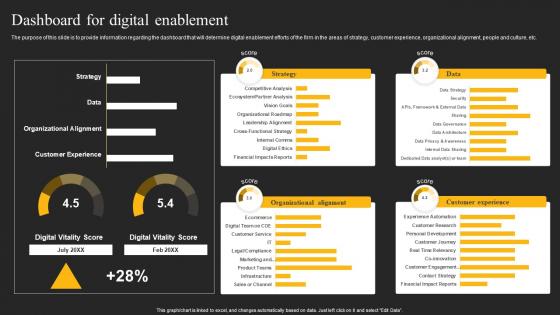
Dashboard For Digital Enablement E Sales Generation Checklist Guidelines PDF
The purpose of this slide is to provide information regarding the dashboard that will determine digital enablement efforts of the firm in the areas of strategy, customer experience, organizational alignment, people and culture, etc. From laying roadmaps to briefing everything in detail, our templates are perfect for you. You can set the stage with your presentation slides. All you have to do is download these easy-to-edit and customizable templates. Dashboard For Digital Enablement E Sales Generation Checklist Guidelines PDF will help you deliver an outstanding performance that everyone would remember and praise you for. Do download this presentation today. The purpose of this slide is to provide information regarding the dashboard that will determine digital enablement efforts of the firm in the areas of strategy, customer experience, organizational alignment, people and culture, etc.
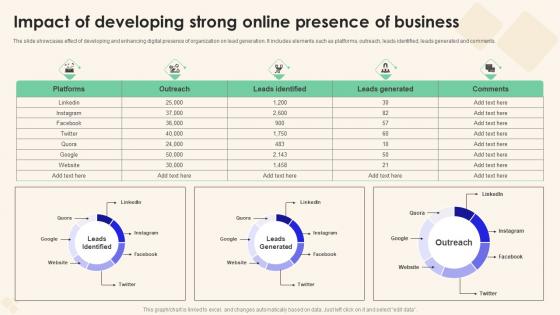
Impact Of Developing Strong Online Sales Performance Enhancement Diagrams Pdf
The slide showcases effect of developing and enhancing digital presence of organization on lead generation. It includes elements such as platforms, outreach, leads identified, leads generated and comments. Are you in need of a template that can accommodate all of your creative concepts This one is crafted professionally and can be altered to fit any style. Use it with Google Slides or PowerPoint. Include striking photographs, symbols, depictions, and other visuals. Fill, move around, or remove text boxes as desired. Test out color palettes and font mixtures. Edit and save your work, or work with colleagues. Download Impact Of Developing Strong Online Sales Performance Enhancement Diagrams Pdf and observe how to make your presentation outstanding. Give an impeccable presentation to your group and make your presentation unforgettable. The slide showcases effect of developing and enhancing digital presence of organization on lead generation. It includes elements such as platforms, outreach, leads identified, leads generated and comments.
Website Performance Tracking Sales Performance Enhancement Ideas Pdf
The following slide showcases a dashboard to track and measure website performance. It includes key elements such as visits, average session duration, bounce rate, page views, goal conversion, visits by week, traffic sources, top channels by conversions, etc. Boost your pitch with our creative Website Performance Tracking Sales Performance Enhancement Ideas Pdf. Deliver an awe inspiring pitch that will mesmerize everyone. Using these presentation templates you will surely catch everyones attention. You can browse the ppts collection on our website. We have researchers who are experts at creating the right content for the templates. So you do not have to invest time in any additional work. Just grab the template now and use them. The following slide showcases a dashboard to track and measure website performance. It includes key elements such as visits, average session duration, bounce rate, page views, goal conversion, visits by week, traffic sources, top channels by conversions, etc.

Property Dealer Sales Dashboard By Power BI Ppt Presentation SS
The following slide showcases figures highlighting sustainability plans taken by corporates. It provides information about competitors, energy reduction, waste management, operations, employee retention, etc. Do you know about Slidesgeeks Property Dealer Sales Dashboard By Power BI Ppt Presentation SS These are perfect for delivering any kind od presentation. Using it, create PowerPoint presentations that communicate your ideas and engage audiences. Save time and effort by using our pre-designed presentation templates that are perfect for a wide range of topic. Our vast selection of designs covers a range of styles, from creative to business, and are all highly customizable and easy to edit. Download as a PowerPoint template or use them as Google Slides themes. The following slide showcases figures highlighting sustainability plans taken by corporates. It provides information about competitors, energy reduction, waste management, operations, employee retention, etc.
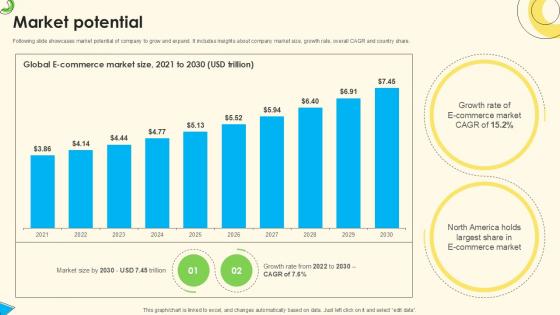
Market Potential Sales Pitch Deck For Online Retail Ppt Sample
Following slide showcases market potential of company to grow and expand. It includes insights about company market size, growth rate, overall CAGR and country share. The best PPT templates are a great way to save time, energy, and resources. Slidegeeks have 100 percent editable powerpoint slides making them incredibly versatile. With these quality presentation templates, you can create a captivating and memorable presentation by combining visually appealing slides and effectively communicating your message. Download Market Potential Sales Pitch Deck For Online Retail Ppt Sample from Slidegeeks and deliver a wonderful presentation. Following slide showcases market potential of company to grow and expand. It includes insights about company market size, growth rate, overall CAGR and country share.
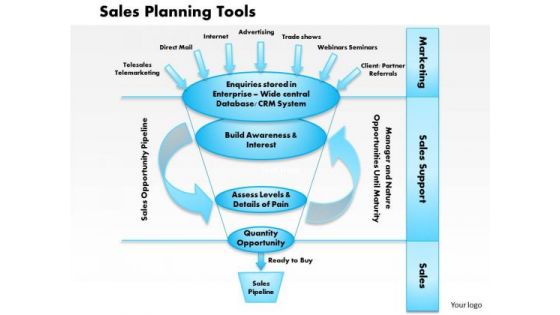
Business Diagram Sales Planning Tools PowerPoint Ppt Presentation
Delight Them With Our Business Diagram Sales Planning Tools PowerPoint PPT Presentation Powerpoint Templates.
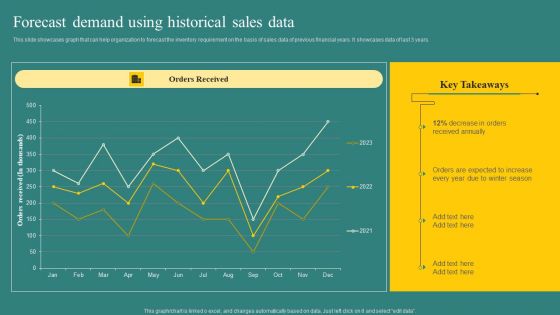
Forecast Demand Using Historical Sales Data Background PDF
This slide showcases graph that can help organization to forecast the inventory requirement on the basis of sales data of previous financial years. It showcases data of last 3 years. Take your projects to the next level with our ultimate collection of Forecast Demand Using Historical Sales Data Background PDF. Slidegeeks has designed a range of layouts that are perfect for representing task or activity duration, keeping track of all your deadlines at a glance. Tailor these designs to your exact needs and give them a truly corporate look with your own brand colors they will make your projects stand out from the rest.

B2B Marketing Techniques Dashboard To Evaluate Top Performing Sales Representative
This slide showcases dashboard which helps track sales representatives performance by assessing cold calling KPIs. it provides information regarding KPIs such as conversion rates, no. of items sold. No. of deals converted, value generated etc. This B2B Marketing Techniques Dashboard To Evaluate Top Performing Sales Representative is perfect for any presentation, be it in front of clients or colleagues. It is a versatile and stylish solution for organizing your meetings. The B2B Marketing Techniques Dashboard To Evaluate Top Performing Sales Representative features a modern design for your presentation meetings. The adjustable and customizable slides provide unlimited possibilities for acing up your presentation. Slidegeeks has done all the homework before launching the product for you. So, do not wait, grab the presentation templates today This slide showcases dashboard which helps track sales representatives performance by assessing cold calling KPIs. it provides information regarding KPIs such as conversion rates, no. of items sold. No. of deals converted, value generated etc.
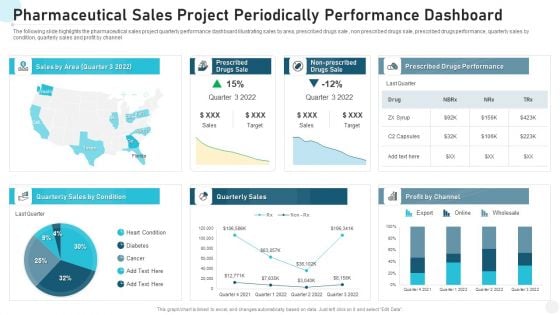
Pharmaceutical Sales Project Periodically Performance Dashboard Brochure PDF
The following slide highlights the pharmaceutical sales project quarterly performance dashboard illustrating sales by area, prescribed drugs sale , non prescribed drugs sale, prescribed drugs performance, quarterly sales by condition, quarterly sales and profit by channel Showcasing this set of slides titled pharmaceutical sales project periodically performance dashboard brochure pdf. The topics addressed in these templates are pharmaceutical sales project periodically performance dashboard. All the content presented in this PPT design is completely editable. Download it and make adjustments in color, background, font etc. as per your unique business setting.
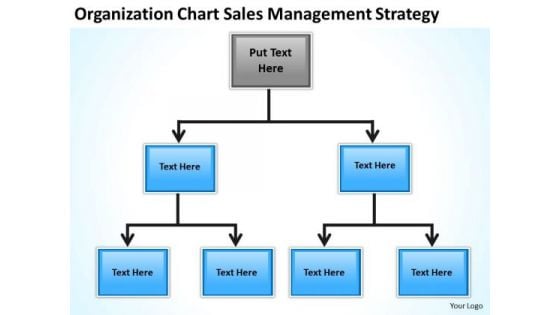
Organization Chart Sales Management Strategy Ppt Business Plan PowerPoint Slides
We present our origanization chart sales management strategy ppt business plan PowerPoint Slides.Download and present our Business PowerPoint Templates because Our PowerPoint Templates and Slides will provide you a launch platform. Give a lift off to your ideas and send them into orbit. Download our Marketing PowerPoint Templates because It can Conjure up grand ideas with our magical PowerPoint Templates and Slides. Leave everyone awestruck by the end of your presentation. Present our Process and Flows PowerPoint Templates because You have a driving passion to excel in your field. Our PowerPoint Templates and Slides will prove ideal vehicles for your ideas. Download our Flow Charts PowerPoint Templates because You will get more than you ever bargained for. Present our Shapes PowerPoint Templates because You have the co-ordinates for your destination of success. Let our PowerPoint Templates and Slides map out your journey.Use these PowerPoint slides for presentations relating to Business, process, leadership, order, blank, plan, concept, presentation, teamwork, internet, template, diagram, scheme, report, marketing, technology, modern, cycle, three, stage, connection, chart, system, strategy, direction, company, progress, part, background, structure, arrows. The prominent colors used in the PowerPoint template are Gray, Blue, Black. Your thoughts will soon be in flower. Our Origanization Chart Sales Management Strategy Ppt Business Plan PowerPoint Slides will nurse them from bud to bloom.
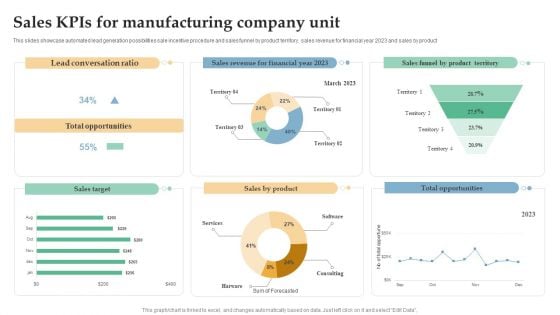
Sales Kpis For Manufacturing Company Unit Ppt Pictures Images PDF
This slides showcase automated lead generation possibilities sale incentive procedure and sales funnel by product territory, sales revenue for financial year 2023 and sales by product. Showcasing this set of slides titled Sales Kpis For Manufacturing Company Unit Ppt Pictures Images PDF. The topics addressed in these templates are Lead Conversation Ratio, Total Opportunities, Total Opportunities. All the content presented in this PPT design is completely editable. Download it and make adjustments in color, background, font etc. as per your unique business setting.

Managing Customer Experience CRM Data Analysis Sales Pictures PDF
This graph or chart is linked to excel, and changes automatically based on data. Just left click on it and select Edit Data.Deliver and pitch your topic in the best possible manner with this managing customer experience crm data analysis sales pictures pdf. Use them to share invaluable insights on entities by rep, completed activities l, biz notes this month, phone calls last 3 months, activity last 3 months and impress your audience. This template can be altered and modified as per your expectations. So, grab it now.
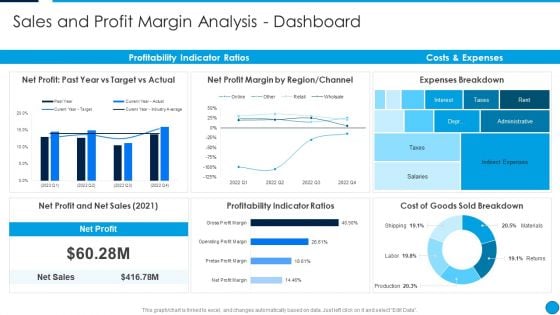
Summary Financial Sales And Profit Margin Analysis Dashboard Pictures PDF
This graph or chart is linked to excel, and changes automatically based on data. Just left click on it and select Edit Data. Deliver an awe inspiring pitch with this creative Summary Financial Sales And Profit Margin Analysis Dashboard Pictures PDF bundle. Topics like Net Profit, Past Year Vs Target Vs Actual, Net Profit Margin By Region, Channel, Expenses Breakdown, Costs And Expenses, Profitability Indicator Ratios can be discussed with this completely editable template. It is available for immediate download depending on the needs and requirements of the user.

Improving Corporate Performance Sales Opportunity Monitoring Dashboard Portrait PDF
This graph or chart is linked to excel, and changes automatically based on data. Just left click on it and select Edit Data. Welcome to our selection of the Improving Corporate Performance Sales Opportunity Monitoring Dashboard Portrait PDF. These are designed to help you showcase your creativity and bring your sphere to life. Planning and Innovation are essential for any business that is just starting out. This collection contains the designs that you need for your everyday presentations. All of our PowerPoints are 100 percent editable, so you can customize them to suit your needs. This multi-purpose template can be used in various situations. Grab these presentation templates today.
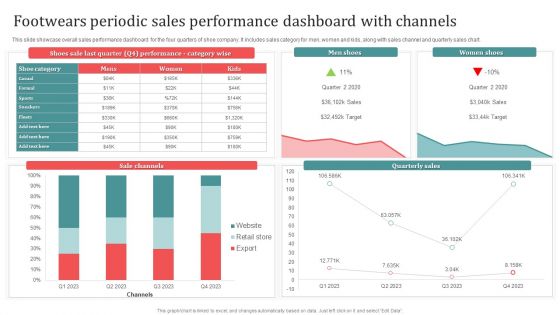
Footwears Periodic Sales Performance Dashboard With Channels Download PDF
This slide showcase overall sales performance dashboard for the four quarters of shoe company. It includes sales category for men, women and kids, along with sales channel and quarterly sales chart. Showcasing this set of slides titled Footwears Periodic Sales Performance Dashboard With Channels Download PDF. The topics addressed in these templates are Men Shoes, Women Shoes, Sale Channels. All the content presented in this PPT design is completely editable. Download it and make adjustments in color, background, font etc. as per your unique business setting.
Market Penetration Dashboard With Sales Metrics Ppt Icon Examples PDF
This slide shows market penetration dashboard for sales team. It provides information about regions, emerging markets, planned sales, actual sales, revenue, gender wise sales, etc. Pitch your topic with ease and precision using this Market Penetration Dashboard With Sales Metrics Ppt Icon Examples PDF. This layout presents information on Emerging Markets, Sales Gender, Actual Sales. It is also available for immediate download and adjustment. So, changes can be made in the color, design, graphics or any other component to create a unique layout.
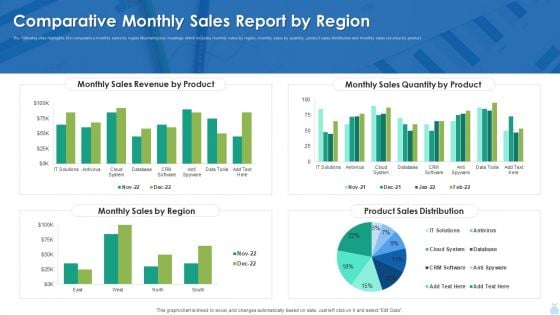
Comparative Monthly Sales Report By Region Graphics PDF
The following slide highlights the comparative monthly sales by region illustrating key headings which includes monthly sales by region, monthly sales by quantity, product sales distribution and monthly sales revenue by product. Showcasing this set of slides titled Comparative Monthly Sales Report By Region Graphics PDF. The topics addressed in these templates are Sales Revenue, Monthly Sales Quantity, Product Sales Distribution. All the content presented in this PPT design is completely editable. Download it and make adjustments in color, background, font etc. as per your unique business setting.
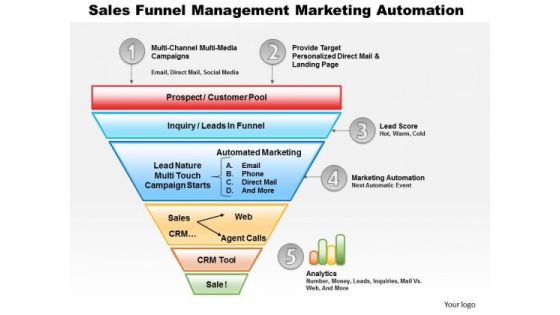
Business Diagram Sales Funnel Management Marketing Automation PowerPoint Ppt Presentation
Brace Yourself, Arm Your Thoughts. Prepare For The Hustle With Our Business Diagram sales funnel management Marketing Automation PowerPoint PPT Presentation Powerpoint Templates.
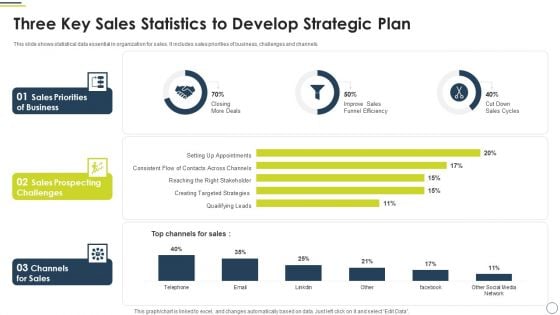
Three Key Sales Statistics To Develop Strategic Plan Microsoft PDF
This slide shows statistical data essential in organization for sales. It includes sales priorities of business, challenges and channels. Pitch your topic with ease and precision using this Three Key Sales Statistics To Develop Strategic Plan Microsoft PDF. This layout presents information on Sales Priorities Business, Sales Prospecting Challenges, Channels For Sales. It is also available for immediate download and adjustment. So, changes can be made in the color, design, graphics or any other component to create a unique layout.
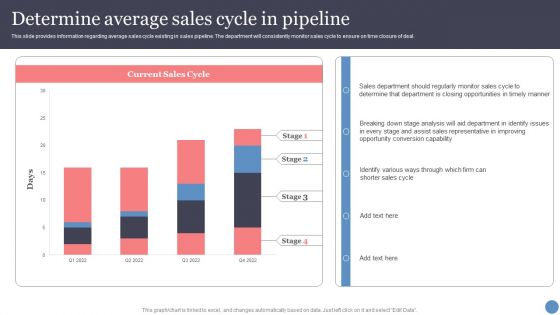
Determine Average Sales Cycle In Pipeline Information PDF
This slide provides information regarding average sales cycle existing in sales pipeline. The department will consistently monitor sales cycle to ensure on time closure of deal. Deliver and pitch your topic in the best possible manner with this Determine Average Sales Cycle In Pipeline Information PDF. Use them to share invaluable insights on Opportunity Conversion Capability, Sales Department, Sales Cycle and impress your audience. This template can be altered and modified as per your expectations. So, grab it now.
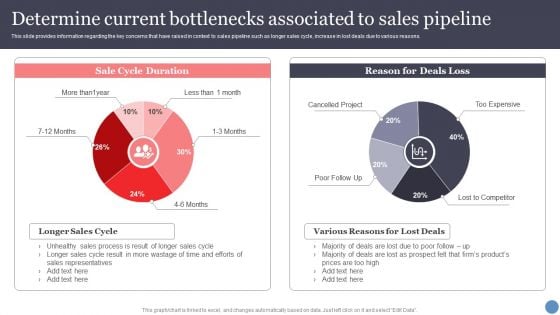
Determine Current Bottlenecks Associated To Sales Pipeline Microsoft PDF
This slide provides information regarding the key concerns that have raised in context to sales pipeline such as longer sales cycle, increase in lost deals due to various reasons. Deliver an awe inspiring pitch with this creative Determine Current Bottlenecks Associated To Sales Pipeline Microsoft PDF bundle. Topics like Sales Representatives, Sales Cycle, Sales Process can be discussed with this completely editable template. It is available for immediate download depending on the needs and requirements of the user.
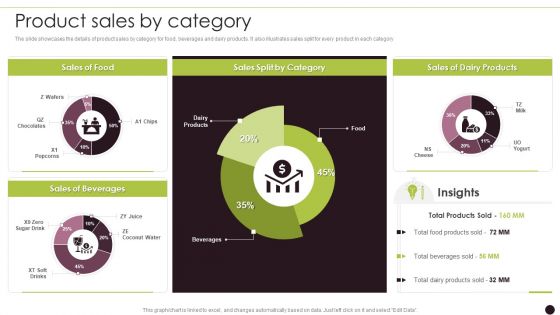
Canned Food Company Profile Product Sales By Category Infographics PDF
The slide showcases the details of product sales by category for food, beverages and dairy products. It also illustrates sales split for every product in each category Deliver and pitch your topic in the best possible manner with this Canned Food Company Profile Product Sales By Category Infographics PDF Use them to share invaluable insights on Sales Of Food, Sales Beverages, Sales Split and impress your audience. This template can be altered and modified as per your expectations. So, grab it now.
Determine Pipeline By Individual Sales Representative Performance Icons PDF
This slide provides information regarding monitoring of different sales representatives performance by determine sales duration at various pipeline stages. Deliver an awe inspiring pitch with this creative Determine Pipeline By Individual Sales Representative Performance Icons PDF bundle. Topics like Sales Representative, Sales Department, Shorter Sales Cycle can be discussed with this completely editable template. It is available for immediate download depending on the needs and requirements of the user.
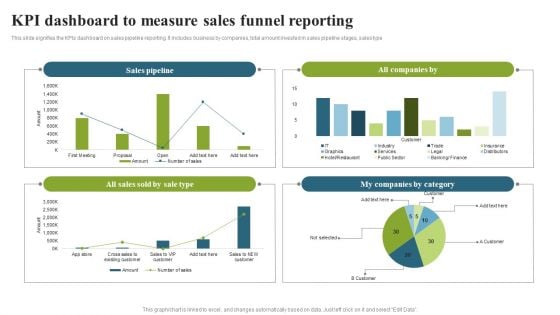
KPI Dashboard To Measure Sales Funnel Reporting Template PDF
This slide signifies the KPIs dashboard on sales pipeline reporting. It includes business by companies, total amount invested in sales pipeline stages, sales type. Showcasing this set of slides titled KPI Dashboard To Measure Sales Funnel Reporting Template PDF. The topics addressed in these templates are Sales Pipeline, Companies Category, Sales Sold. All the content presented in this PPT design is completely editable. Download it and make adjustments in color, background, font etc. as per your unique business setting.
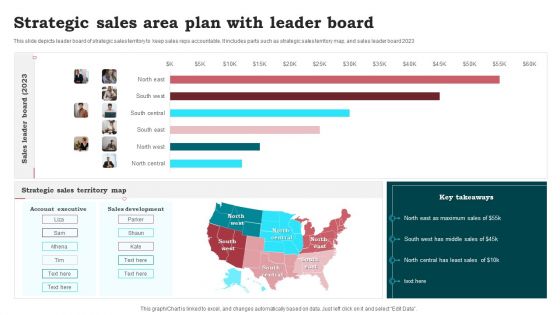
Strategic Sales Area Plan With Leader Board Inspiration PDF
This slide depicts leader board of strategic sales territory to keep sales reps accountable. It includes parts such as strategic sales territory map, and sales leader board 2023. Showcasing this set of slides titled Strategic Sales Area Plan With Leader Board Inspiration PDF. The topics addressed in these templates are Strategic Sales Area, Plan Leader Board. All the content presented in this PPT design is completely editable. Download it and make adjustments in color, background, font etc. as per your unique business setting.
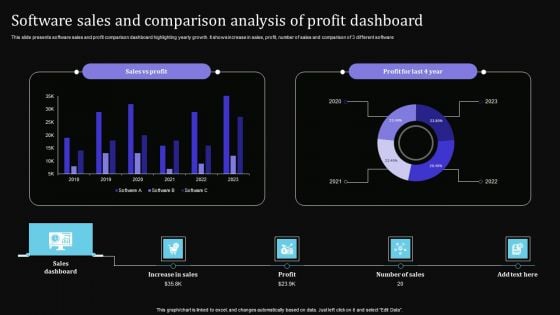
Software Sales And Comparison Analysis Of Profit Dashboard Sample PDF
This slide presents software sales and profit comparison dashboard highlighting yearly growth. It shows increase in sales, profit, number of sales and comparison of 3 different software. Showcasing this set of slides titled Software Sales And Comparison Analysis Of Profit Dashboard Sample PDF. The topics addressed in these templates are Increase Sales, Profit, Sales Dashboard. All the content presented in this PPT design is completely editable. Download it and make adjustments in color, background, font etc. as per your unique business setting.
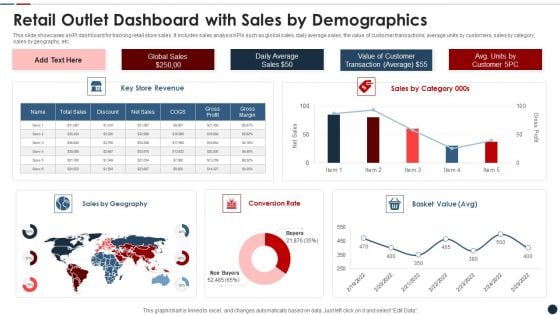
Retail Outlet Dashboard With Sales By Demographics Slides PDF
This slide showcases a KPI dashboard for tracking retail store sales. It includes sales analysis KPIs such as global sales, daily average sales, the value of customer transactions, average units by customers, sales by category, sales by geography, etc. Showcasing this set of slides titled retail outlet dashboard with sales by demographics slides pdf The topics addressed in these templates are Retail outlet dashboard with sales by demographics All the content presented in this PPT design is completely editable. Download it and make adjustments in color, background, font etc. as per your unique business setting.
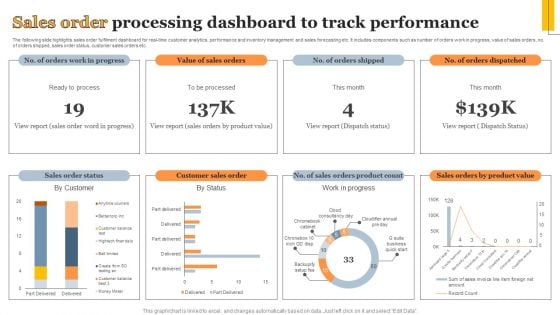
Sales Order Processing Dashboard To Track Performance Information PDF
The following slide highlights sales order fulfilment dashboard for real-time customer analytics, performance and inventory management and sales forecasting etc. It includes components such as number of orders work in progress, value of sales orders, no. of orders shipped, sales order status, customer sales orders etc. Showcasing this set of slides titled Sales Order Processing Dashboard To Track Performance Information PDF. The topics addressed in these templates are Sales Order Status, Customer Sales Order, Work Progress. All the content presented in this PPT design is completely editable. Download it and make adjustments in color, background, font etc. as per your unique business setting.
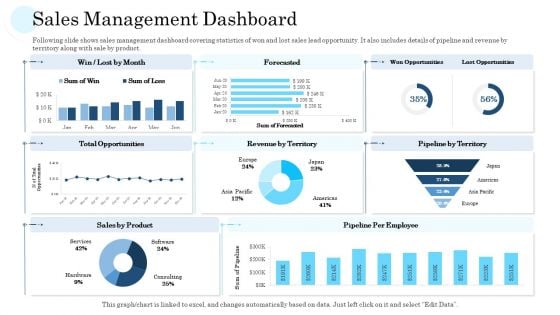
Sales Management Dashboard Ppt PowerPoint Presentation Portfolio Gallery PDF
Following slide shows sales management dashboard covering statistics of won and lost sales lead opportunity. It also includes details of pipeline and revenue by territory along with sale by product.Deliver and pitch your topic in the best possible manner with this sales management dashboard ppt powerpoint presentation portfolio gallery pdf. Use them to share invaluable insights on total opportunities, sales by product, revenue by territory, pipeline per employee and impress your audience. This template can be altered and modified as per your expectations. So, grab it now.
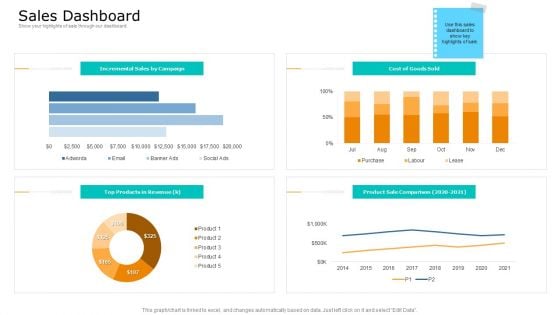
Commodity Unique Selling Proposition Sales Dashboard Pictures PDF
Show your highlights of sale through our dashboard. Deliver an awe inspiring pitch with this creative commodity unique selling proposition sales dashboard pictures pdf bundle. Topics like sales dashboard can be discussed with this completely editable template. It is available for immediate download depending on the needs and requirements of the user.
Dashboard For Tracking Sales Target Metrics Introduction PDF
This slide presents KPI dashboard for tracking Sales Target Metrics achievement monthly and region wise helpful in adjusting activities as per ongoing performance. It includes average weekly sales revenue, average sales target, annual sales growth, regional sales performance and average revenue per unit that should be regularly tracked. Showcasing this set of slides titled Dashboard For Tracking Sales Target Metrics Introduction PDF. The topics addressed in these templates are Average Revenue, Per Unit, Average Weekly, Sales Revenue. All the content presented in this PPT design is completely editable. Download it and make adjustments in color, background, font etc. as per your unique business setting.
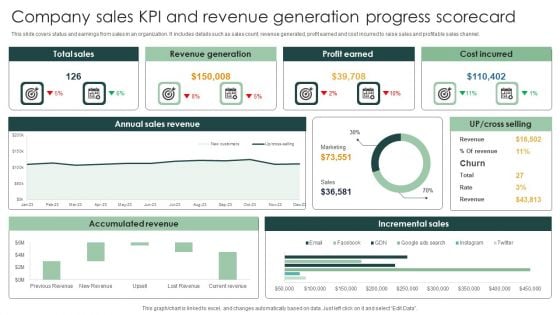
Company Sales KPI And Revenue Generation Progress Scorecard Formats PDF
This slide covers status and earnings from sales in an organization. It includes details such as sales count, revenue generated, profit earned and cost incurred to raise sales and profitable sales channel.Showcasing this set of slides titled Company Sales KPI And Revenue Generation Progress Scorecard Formats PDF. The topics addressed in these templates are Accumulated Revenue, Annual Sales Revenue, Incremental Sales. All the content presented in this PPT design is completely editable. Download it and make adjustments in color, background, font etc. as per your unique business setting.
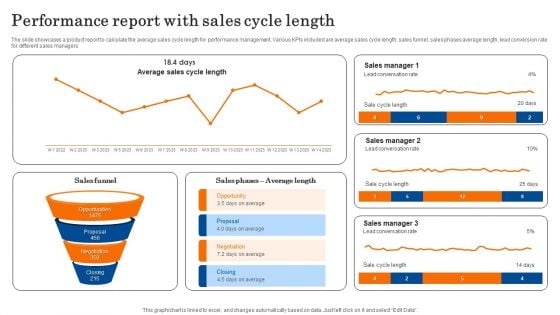
Performance Report With Sales Cycle Length Template PDF
The slide showcases a product report to calculate the average sales cycle length for performance management. Various KPIs included are average sales cycle length, sales funnel, sales phases average length, lead conversion rate for different sales managers. sPitch your topic with ease and precision using this Performance Report With Sales Cycle Length Template PDF. This layout presents information on Sales Manager, Conversation Rate, Opportunity. It is also available for immediate download and adjustment. So, changes can be made in the color, design, graphics or any other component to create a unique layout.

Regional Marketing Strategies Regional Sales Performance Metrics Dashboard Infographics PDF
This slide provides the glimpse about the sales performance metrics which focuses on regional sales based on customer demands and sales team performance. Deliver and pitch your topic in the best possible manner with this regional marketing strategies regional sales performance metrics dashboard infographics pdf. Use them to share invaluable insights on regional sales performance metrics dashboard and impress your audience. This template can be altered and modified as per your expectations. So, grab it now.
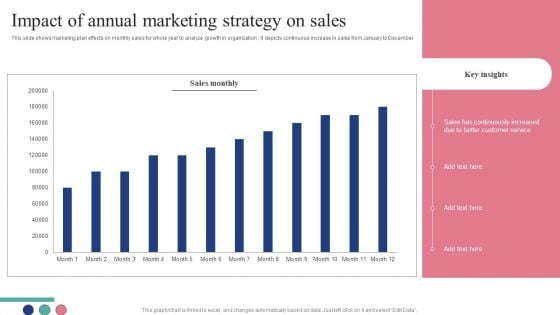
Impact Of Annual Marketing Strategy On Sales Download PDF
This slide shows marketing plan effects on monthly sales for whole year to analyze growth in organization . It depicts continuous increase in sales from January to December Showcasing this set of slides titled Impact Of Annual Marketing Strategy On Sales Download PDF. The topics addressed in these templates are Sales Monthly, Key Insights, Sales. All the content presented in this PPT design is completely editable. Download it and make adjustments in color, background, font etc. as per your unique business setting.
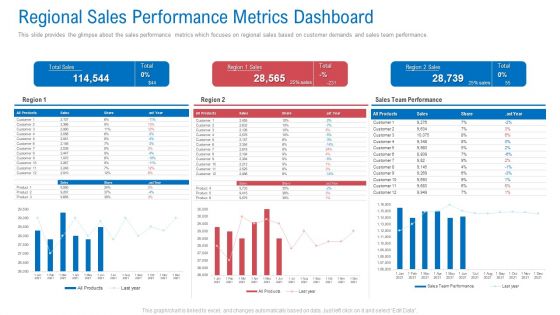
Regional Marketing Planning Regional Sales Performance Metrics Dashboard Information PDF
This slide provides the glimpse about the sales performance metrics which focuses on regional sales based on customer demands and sales team performance. Deliver an awe inspiring pitch with this creative regional marketing planning regional sales performance metrics dashboard information pdf bundle. Topics like regional sales performance metrics dashboard can be discussed with this completely editable template. It is available for immediate download depending on the needs and requirements of the user.

Market Area Analysis Regional Sales Performance Metrics Dashboard Designs PDF
This slide provides the glimpse about the sales performance metrics which focuses on regional sales based on customer demands and sales team performance. Deliver and pitch your topic in the best possible manner with this market area analysis regional sales performance metrics dashboard designs pdf. Use them to share invaluable insights on regional sales performance metrics dashboard and impress your audience. This template can be altered and modified as per your expectations. So, grab it now.
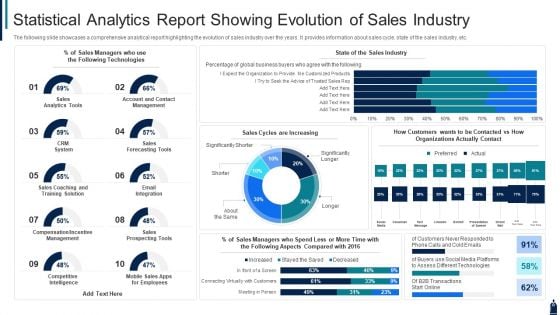
Statistical Analytics Report Showing Evolution Of Sales Industry Diagrams PDF
The following slide showcases a comprehensive analytical report highlighting the evolution of sales industry over the years. It provides information about sales cycle, state of the sales industry, etc. Showcasing this set of slides titled statistical analytics report showing evolution of sales industry diagrams pdf. The topics addressed in these templates are sales, technologies, system. All the content presented in this PPT design is completely editable. Download it and make adjustments in color, background, font etc. as per your unique business setting.
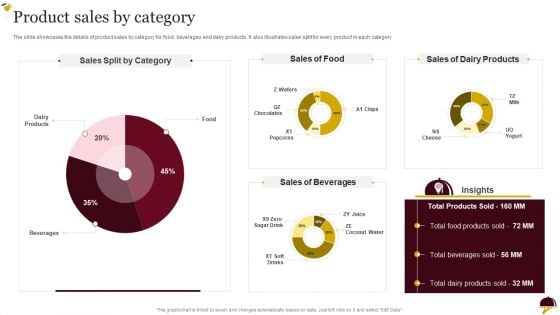
Food Company Overview Product Sales By Category Structure PDF
The slide showcases the details of product sales by category for food, beverages and dairy products. It also illustrates sales split for every product in each category.Deliver an awe inspiring pitch with this creative Food Company Overview Product Sales By Category Structure PDF bundle. Topics like Dairy Products, Sales Of Beverages, Sales Of Food can be discussed with this completely editable template. It is available for immediate download depending on the needs and requirements of the user.
Tracking Customer Sales Funnel Dashboard Improving Distribution Channel Mockup PDF
This slide covers information regarding the customer sales funnel tracking with sales volume and total market. Deliver and pitch your topic in the best possible manner with this Tracking Customer Sales Funnel Dashboard Improving Distribution Channel Mockup PDF. Use them to share invaluable insights on Tracking Customer, Sales Funnel, Sales Volume and impress your audience. This template can be altered and modified as per your expectations. So, grab it now.
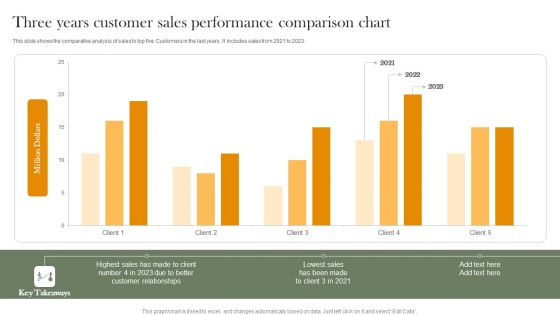
Three Years Customer Sales Performance Comparison Chart Professional PDF
This slide shows the comparative analysis of sales to top five Customers in the last years. It includes sales from 2021 to 2023. Pitch your topic with ease and precision using this Three Years Customer Sales Performance Comparison Chart Professional PDF. This layout presents information on Highest Sales, Customer Relationships, Lowest Sales. It is also available for immediate download and adjustment. So, changes can be made in the color, design, graphics or any other component to create a unique layout.

Six Month Sales Forecast Report Linear Chart Themes PDF
Months to manage sales operations as this slide shows sales report chart of six per forecast. It includes months and six months sales amount Showcasing this set of slides titled Six Month Sales Forecast Report Linear Chart Themes PDF. The topics addressed in these templates are Sales Amount Chart, Key Insights, Conversion Rate. All the content presented in this PPT design is completely editable. Download it and make adjustments in color, background, font etc. as per your unique business setting.
Quarterly Sales Revenue Generation Performance Chart Icon Slides PDF
This graph or chart is linked to excel, and changes automatically based on data. Just left click on it and select edit data. Persuade your audience using this Quarterly Sales Revenue Generation Performance Chart Icon Slides PDF. This PPT design covers four stages, thus making it a great tool to use. It also caters to a variety of topics including Quarterly Sales Revenue, Generation Performance, Chart Icon. Download this PPT design now to present a convincing pitch that not only emphasizes the topic but also showcases your presentation skills.
Monthly Sales Performance Tracking And Monitoring Dashboard Diagrams PDF
This slide showcases a dashboard presenting various metrics to measure and analyze sales performance for revenue growth. It includes key components such as number of sales, revenue, profit, cost, sales revenue, sales increment, cost analysis and cross sell. Make sure to capture your audiences attention in your business displays with our gratis customizable Monthly Sales Performance Tracking And Monitoring Dashboard Diagrams PDF. These are great for business strategies, office conferences, capital raising or task suggestions. If you desire to acquire more customers for your tech business and ensure they stay satisfied, create your own sales presentation with these plain slides.
Monthly Sales Performance Tracking And Monitoring Dashboard Designs PDF
This slide showcases a dashboard presenting various metrics to measure and analyze sales performance for revenue growth. It includes key components such as number of sales, revenue, profit, cost, sales revenue, sales increment, cost analysis and cross sell. Make sure to capture your audiences attention in your business displays with our gratis customizable Monthly Sales Performance Tracking And Monitoring Dashboard Designs PDF. These are great for business strategies, office conferences, capital raising or task suggestions. If you desire to acquire more customers for your tech business and ensure they stay satisfied, create your own sales presentation with these plain slides.
Sales Performance Dashboard With Average Lead Tracking Time Background PDF
This slide showcases dashboard for sales performance that can help organization to analyze the effectiveness of sales campaigns and average response time of lead. Its key components are average contract value, average sales cycle length, follow up contract rate and sales activity. Showcasing this set of slides titled Sales Performance Dashboard With Average Lead Tracking Time Background PDF. The topics addressed in these templates are Avg Contract Value, Sales Activity, Contract Rate. All the content presented in this PPT design is completely editable. Download it and make adjustments in color, background, font etc. as per your unique business setting.
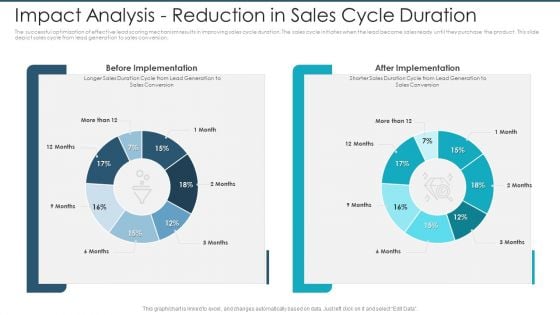
Impact Analysis Reduction In Sales Cycle Duration Infographics PDF
The successful optimization of effective lead scoring mechanism results in improving sales cycle duration. The sales cycle initiates when the lead become sales ready until they purchase the product. This slide depict sales cycle from lead generation to sales conversion.Deliver an awe-inspiring pitch with this creative impact analysis reduction in sales cycle duration infographics pdf. bundle. Topics like before implementation, after implementation can be discussed with this completely editable template. It is available for immediate download depending on the needs and requirements of the user.
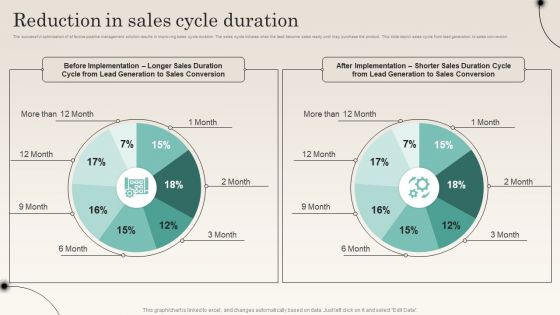
Reduction In Sales Cycle Duration Improving Distribution Channel Slides PDF
The successful optimization of effective pipeline management solution results in improving sales cycle duration. The sales cycle initiates when the lead become sales ready until they purchase the product. This slide depict sales cycle from lead generation to sales conversion.Deliver and pitch your topic in the best possible manner with this Reduction In Sales Cycle Duration Improving Distribution Channel Slides PDF. Use them to share invaluable insights on Positive Momentum, Opportunities Progression, Enhance Engagement and impress your audience. This template can be altered and modified as per your expectations. So, grab it now.
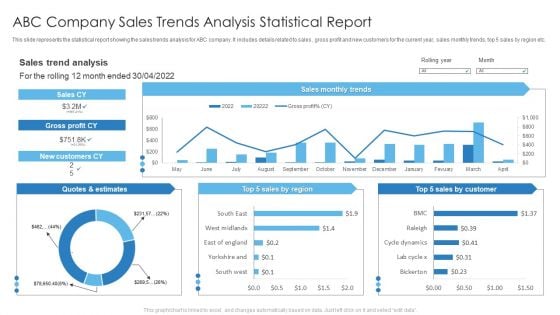
Abc Company Sales Trends Analysis Statistical Report Slides PDF
This slide represents the statistical report showing the sales trends analysis for ABC company. It includes details related to sales , gross profit and new customers for the current year, sales monthly trends, top 5 sales by region etc. Deliver an awe inspiring pitch with this creative Abc Company Sales Trends Analysis Statistical Report Slides PDF bundle. Topics like Abc Company Sales, Trends Analysis Statistical Report can be discussed with this completely editable template. It is available for immediate download depending on the needs and requirements of the user.
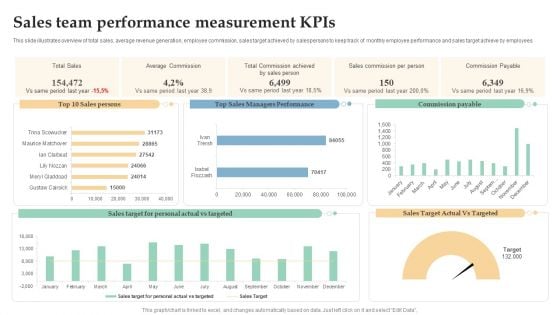
Sales Team Performance Measurement Kpis Ppt Professional Templates PDF
This slide illustrates overview of total sales, average revenue generation, employee commission, sales target achieved by salespersons to keep track of monthly employee performance and sales target achieve by employees. Showcasing this set of slides titled Sales Team Performance Measurement Kpis Ppt Professional Templates PDF. The topics addressed in these templates are Total Sales, Average Commission, Sales Commission, Per Person. All the content presented in this PPT design is completely editable. Download it and make adjustments in color, background, font etc. as per your unique business setting.
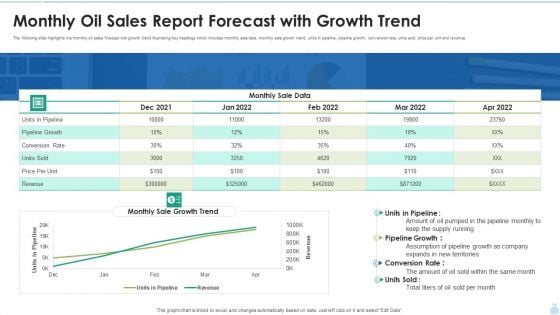
Monthly Oil Sales Report Forecast With Growth Trend Graphics PDF
The following slide highlights the monthly oil sales forecast with growth trend illustrating key headings which includes monthly sale data, monthly sale growth trend, units in pipeline, pipeline growth, conversion rate, units sold, price per unit and revenue. Showcasing this set of slides titled Monthly Oil Sales Report Forecast With Growth Trend Graphics PDF. The topics addressed in these templates are Pipeline Growth, Monthly Sale Data, Conversion Rate. All the content presented in this PPT design is completely editable. Download it and make adjustments in color, background, font etc. as per your unique business setting.
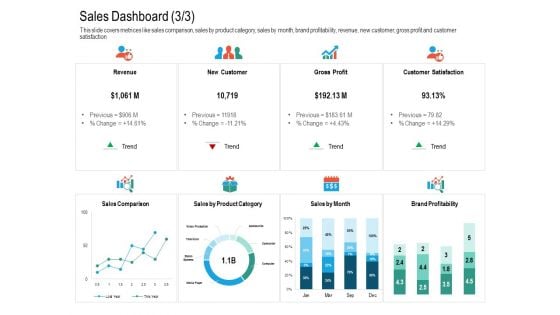
Upselling Strategies For Business Sales Dashboard Trend Guidelines PDF
This slide covers metrices like sales comparison, sales by product category, sales by month, brand profitability, revenue, new customer, gross profit and customer satisfaction. Deliver and pitch your topic in the best possible manner with this upselling strategies for business sales dashboard trend guidelines pdf. Use them to share invaluable insights on revenue, gross profit, customer satisfaction, new customer and impress your audience. This template can be altered and modified as per your expectations. So, grab it now.
PowerPoint Templates Corporate Success Sales Tags Ppt Slide
PowerPoint Templates Corporate Success Sales Tags PPT Slide-These high quality powerpoint pre-designed slides and powerpoint templates have been carefully created by our professional team to help you impress your audience. All slides have been created and are 100% editable in powerpoint. Each and every property of any graphic - color, size, orientation, shading, outline etc. can be modified to help you build an effective powerpoint presentation. Any text can be entered at any point in the powerpoint template or slide. Simply DOWNLOAD, TYPE and PRESENT! We've helped thoudands deliver successful presentations with our PowerPoint Templates Corporate Success Sales Tags Ppt Slide. You'll always stay ahead of the game.
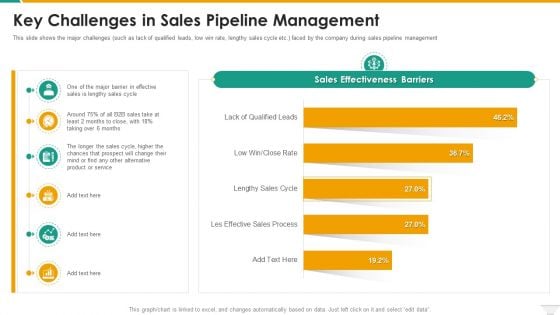
Key Challenges In Sales Pipeline Management Microsoft PDF
This slide shows the major challenges such as lack of qualified leads, low win rate, lengthy sales cycle etc. faced by the company during sales pipeline management Deliver and pitch your topic in the best possible manner with this Key Challenges In Sales Pipeline Management Microsoft PDF. Use them to share invaluable insights on Key Challenges In Sales Pipeline Management and impress your audience. This template can be altered and modified as per your expectations. So, grab it now.
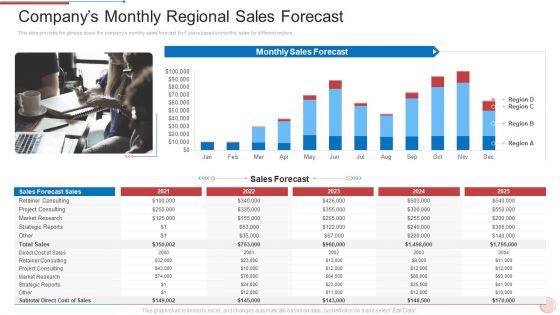
Regional Marketing Strategies Companys Monthly Regional Sales Forecast Graphics PDF
This slide provides the glimpse about the companys monthly sales forecast for 5 years based on monthly sales for different regions. Deliver and pitch your topic in the best possible manner with this regional marketing strategies companys monthly regional sales forecast graphics pdf. Use them to share invaluable insights on strategic, sales, cost and impress your audience. This template can be altered and modified as per your expectations. So, grab it now.
B2B Sales Representative Insights Dashboard Ppt Icon PDF
This slide covers the sales reps dashboard wherein teams contribution to leads, managing SQLs and revenue targets are evaluated.Deliver an awe-inspiring pitch with this creative B2B sales representative insights dashboard ppt icon pdf. bundle. Topics like sales representatives leads actual, sales representatives revenue actual, revenue pace can be discussed with this completely editable template. It is available for immediate download depending on the needs and requirements of the user.


 Continue with Email

 Home
Home


