Sales Graph
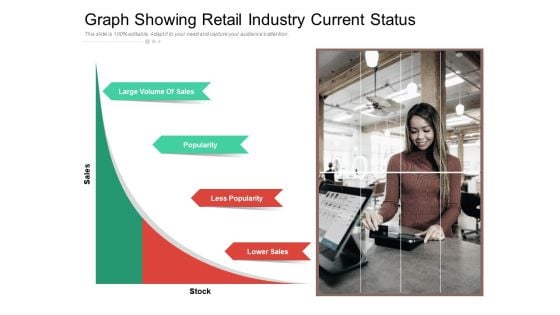
Graph Showing Retail Industry Current Status Ppt PowerPoint Presentation Styles Design Inspiration PDF
Presenting this set of slides with name graph showing retail industry current status ppt powerpoint presentation styles design inspiration pdf. This is a one stage process. The stages in this process are large volume of sales, popularity, less popularity, lower sales, stock, sales. This is a completely editable PowerPoint presentation and is available for immediate download. Download now and impress your audience.
Sales & Marketing PowerPoint Icon with Down Arrow
3d decay graph bar Our Down Arrow Icon S amplify your erudition. You will be earmarked for your brilliance.
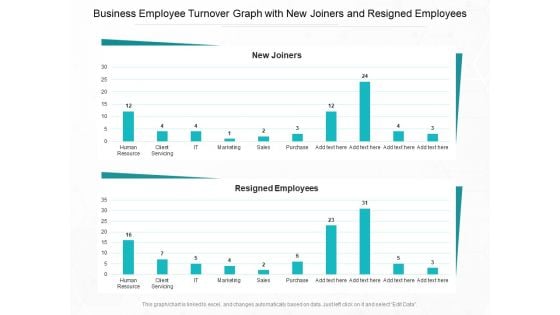
Business Employee Turnover Graph With New Joiners And Resigned Employees Ppt PowerPoint Presentation Summary Backgrounds PDF
Presenting this set of slides with name business employee turnover graph with new joiners and resigned employees ppt powerpoint presentation summary backgrounds pdf. The topics discussed in these slides are human resource, client servicing, it, marketing, sales, purchase. This is a completely editable PowerPoint presentation and is available for immediate download. Download now and impress your audience.
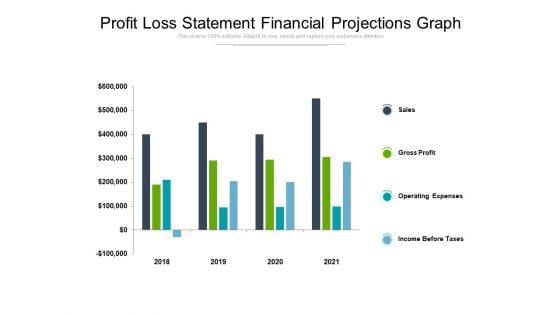
Profit Loss Statement Financial Projections Graph Ppt PowerPoint Presentation Summary Slides
Presenting this set of slides with name profit loss statement financial projections graph ppt powerpoint presentation summary slides. The topics discussed in these slides are sales, gross profit, operating expenses, income before taxes. This is a completely editable PowerPoint presentation and is available for immediate download. Download now and impress your audience.
Pareto Graph Of Consumer Assessment For Business Performance Ppt PowerPoint Presentation Icon Inspiration PDF
Presenting this set of slides with name pareto graph of consumer assessment for business performance ppt powerpoint presentation icon inspiration pdf. The topics discussed in these slides are customer, product, market, pareto chart, sales, value. This is a completely editable PowerPoint presentation and is available for immediate download. Download now and impress your audience.
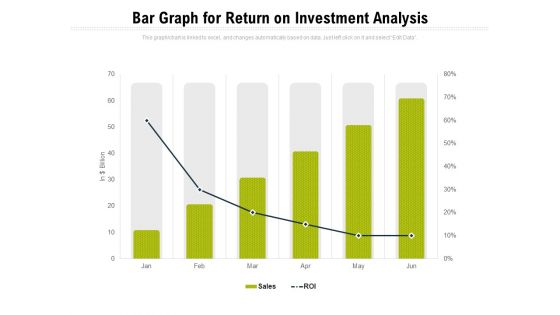
Bar Graph For Return On Investment Analysis Ppt PowerPoint Presentation Infographics Structure PDF
Presenting this set of slides with name bar graph for return on investment analysis ppt powerpoint presentation infographics structure pdf. The topics discussed in these slides are sales, roi. This is a completely editable PowerPoint presentation and is available for immediate download. Download now and impress your audience.
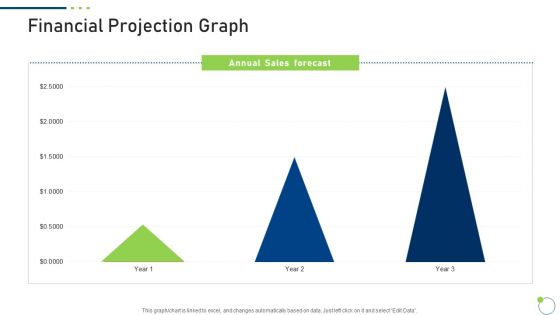
Investor Pitch Deck New Venture Capital Raising Financial Projection Graph Slide2 Portrait PDF
Deliver and pitch your topic in the best possible manner with this investor pitch deck new venture capital raising financial projection graph slide2 portrait pdf. Use them to share invaluable insights on annual sales, gross margin, net profit and impress your audience. This template can be altered and modified as per your expectations. So, grab it now.
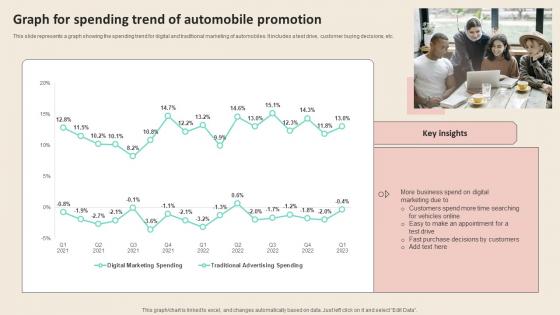
Graph For Spending Trend Of Automobile Promotional Strategies To Increase Download PDF
This slide represents a graph showing the spending trend for digital and traditional marketing of automobiles. It includes a test drive, customer buying decisions, etc. Whether you have daily or monthly meetings, a brilliant presentation is necessary. Graph For Spending Trend Of Automobile Promotional Strategies To Increase Download PDF can be your best option for delivering a presentation. Represent everything in detail using Graph For Spending Trend Of Automobile Promotional Strategies To Increase Download PDF and make yourself stand out in meetings. The template is versatile and follows a structure that will cater to your requirements. All the templates prepared by Slidegeeks are easy to download and edit. Our research experts have taken care of the corporate themes as well. So, give it a try and see the results. This slide represents a graph showing the spending trend for digital and traditional marketing of automobiles. It includes a test drive, customer buying decisions, etc.
Marketing Business Sales PowerPoint Backgrounds And Templates 1210
Microsoft PowerPoint Template and Background with Business bar graph on monitor with arrow indicator Cast our Marketing Business Sales PowerPoint Backgrounds And Templates 1210 in your act. The audience will call for an encore.
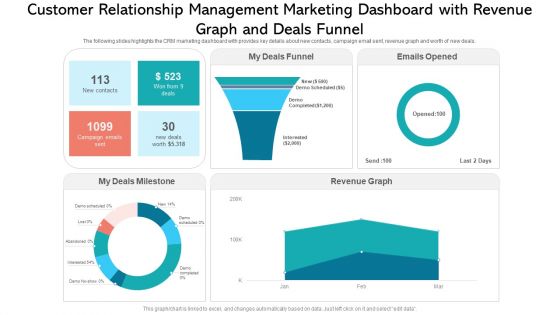
Customer Relationship Management Marketing Dashboard With Revenue Graph And Deals Funnel Ideas PDF
The following slides highlights the CRM marketing dashboard with provides key details about new contacts, campaign email sent, revenue graph and worth of new deals. Showcasing this set of slides titled customer relationship management marketing dashboard with revenue graph and deals funnel ideas pdf. The topics addressed in these templates are funnel, revenue graph, campaign. All the content presented in this PPT design is completely editable. Download it and make adjustments in color, background, font etc. as per your unique business setting.
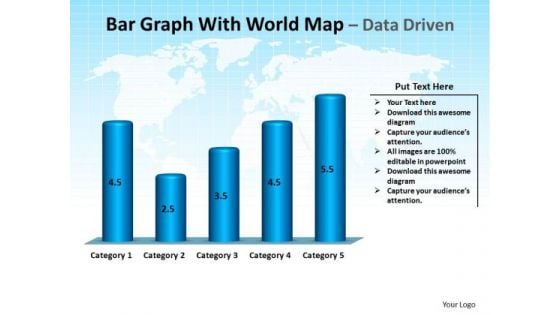
Business Success PowerPoint Templates Business Bar Graph With World Map Ppt Slides
Business Success PowerPoint Templates Business bar graph with world map PPT Slides-This PowerPoint Template is a illustration of bar garph with world map on blue background -Business Success PowerPoint Templates Business bar graph with world map PPT Slides-This ppt can be used for concepts relating to-animated, business, finance, sales, marketing, accounting, future, education, america, Antarctica, arrow, Asia, charts, statistics, budget, investment, abstract, australia, background, bar, blue, calculation, company and continents. Load up with our Business Success PowerPoint Templates Business Bar Graph With World Map Ppt Slides with our Business Success PowerPoint Templates Business Bar Graph With World Map Ppt Slides. You will be at the top of your game.
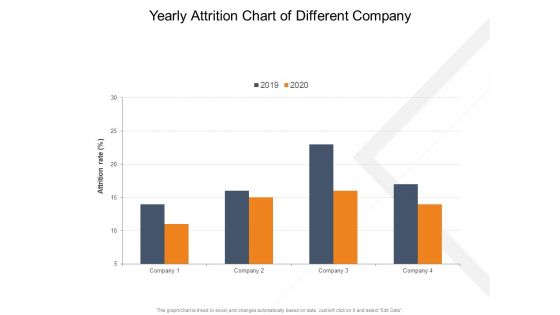
Employee Turnover Graph Of Various Companies Ppt PowerPoint Presentation Styles Template PDF
Presenting this set of slides with name employee turnover graph of various companies ppt powerpoint presentation styles template pdf. The topics discussed in these slide is employee turnover graph of various companies. This is a completely editable PowerPoint presentation and is available for immediate download. Download now and impress your audience.
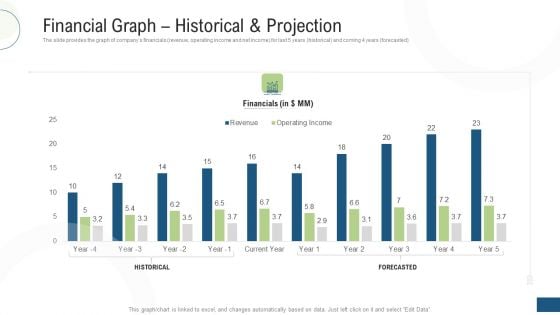
Investor Pitch Deck Fundraising Via Mezzanine Equity Instrument Financial Graph Historical And Projection Formats PDF
The slide provides the graph of companys financials revenue, operating income and net income for last 5 years historical and coming 4 years forecasted. Deliver and pitch your topic in the best possible manner with this investor pitch deck fundraising via mezzanine equity instrument financial graph historical and projection formats pdf. Use them to share invaluable insights on financial graph historical and projection and impress your audience. This template can be altered and modified as per your expectations. So, grab it now.
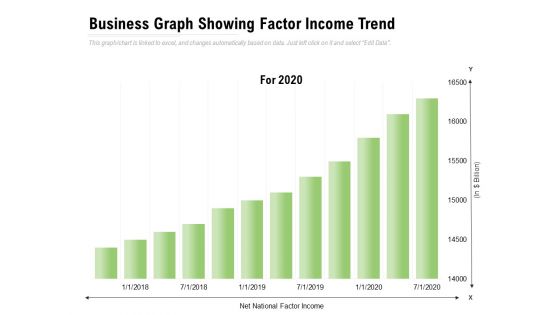
Business Graph Showing Factor Income Trend Ppt PowerPoint Presentation Slides Mockup
Presenting this set of slides with name business graph showing factor income trend ppt powerpoint presentation slides mockup. The topics discussed in these slide is business graph showing factor income trend. This is a completely editable PowerPoint presentation and is available for immediate download. Download now and impress your audience.
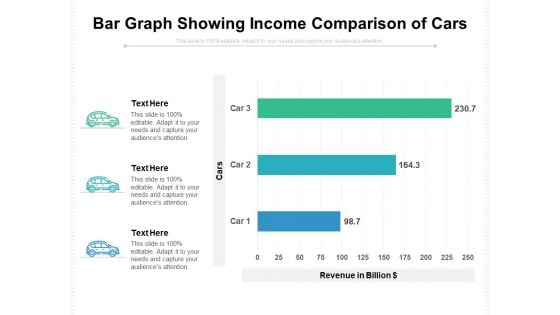
Bar Graph Showing Income Comparison Of Cars Ppt PowerPoint Presentation Gallery Brochure PDF
Presenting this set of slides with name bar graph showing income comparison of cars ppt powerpoint presentation gallery brochure pdf. The topics discussed in these slide is bar graph showing income comparison of cars. This is a completely editable PowerPoint presentation and is available for immediate download. Download now and impress your audience.
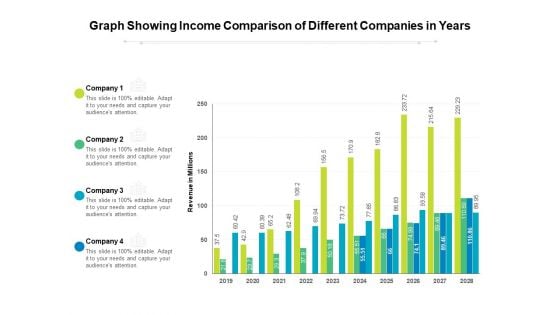
Graph Showing Income Comparison Of Different Companies In Years Ppt PowerPoint Presentation Gallery Clipart PDF
Presenting this set of slides with name graph showing income comparison of different companies in years ppt powerpoint presentation gallery clipart pdf. The topics discussed in these slide is graph showing income comparison of different companies in years. This is a completely editable PowerPoint presentation and is available for immediate download. Download now and impress your audience.
Bar Graph Showing Income Of Business Segments Ppt PowerPoint Presentation Icon Example PDF
Pitch your topic with ease and precision using this bar graph showing income of business segments ppt powerpoint presentation icon example pdf. This layout presents information on bar graph showing income of business segments. It is also available for immediate download and adjustment. So, changes can be made in the color, design, graphics or any other component to create a unique layout.
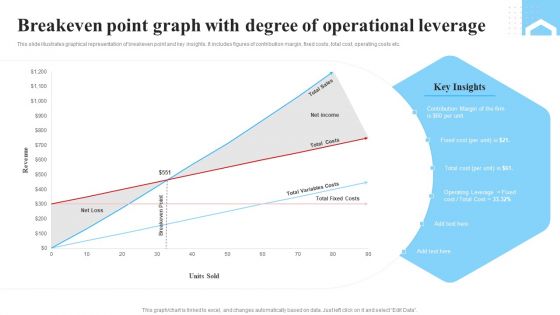
Breakeven Point Graph With Degree Of Operational Leverage Ppt Layouts Graphics Pictures PDF
This slide illustrates graphical representation of breakeven point and key insights. It includes figures of contribution margin, fixed costs, total cost, operating costs etc. Showcasing this set of slides titled Breakeven Point Graph With Degree Of Operational Leverage Ppt Layouts Graphics Pictures PDF. The topics addressed in these templates are Total Sales, Net income, Total Costs, Total Variables Costs. All the content presented in this PPT design is completely editable. Download it and make adjustments in color, background, font etc. as per your unique business setting.
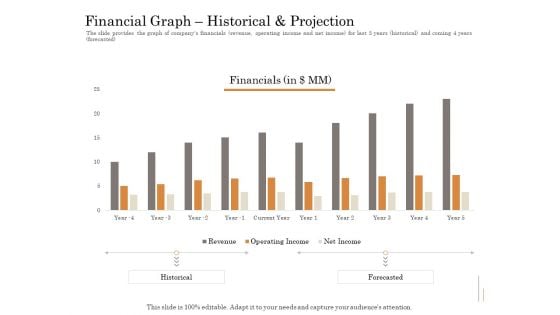
Subordinated Loan Funding Financial Graph Historical And Projection Ppt Model File Formats PDF
The slide provides the graph of companys financials revenue, operating income and net income for last 5 years historical and coming 4 years forecasted. Deliver and pitch your topic in the best possible manner with this subordinated loan funding financial graph historical and projection ppt model file formats pdf. Use them to share invaluable insights on revenue, operating income, net income, current year. and impress your audience. This template can be altered and modified as per your expectations. So, grab it now.
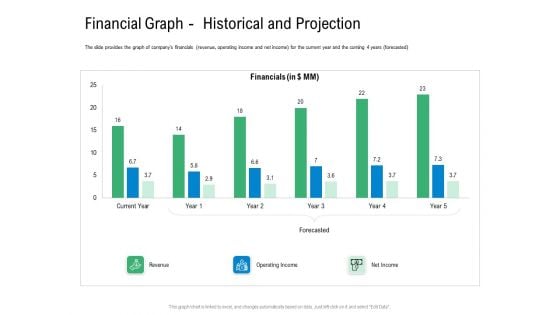
Convertible Preferred Stock Funding Pitch Deck Financial Graph Historical And Projection Themes PDF
The slide provides the graph of companys financials revenue, operating income and net income for the current year and the coming 4 years forecasted. Deliver an awe inspiring pitch with this creative convertible preferred stock funding pitch deck financial graph historical and projection themes pdf bundle. Topics like revenue, operating income, net income can be discussed with this completely editable template. It is available for immediate download depending on the needs and requirements of the user.
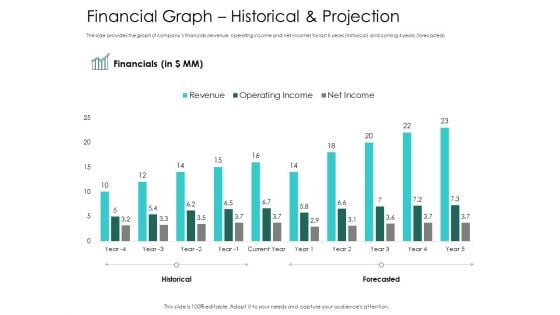
Hybrid Investment Pitch Deck Financial Graph Historical And Projection Ppt Portfolio Design Inspiration PDF
The slide provides the graph of companys financials revenue, operating income and net income for last 5 years historical and coming 4 years forecasted. Deliver an awe inspiring pitch with this creative hybrid investment pitch deck financial graph historical and projection ppt portfolio design inspiration pdf bundle. Topics like financial, revenue, operating income, net income can be discussed with this completely editable template. It is available for immediate download depending on the needs and requirements of the user.
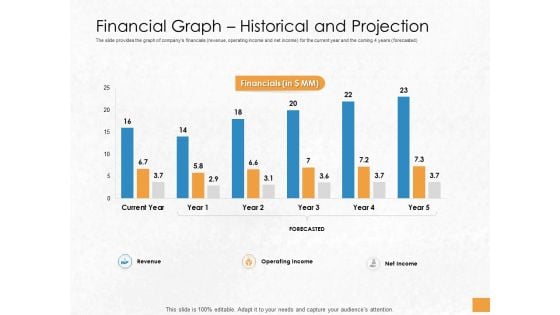
Convertible Debenture Funding Financial Graph Historical And Projection Ppt Professional Themes PDF
The slide provides the graph of companys financials revenue, operating income and net income for the current year and the coming 4 years forecasted. Deliver an awe-inspiring pitch with this creative convertible debenture funding financial graph historical and projection ppt professional themes pdf bundle. Topics like revenue, operating income, net income, forecasted, financials, current year can be discussed with this completely editable template. It is available for immediate download depending on the needs and requirements of the user.
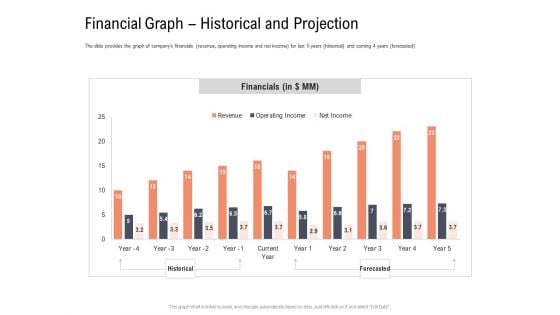
Investor Pitch Deck To Collect Capital From Subordinated Loan Financial Graph Historical And Projection Introduction PDF
The slide provides the graph of companys financials revenue, operating income and net income for last 5 years historical and coming 4 years forecasted. Deliver an awe-inspiring pitch with this creative investor pitch deck to collect capital from subordinated loan financial graph historical and projection introduction pdf bundle. Topics like financials, net income, operating income, revenue, historical, forecasted can be discussed with this completely editable template. It is available for immediate download depending on the needs and requirements of the user.
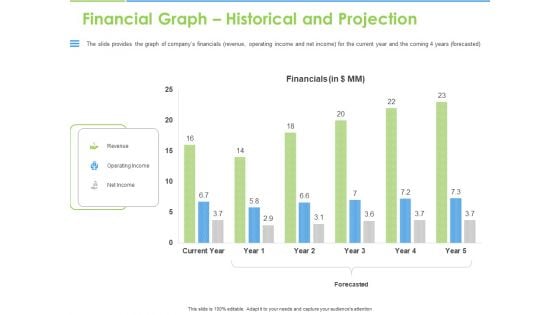
Convertible Bonds Pitch Deck For Increasing Capitals Financial Graph Historical And Projection Elements PDF
The slide provides the graph of companys financials revenue, operating income and net income for the current year and the coming 4 years forecasted. Deliver an awe-inspiring pitch with this creative convertible bonds pitch deck for increasing capitals financial graph historical and projection elements pdf bundle. Topics like revenue, operating income, net income, forecasted, financials, current year can be discussed with this completely editable template. It is available for immediate download depending on the needs and requirements of the user.
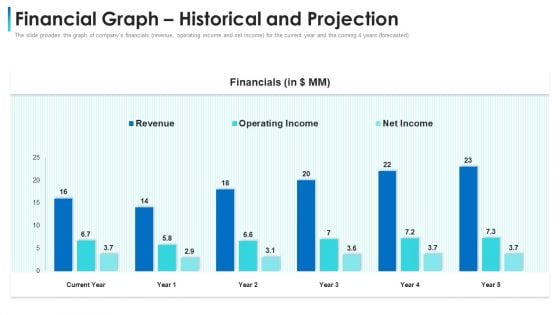
Convertible Bond Financing Pitch Deck Financial Graph Historical And Projection Slides PDF
The slide provides the graph of companys financials revenue, operating income and net income for the current year and the coming 4 years forecasted. Deliver an awe-inspiring pitch with this creative convertible bond financing pitch deck financial graph historical and projection slides pdf bundle. Topics like revenue, operating income, net income, financial can be discussed with this completely editable template. It is available for immediate download depending on the needs and requirements of the user.
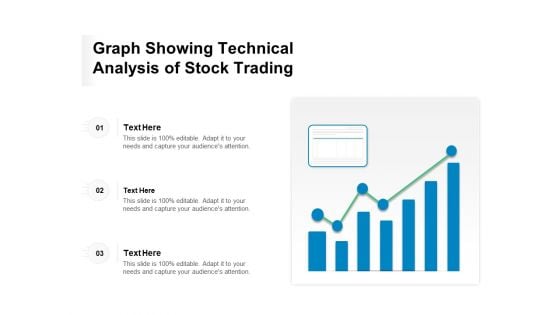
Graph Showing Technical Analysis Of Stock Trading Ppt PowerPoint Presentation Infographic Template Portrait PDF
Presenting this set of slides with name graph showing technical analysis of stock trading ppt powerpoint presentation infographic template portrait pdf. This is a three stage process. The stages in this process are graph showing technical analysis of stock trading. This is a completely editable PowerPoint presentation and is available for immediate download. Download now and impress your audience.
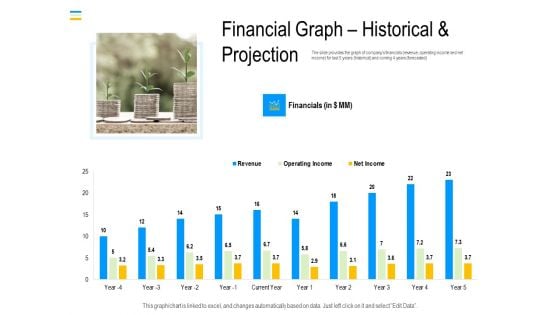
Mezzanine Debt Financing Pitch Deck Financial Graph Historical And Projection Demonstration PDF
The slide provides the graph of companys financials revenue, operating income and net income for last five years historical and coming four years forecasted. Deliver and pitch your topic in the best possible manner with this mezzanine debt financing pitch deck financial graph historical and projection demonstration pdf. Use them to share invaluable insights on financials, revenue, operating income and impress your audience. This template can be altered and modified as per your expectations. So, grab it now.
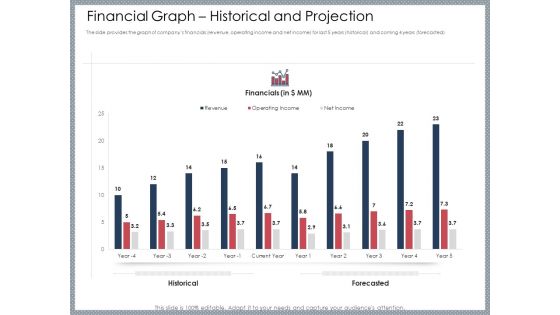
Mezzanine Venture Capital Funding Pitch Deck Financial Graph Historical And Projection Pictures PDF
The slide provides the graph of companys financials revenue operating income and net income for last five years historical and coming four years forecasted. Deliver and pitch your topic in the best possible manner with this mezzanine venture capital funding pitch deck financial graph historical and projection pictures pdf. Use them to share invaluable insights on financial, historical, projection, year, revenue and impress your audience. This template can be altered and modified as per your expectations. So, grab it now.
Bar Graph Showing Of Business Income And Expenditure Ppt PowerPoint Presentation Icon Show PDF
Presenting this set of slides with name bar graph showing of business income and expenditure ppt powerpoint presentation icon show pdf. The topics discussed in these slides are expenses, revenue. This is a completely editable PowerPoint presentation and is available for immediate download. Download now and impress your audience.
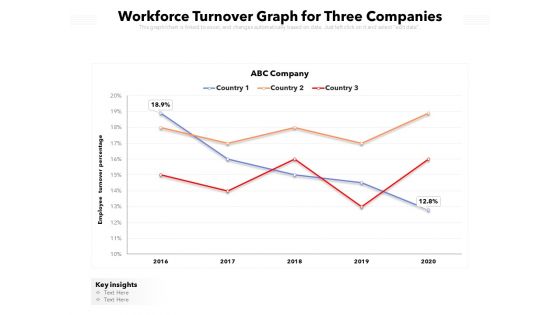
Workforce Turnover Graph For Three Companies Ppt PowerPoint Presentation Infographic Template Visuals PDF
Presenting this set of slides with name workforce turnover graph for three companies ppt powerpoint presentation infographic template visuals pdf. The topics discussed in these slides are key insights, 2016 to 2020, employee turnover percentage. This is a completely editable PowerPoint presentation and is available for immediate download. Download now and impress your audience.
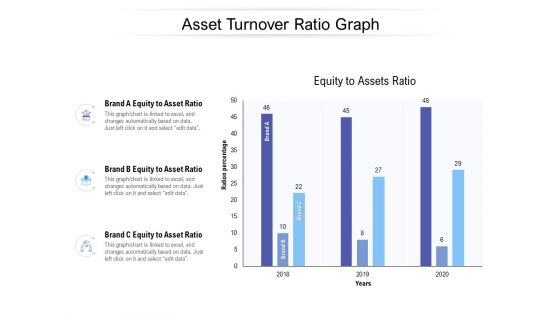
Asset Turnover Ratio Graph Ppt PowerPoint Presentation Outline Graphics Template PDF
Presenting this set of slides with name asset turnover ratio graph ppt powerpoint presentation outline graphics template pdf. The topics discussed in these slides are brand a equity to asset ratio, brand b equity to asset ratio, brand c equity to asset ratio. This is a completely editable PowerPoint presentation and is available for immediate download. Download now and impress your audience.
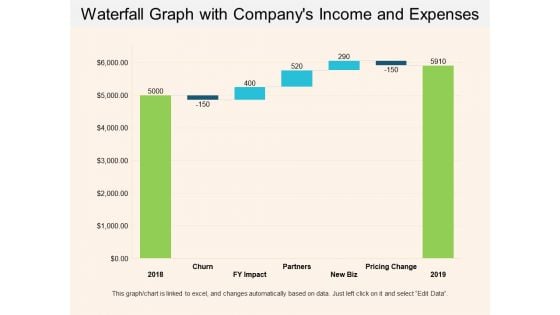
Waterfall Graph With Companys Income And Expenses Ppt PowerPoint Presentation Show Example Introduction
This is a waterfall graph with companys income and expenses ppt powerpoint presentation show example introduction. This is a three stage process. The stages in this process are profit and loss, balance sheet, income statement, benefit and loss.
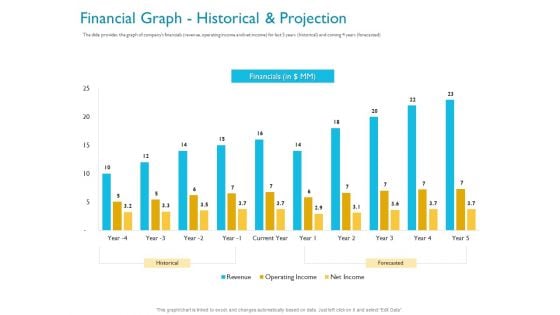
Investor Funding Deck For Hybrid Financing Financial Graph Historical And Projection Ppt Layouts Slides PDF
The slide provides the graph of companys financials revenue, operating income and net income for last 5 years historical and coming 4 years forecasted. Deliver and pitch your topic in the best possible manner with this investor funding deck for hybrid financing financial graph historical and projection ppt layouts slides pdf. Use them to share invaluable insights on historical, forecasted, net income, operating income, financial and impress your audience. This template can be altered and modified as per your expectations. So, grab it now.
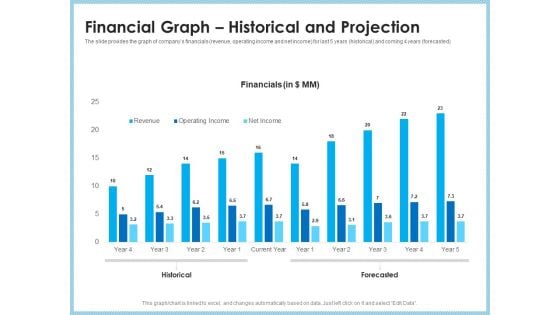
Investment Pitch To Generating Capital From Mezzanine Credit Financial Graph Historical And Projection Microsoft PDF
The slide provides the graph of companys financials revenue, operating income and net income for last 5 years historical and coming 4 years forecasted. Deliver and pitch your topic in the best possible manner with this investment pitch to generating capital from mezzanine credit financial graph historical and projection microsoft pdf. Use them to share invaluable insights on revenue, operating income, net income, current year, historical, forecasted and impress your audience. This template can be altered and modified as per your expectations. So, grab it now.
Gross And Net Revenue Comparison Shown By Graph Ppt PowerPoint Presentation File Icons PDF
Presenting this set of slides with name gross and net revenue comparison shown by graph ppt powerpoint presentation file icons pdf. The topics discussed in these slides are gross profit, net profit. This is a completely editable PowerPoint presentation and is available for immediate download. Download now and impress your audience.
Bar Graph Showing Profit Analysis Ppt PowerPoint Presentation Icon Deck PDF
Presenting this set of slides with name bar graph showing profit analysis ppt powerpoint presentation icon deck pdf. The topics discussed in these slides are gross revenue, income. This is a completely editable PowerPoint presentation and is available for immediate download. Download now and impress your audience.
Online Business Website Competitive Assessment Graph Ppt PowerPoint Presentation Icon Topics PDF
Presenting this set of slides with name online business website competitive assessment graph ppt powerpoint presentation icon topics pdf. The topics discussed in these slides are visitors, purchase, user visiting again, competitor. This is a completely editable PowerPoint presentation and is available for immediate download. Download now and impress your audience.
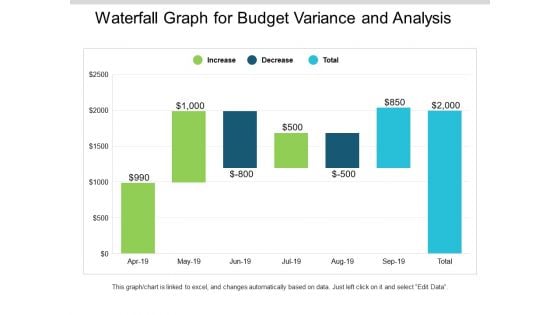
Waterfall Graph For Budget Variance And Analysis Ppt PowerPoint Presentation Slides Mockup
This is a waterfall graph for budget variance and analysis ppt powerpoint presentation slides mockup. This is a three stage process. The stages in this process are profit and loss, balance sheet, income statement, benefit and loss.
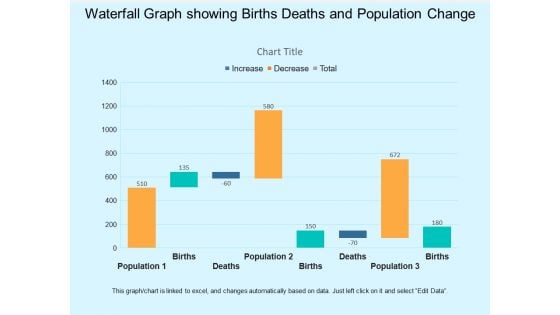
Waterfall Graph Showing Births Deaths And Population Change Ppt PowerPoint Presentation Infographic Template Visual Aids
This is a waterfall graph showing births deaths and population change ppt powerpoint presentation infographic template visual aids. This is a three stage process. The stages in this process are profit and loss, balance sheet, income statement, benefit and loss.
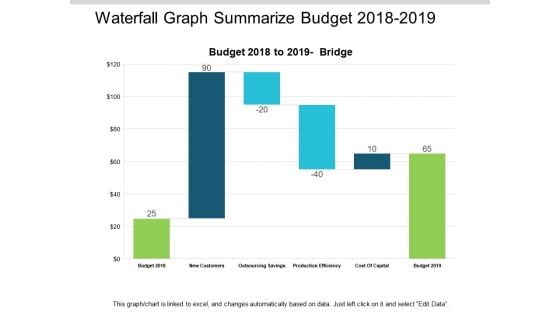
Waterfall Graph Summarize Budget 2018 To 2019 Ppt PowerPoint Presentation Summary Slides
This is a waterfall graph summarize budget 2018 to 2019 ppt powerpoint presentation summary slides. This is a three stage process. The stages in this process are profit and loss, balance sheet, income statement, benefit and loss.
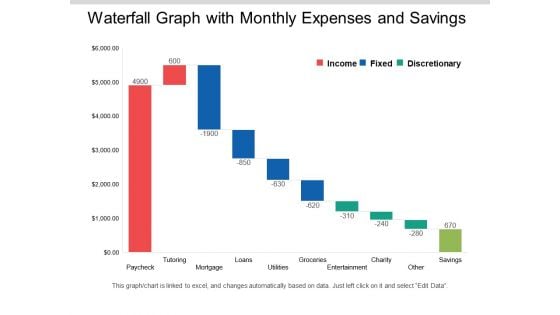
Waterfall Graph With Monthly Expenses And Savings Ppt PowerPoint Presentation Layouts Clipart Images
This is a waterfall graph with monthly expenses and savings ppt powerpoint presentation layouts clipart images. This is a three stage process. The stages in this process are profit and loss, balance sheet, income statement, benefit and loss.
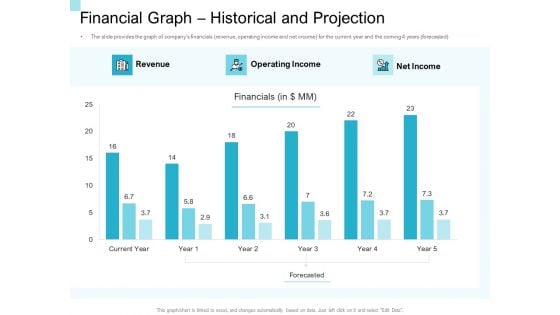
Convertible Market Notes Financial Graph Historical And Projection Ppt Summary Show PDF
Deliver an awe inspiring pitch with this creative convertible market notes financial graph historical and projection ppt summary show pdf bundle. Topics like revenue, operating income, net income, financial can be discussed with this completely editable template. It is available for immediate download depending on the needs and requirements of the user.
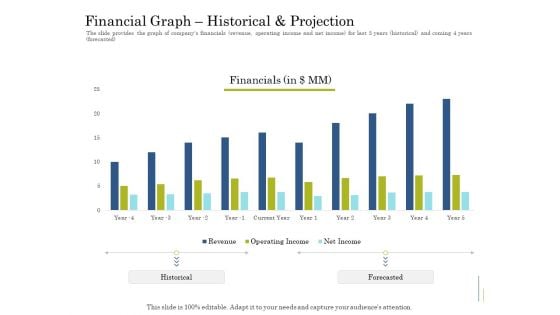
Supplementary Debt Financing Pitch Deck Financial Graph Historical And Projection Brochure PDF
Deliver an awe inspiring pitch with this creative supplementary debt financing pitch deck financial graph historical and projection brochure pdf bundle. Topics like financial, revenue, operating income, net income can be discussed with this completely editable template. It is available for immediate download depending on the needs and requirements of the user.
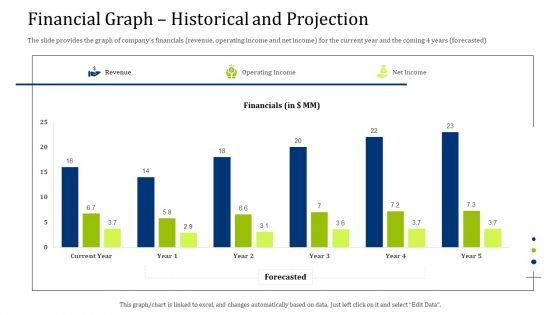
Convertible Debt Financing Pitch Deck Financial Graph Historical And Projection Clipart PDF
Deliver an awe-inspiring pitch with this creative convertible debt financing pitch deck financial graph historical and projection clipart pdf bundle. Topics like revenue, operating income, net income can be discussed with this completely editable template. It is available for immediate download depending on the needs and requirements of the user.
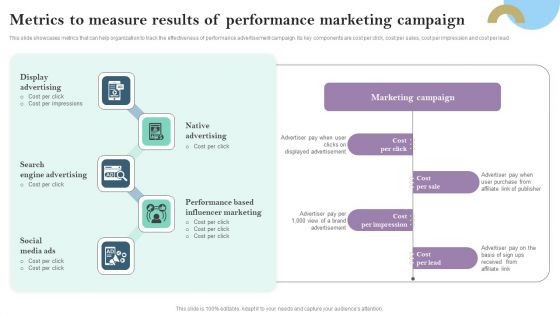
Metrics To Measure Results Of Performance Marketing Campaign Ppt PowerPoint Presentation Diagram Graph Charts PDF
This slide showcases metrics that can help organization to track the effectiveness of performance advertisement campaign. Its key components are cost per click, cost per sales, cost per impression and cost per lead Presenting this PowerPoint presentation, titled Metrics To Measure Results Of Performance Marketing Campaign Ppt PowerPoint Presentation Diagram Graph Charts PDF, with topics curated by our researchers after extensive research. This editable presentation is available for immediate download and provides attractive features when used. Download now and captivate your audience. Presenting this Metrics To Measure Results Of Performance Marketing Campaign Ppt PowerPoint Presentation Diagram Graph Charts PDF. Our researchers have carefully researched and created these slides with all aspects taken into consideration. This is a completely customizable Metrics To Measure Results Of Performance Marketing Campaign Ppt PowerPoint Presentation Diagram Graph Charts PDF that is available for immediate downloading. Download now and make an impact on your audience. Highlight the attractive features available with our PPTs.
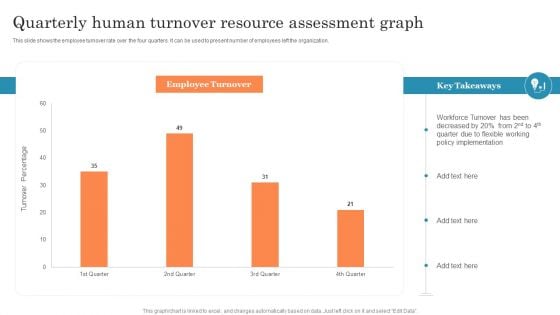
Quarterly Human Turnover Resource Assessment Graph Ppt PowerPoint Presentation Styles Infographic Template PDF
This slide shows the employee turnover rate over the four quarters. It can be used to present number of employees left the organization. Showcasing this set of slides titled Quarterly Human Turnover Resource Assessment Graph Ppt PowerPoint Presentation Styles Infographic Template PDF. The topics addressed in these templates are Flexible Working, Policy Implementation, Turnover Been. All the content presented in this PPT design is completely editable. Download it and make adjustments in color, background, font etc. as per your unique business setting.
Downturn Graph Showing Decrease In Income Over The Years Ppt PowerPoint Presentation Icon File Formats PDF
Showcasing this set of slides titled downturn graph showing decrease in income over the years ppt powerpoint presentation icon file formats pdf. The topics addressed in these templates are middle class share of total income, middle class share of income, union membership rate, 2013 to 2020. All the content presented in this PPT design is completely editable. Download it and make adjustments in color, background, font etc. as per your unique business setting.
Expenses And Income Comparison Graph With Budget Summary Ppt PowerPoint Presentation Icon Inspiration PDF
This slide illustrates budget summary of expenditure of a company. it includes income and expenditure comparative data and expenditure chart etc.Pitch your topic with ease and precision using this Expenses And Income Comparison Graph With Budget Summary Ppt PowerPoint Presentation Icon Inspiration PDF. This layout presents information on Budget Summary, Expenditure Comparative, Actual Income. It is also available for immediate download and adjustment. So, changes can be made in the color, design, graphics or any other component to create a unique layout.
Staff Turnover Graph Vector Icon Ppt PowerPoint Presentation Icon Background Images PDF
Presenting this set of slides with name staff turnover graph vector icon ppt powerpoint presentation icon background images pdf. This is a three stage process. The stages in this process are staff turnover graph vector icon. This is a completely editable PowerPoint presentation and is available for immediate download. Download now and impress your audience.
Workforce Downward Turnover Graph Vector Icon Ppt PowerPoint Presentation Icon Template PDF
Presenting this set of slides with name workforce downward turnover graph vector icon ppt powerpoint presentation icon template pdf. This is a three stage process. The stages in this process are workforce downward turnover graph vector icon. This is a completely editable PowerPoint presentation and is available for immediate download. Download now and impress your audience.
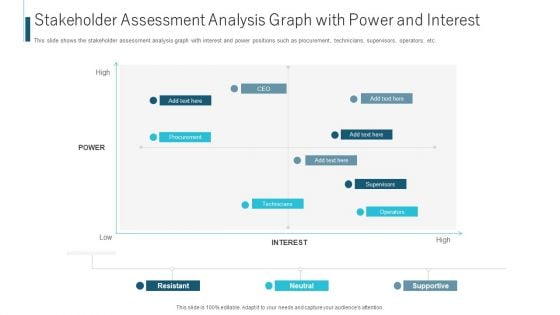
Stakeholder Assessment Analysis Graph With Power And Interest Ppt Gallery Skills PDF
This slide shows the stakeholder assessment analysis graph with interest and power positions such as procurement, technicians, supervisors, operators, etc. This is a stakeholder assessment analysis graph with power and interest ppt gallery skills pdf. template with various stages. Focus and dispense information on four stages using this creative set, that comes with editable features. It contains large content boxes to add your information on topics like technicians, procurement, supervisors, operators. You can also showcase facts, figures, and other relevant content using this PPT layout. Grab it now.
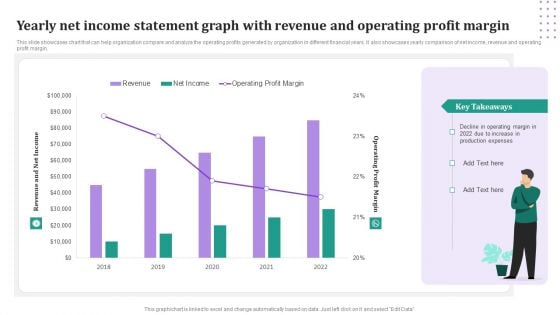
Yearly Net Income Statement Graph With Revenue And Operating Profit Margin Download PDF
This slide showcases chart that can help organization compare and analyze the operating profits generated by organization in different financial years. It also showcases yearly comparison of net income, revenue and operating profit margin. Pitch your topic with ease and precision using this Yearly Net Income Statement Graph With Revenue And Operating Profit Margin Download PDF. This layout presents information on Revenue, Net Income, Operating Profit Margin. It is also available for immediate download and adjustment. So, changes can be made in the color, design, graphics or any other component to create a unique layout.
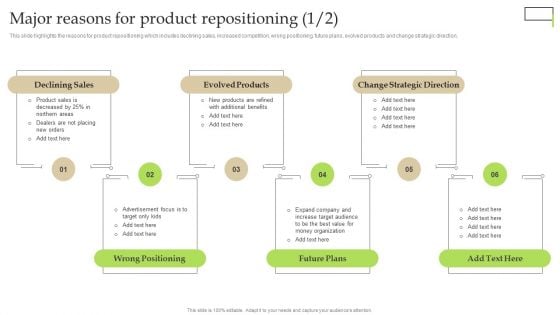
Major Reasons For Product Repositioning Ppt PowerPoint Presentation Diagram Graph Charts PDF
This slide highlights the reasons for product repositioning which includes declining sales, increased competition, wrong positioning, future plans, evolved products and change strategic direction. Do you have to make sure that everyone on your team knows about any specific topic I yes, then you should give Major Reasons For Product Repositioning Ppt PowerPoint Presentation Diagram Graph Charts PDF a try. Our experts have put a lot of knowledge and effort into creating this impeccable Major Reasons For Product Repositioning Ppt PowerPoint Presentation Diagram Graph Charts PDF. You can use this template for your upcoming presentations, as the slides are perfect to represent even the tiniest detail. You can download these templates from the Slidegeeks website and these are easy to edit. So grab these today
Person Showing Share Trading Graph Vector Icon Ppt PowerPoint Presentation Show Maker PDF
Presenting this set of slides with name person showing share trading graph vector icon ppt powerpoint presentation show maker pdf. This is a three stage process. The stages in this process are person showing share trading graph vector icon. This is a completely editable PowerPoint presentation and is available for immediate download. Download now and impress your audience.

Picture Showing Graph Of Share Trading And Investment Ppt PowerPoint Presentation Outline Guide PDF
Presenting this set of slides with name picture showing graph of share trading and investment ppt powerpoint presentation outline guide pdf. This is a three stage process. The stages in this process are picture showing graph of share trading and investment. This is a completely editable PowerPoint presentation and is available for immediate download. Download now and impress your audience.

Monitoring Showing Stock Trading And Analysis Graph Ppt PowerPoint Presentation Ideas Slideshow PDF
Presenting this set of slides with name monitoring showing stock trading and analysis graph ppt powerpoint presentation ideas slideshow pdf. This is a one stage process. The stage in this process is monitoring showing stock trading and analysis graph. This is a completely editable PowerPoint presentation and is available for immediate download. Download now and impress your audience.
Revenue Split Pie Graph Vector Icon Ppt PowerPoint Presentation Show Elements PDF
Showcasing this set of slides titled revenue split pie graph vector icon ppt powerpoint presentation show elements pdf. The topics addressed in these templates are revenue split pie graph vector icon. All the content presented in this PPT design is completely editable. Download it and make adjustments in color, background, font etc. as per your unique business setting.
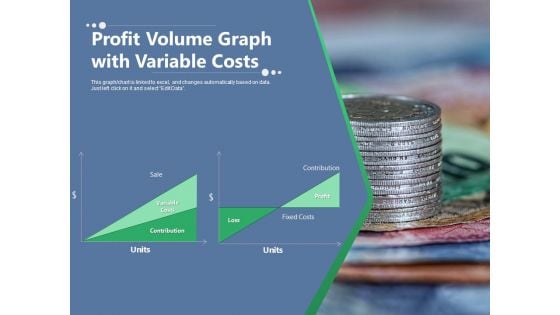
Profit Volume Graph With Variable Costs Ppt PowerPoint Presentation Outline Brochure PDF
Presenting this set of slides with name profit volume graph with variable costs ppt powerpoint presentation outline brochure pdf. This is a one stage process. The stages in this process are sale, contribution, variable costs, profit, fixed costs, loss, units. This is a completely editable PowerPoint presentation and is available for immediate download. Download now and impress your audience.
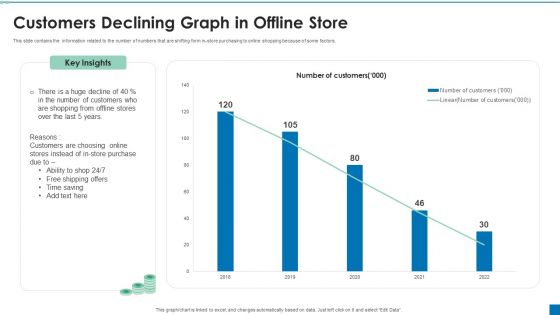
Customers Declining Graph In Offline Store Ppt PowerPoint Presentation Professional Clipart PDF
This slide contains the information related to the number of numbers that are shifting form in-store purchasing to online shopping because of some factors. Pitch your topic with ease and precision using this Customers Declining Graph In Offline Store Ppt PowerPoint Presentation Professional Clipart PDF. This layout presents information on Customers Choosing, Store Purchase, Time Saving. It is also available for immediate download and adjustment. So, changes can be made in the color, design, graphics or any other component to create a unique layout.
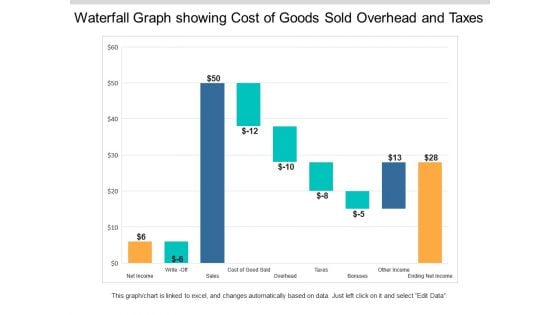
Waterfall Graph Showing Cost Of Goods Sold Overhead And Taxes Ppt PowerPoint Presentation Styles Example Topics
This is a waterfall graph showing cost of goods sold overhead and taxes ppt powerpoint presentation styles example topics. This is a three stage process. The stages in this process are profit and loss, balance sheet, income statement, benefit and loss.


 Continue with Email

 Home
Home


