Sales Graph
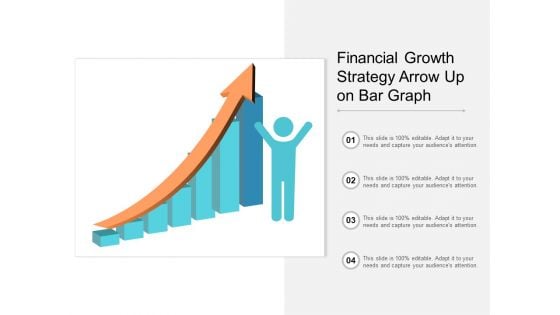
Financial Growth Strategy Arrow Up On Bar Graph Ppt PowerPoint Presentation Gallery Example
This is a financial growth strategy arrow up on bar graph ppt powerpoint presentation gallery example. This is a four stage process. The stages in this process are growth, increase sales, increase revenue.
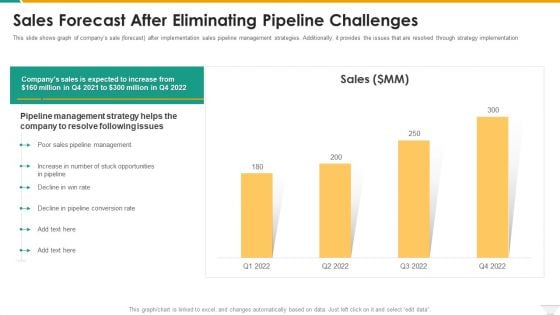
Sales Forecast After Eliminating Pipeline Challenges Guidelines PDF
This slide shows graph of companys sale forecast after implementation sales pipeline management strategies. Additionally, it provides the issues that are resolved through strategy implementation. Deliver and pitch your topic in the best possible manner with this Sales Forecast After Eliminating Pipeline Challenges Guidelines PDF. Use them to share invaluable insights on Management, Sales, Opportunities, Rate and impress your audience. This template can be altered and modified as per your expectations. So, grab it now.
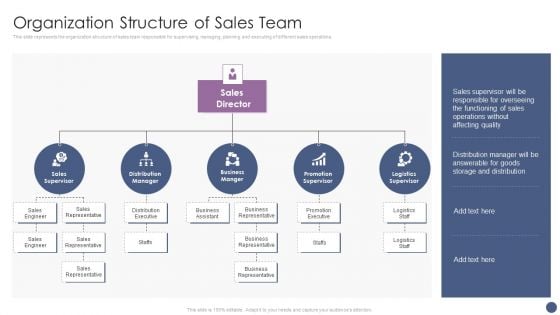
Competitive Sales Strategy Development Plan For Revenue Growth Organization Structure Of Sales Team Pictures PDF
This slide represents the organization structure of sales team responsible for supervising, managing, planning and executing of different sales operations. Presenting Competitive Sales Strategy Development Plan For Revenue Growth Organization Structure Of Sales Team Pictures PDF to provide visual cues and insights. Share and navigate important information on four stages that need your due attention. This template can be used to pitch topics like Sales Supervisor, Business Manger, Promotion Supervisor. In addtion, this PPT design contains high resolution images, graphics, etc, that are easily editable and available for immediate download.
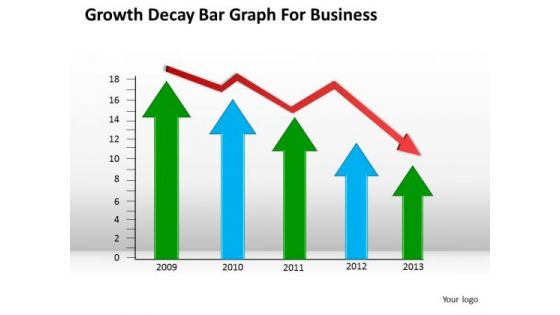
Consulting PowerPoint Template Growth Decay Bar Graph For Business Ppt Slides
Draw ahead of others with our consulting PowerPoint template growth decay bar graph for business ppt Slides. Cross the line and win the race. Draw out the best in you with our Arrows PowerPoint Templates. Let your inner brilliance come to the surface. Draw out the talents of your team. Use our Business PowerPoint Templates to give them an incentive. Scale peaks with our Consulting PowerPoint Template Growth Decay Bar Graph For Business Ppt Slides. You will come out on top.
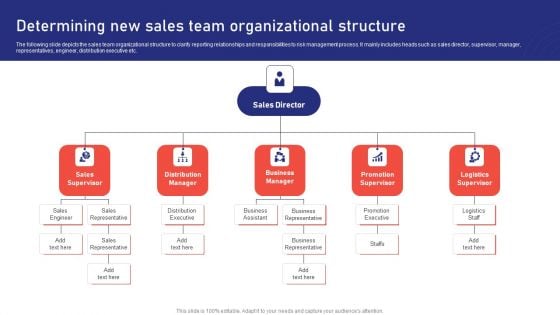
Sales Risk Assessment For Profit Maximization Determining New Sales Team Organizational Structure Structure PDF
The following slide depicts the sales team organizational structure to clarify reporting relationships and responsibilities to risk management process. It mainly includes heads such as sales director, supervisor, manager, representatives, engineer, distribution executive etc. Do you have to make sure that everyone on your team knows about any specific topic I yes, then you should give Sales Risk Assessment For Profit Maximization Determining New Sales Team Organizational Structure Structure PDF a try. Our experts have put a lot of knowledge and effort into creating this impeccable Sales Risk Assessment For Profit Maximization Determining New Sales Team Organizational Structure Structure PDF. You can use this template for your upcoming presentations, as the slides are perfect to represent even the tiniest detail. You can download these templates from the Slidegeeks website and these are easy to edit. So grab these today.
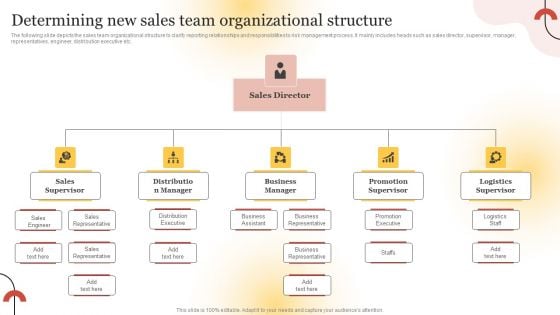
Executing Sales Risk Reduction Plan Determining New Sales Team Organizational Structure Clipart PDF
The following slide depicts the sales team organizational structure to clarify reporting relationships and responsibilities to risk management process. It mainly includes heads such as sales director, supervisor, manager, representatives, engineer, distribution executive etc. Do you have to make sure that everyone on your team knows about any specific topic I yes, then you should give Executing Sales Risk Reduction Plan Determining New Sales Team Organizational Structure Clipart PDF a try. Our experts have put a lot of knowledge and effort into creating this impeccable Executing Sales Risk Reduction Plan Determining New Sales Team Organizational Structure Clipart PDF. You can use this template for your upcoming presentations, as the slides are perfect to represent even the tiniest detail. You can download these templates from the Slidegeeks website and these are easy to edit. So grab these today.
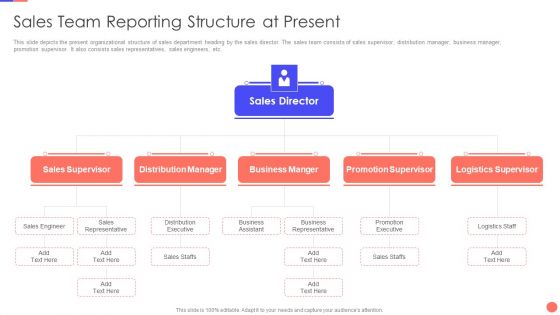
Sales Techniques Playbook Sales Team Reporting Structure At Present Infographics PDF
This is a sales techniques playbook sales team reporting structure at present infographics pdf template with various stages. Focus and dispense information on four stages using this creative set, that comes with editable features. It contains large content boxes to add your information on topics like distribution executive, business assistant, promotion executive, sales staffs. You can also showcase facts, figures, and other relevant content using this PPT layout. Grab it now.
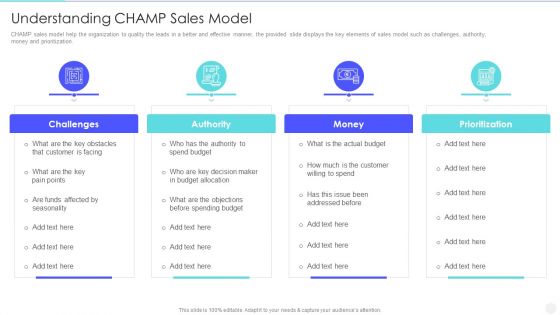
Increase Returns By Examining And Executing New Sales Qualification Procedure Understanding Champ Sales Professional PDF
CHAMP sales model help the organization to quality the leads in a better and effective manner, the provided slide displays the key elements of sales model such as challenges, authority, money and prioritization. Presenting increase returns by examining and executing new sales qualification procedure understanding champ sales professional pdf to provide visual cues and insights. Share and navigate important information on four stages that need your due attention. This template can be used to pitch topics like challenges, authority, money, prioritization. In addtion, this PPT design contains high resolution images, graphics, etc, that are easily editable and available for immediate download.
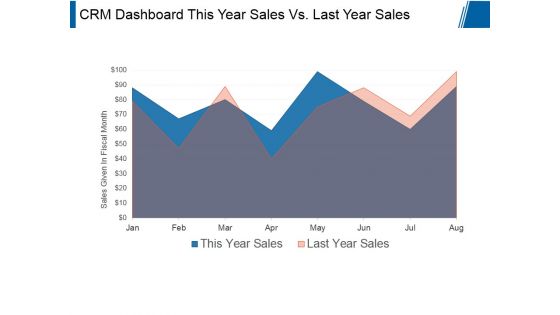
Crm Dashboard This Year Sales Vs Last Year Sales Ppt PowerPoint Presentation Styles
This is a crm dashboard this year sales vs last year sales ppt powerpoint presentation styles. This is a two stage process. The stages in this process are sales given in fiscal month, business, marketing, presentation, growth.

3d Business Success Bar Graph 2013 PowerPoint Templates Ppt Backgrounds For Slides 1212
We present our 3d Business Success Bar Graph 2013 PowerPoint Templates PPT Backgrounds For Slides 1212.Download and present our Business PowerPoint Templates because this template can project the path to sucess that you have charted. Use our Marketing PowerPoint Templates because The marketplace is the merger of your dreams and your ability. Present our Success PowerPoint Templates because your quest has taken you well onto the path of success. Present our Targets PowerPoint Templates because you can get advantage to prioritise your ideas. Download and present our New year PowerPoint Templates because you can Master them all and you have it made.Use these PowerPoint slides for presentations relating to 2013 business graph success, business, success, marketing, targets, new year . The prominent colors used in the PowerPoint template are Red, Blue light, Yellow. Professionals tell us our 3d Business Success Bar Graph 2013 PowerPoint Templates PPT Backgrounds For Slides 1212 will make the presenter successul in his career/life. We assure you our success PowerPoint templates and PPT Slides are Graceful. PowerPoint presentation experts tell us our 3d Business Success Bar Graph 2013 PowerPoint Templates PPT Backgrounds For Slides 1212 are Beautiful. Presenters tell us our success PowerPoint templates and PPT Slides are Precious. The feedback we get is that our 3d Business Success Bar Graph 2013 PowerPoint Templates PPT Backgrounds For Slides 1212 are Versatile. You can be sure our business PowerPoint templates and PPT Slides are Luxuriant. Bless your plans with our 3d Business Success Bar Graph 2013 PowerPoint Templates Ppt Backgrounds For Slides 1212. You will come out on top.
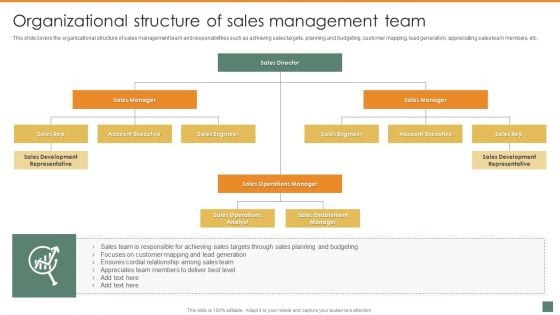
Organizational Structure Of Sales Management Team Summary And Significance Of Sales Automation Formats PDF
This slide covers the organizational structure of sales management team and responsibilities such as achieving sales targets, planning and budgeting, customer mapping, lead generation, appreciating sales team members, etc. This modern and well-arranged Organizational Structure Of Sales Management Team Summary And Significance Of Sales Automation Formats PDF provides lots of creative possibilities. It is very simple to customize and edit with the Powerpoint Software. Just drag and drop your pictures into the shapes. All facets of this template can be edited with Powerpoint no extra software is necessary. Add your own material, put your images in the places assigned for them, adjust the colors, and then you can show your slides to the world, with an animated slide included.

3d Bar Graph Leading Success 2013 PowerPoint Templates Ppt Backgrounds For Slides 1212
We present our 3d Bar Graph Leading Success 2013 PowerPoint Templates PPT Backgrounds For Slides 1212.Present our Business PowerPoint Templates because this layout helps you to bring some important aspects of your business process to the notice of all concerned. Streamline the flow of information across the board. Download our Marketing PowerPoint Templates because networking is an imperative in todays world. You need to access the views of others. Similarly you need to give access to them of your abilities. Download our Targets PowerPoint Templates because you have imbibed from this fountain of ideas and developed some worthwhile views. Present our Success PowerPoint Templates because You are working at that stage with an air of royalty. Let our PowerPoint Templates and Slides be the jewels in your crown. Download and present our New year PowerPoint Templates because this is a time to reflect and retrospect on successes and failures.Use these PowerPoint slides for presentations relating to 2013 bar chart shows success, business, marketing, new year, success, targets. The prominent colors used in the PowerPoint template are Black, Blue light, Red. Professionals tell us our 3d Bar Graph Leading Success 2013 PowerPoint Templates PPT Backgrounds For Slides 1212 will make the presenter successul in his career/life. We assure you our marketing PowerPoint templates and PPT Slides will make you look like a winner. PowerPoint presentation experts tell us our 3d Bar Graph Leading Success 2013 PowerPoint Templates PPT Backgrounds For Slides 1212 are Cheerful. Presenters tell us our marketing PowerPoint templates and PPT Slides are Tranquil. The feedback we get is that our 3d Bar Graph Leading Success 2013 PowerPoint Templates PPT Backgrounds For Slides 1212 are Spectacular. You can be sure our marketing PowerPoint templates and PPT Slides are Cheerful. Display entrepreneurial leadership with our 3d Bar Graph Leading Success 2013 PowerPoint Templates Ppt Backgrounds For Slides 1212. They will make you look good.
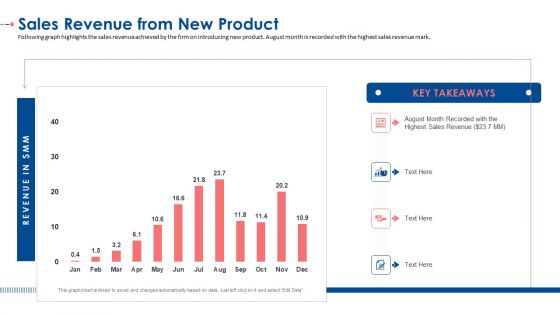
Sales Revenue From New Product Ppt Infographic Template Example PDF
Following graph highlights the sales revenue achieved by the firm on introducing new product. August month is recorded with the highest sales revenue mark. Deliver and pitch your topic in the best possible manner with this sales revenue from new product ppt infographic template example pdf. Use them to share invaluable insights on sales revenue from new product and impress your audience. This template can be altered and modified as per your expectations. So, grab it now.

Business People Clipart 3d Man Running On Arrow To Reach Top Graph PowerPoint Templates
We present our business people clipart 3d man running on arrow to reach top graph PowerPoint templates.Use our Arrows PowerPoint Templates because You can Create a matrix with our PowerPoint Templates and Slides. Feel the strength of your ideas click into place. Download our People PowerPoint Templates because Our PowerPoint Templates and Slides help you pinpoint your timelines. Highlight the reasons for your deadlines with their use. Use our Process and Flows PowerPoint Templates because Our PowerPoint Templates and Slides has conjured up a web of all you need with the help of our great team. Use them to string together your glistening ideas. Download our Success PowerPoint Templates because You can Create a matrix with our PowerPoint Templates and Slides. Feel the strength of your ideas click into place. Present our Target PowerPoint Templates because Our PowerPoint Templates and Slides will let you Leave a lasting impression to your audiences. They possess an inherent longstanding recall factor.Use these PowerPoint slides for presentations relating to 3d, abstract, arrow, background, bar,blue, business, businessman,character, chart, climbing, company,competition, concept, corporate, design,diagram, economy, figure, finance, goal,graph, graphic, growing, growth, idea,illustration, income, man, manager,market, people, person, profit, progress,reflection, render, run, statistic, succeed,success. The prominent colors used in the PowerPoint template are Red, White, Black. The feedback we get is that our business people clipart 3d man running on arrow to reach top graph PowerPoint templates provide you with a vast range of viable options. Select the appropriate ones and just fill in your text. Professionals tell us our business PowerPoint templates and PPT Slides are designed to make your presentations professional. PowerPoint presentation experts tell us our business people clipart 3d man running on arrow to reach top graph PowerPoint templates provide great value for your money. Be assured of finding the best projection to highlight your words. People tell us our businessman PowerPoint templates and PPT Slides are designed to make your presentations professional. Presenters tell us our business people clipart 3d man running on arrow to reach top graph PowerPoint templates are effectively colour coded to prioritise your plans They automatically highlight the sequence of events you desire. Professionals tell us our businessman PowerPoint templates and PPT Slides will help you be quick off the draw. Just enter your specific text and see your points hit home. Our Business People Clipart 3d Man Running On Arrow To Reach Top Graph PowerPoint Templates are like a fine comb. They get different strands of thought together.

Bar Graph With Person01 Success PowerPoint Templates And PowerPoint Themes 0512
Microsoft Powerpoint Templates and Background with success-Bar Graph With Person01 Success PowerPoint Templates And PowerPoint Themes 0512-These PowerPoint designs and slide layouts can be used for themes relating to -Success, business, shapes, marketing, sales, finance, shapes Play by the book with our Bar Graph With Person01 Success PowerPoint Templates And PowerPoint Themes 0512. They advocate a fair and square approach.
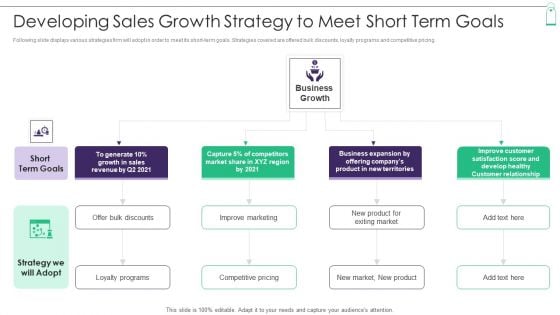
New Product Sales Strategy And Marketing Developing Sales Growth Strategy To Meet Portrait PDF
Following slide displays various strategies firm will adopt in order to meet its short-term goals. Strategies covered are offered bulk discounts, loyalty programs and competitive pricing.Presenting New Product Sales Strategy And Marketing Developing Sales Growth Strategy To Meet Portrait PDF to provide visual cues and insights. Share and navigate important information on four stages that need your due attention. This template can be used to pitch topics like Loyalty Programs, Improve Marketing, Competitive Pricing. In addtion, this PPT design contains high resolution images, graphics, etc, that are easily editable and available for immediate download.
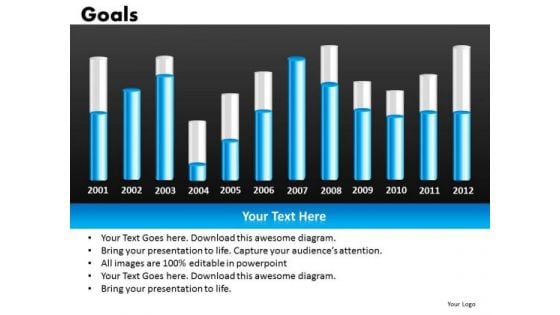
Goals Graphs PowerPoint Slides
Goals Graphs PowerPoint Slides-These high quality, editable pre-designed powerpoint slides have been carefully created by our professional team to help you impress your audience. Each graphic in every slide is vector based and is 100% editable in powerpoint. Each and every property of any slide - color, size, shading etc can be modified to build an effective powerpoint presentation. Use these slides to convey complex business concepts in a simplified manner. Any text can be entered at any point in the powerpoint slide. Simply DOWNLOAD, TYPE and PRESENT! Our Goals Graphs PowerPoint Slides give you a ready to use structure. You won't need to fabricate anything.
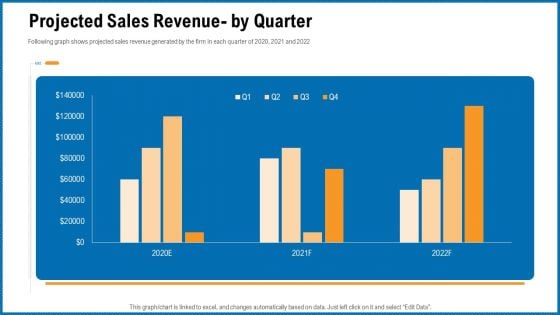
Building Corporate Monopoly Projected Sales Revenue By Quarter Summary PDF
Following graph shows projected sales revenue generated by the firm in each quarter of 2020, 2021 and 2022. Deliver an awe inspiring pitch with this creative building corporate monopoly projected sales revenue by quarter summary pdf bundle. Topics like projected sales revenue by quarter can be discussed with this completely editable template. It is available for immediate download depending on the needs and requirements of the user.

Profits Bar Chart Sales PowerPoint Templates And PowerPoint Themes 0612
Profits Bar Chart Sales PowerPoint Templates And PowerPoint Themes PPT Slides-Microsoft Powerpoint Templates and Background with graph with arrow Let our Profits Bar Chart Sales PowerPoint Templates And PowerPoint Themes 0612 do your errands. They will bring in the goodies for you.
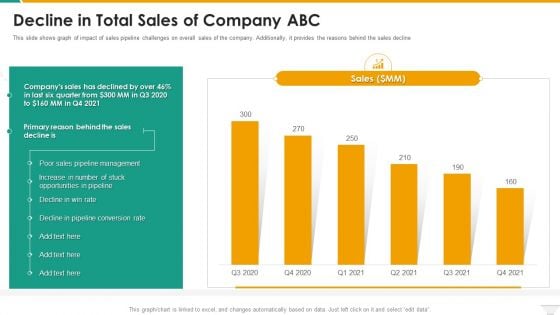
Decline In Total Sales Of Company Abc Slides PDF
This slide shows graph of impact of sales pipeline challenges on overall sales of the company. Additionally, it provides the reasons behind the sales decline Deliver and pitch your topic in the best possible manner with this Decline In Total Sales Of Company Abc Slides PDF. Use them to share invaluable insights on Management, Sales, Opportunities and impress your audience. This template can be altered and modified as per your expectations. So, grab it now.
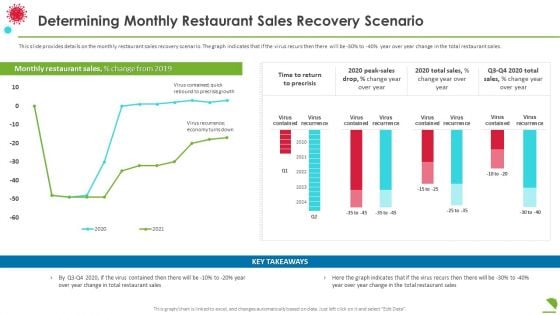
Determining Monthly Restaurant Sales Recovery Scenario Professional PDF
This slide provides details on the monthly restaurant sales recovery scenario. The graph indicates that if the virus recurs then there will be 30percentage to 40 percentage year over year change in the total restaurant sales. Deliver an awe inspiring pitch with this creative determining monthly restaurant sales recovery scenario professional pdf bundle. Topics like determining monthly restaurant sales recovery scenario can be discussed with this completely editable template. It is available for immediate download depending on the needs and requirements of the user.
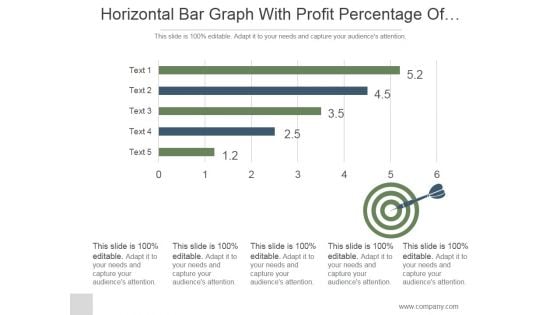
Horizontal Bar Graph With Profit Percentage Of Company Ppt PowerPoint Presentation Shapes
This is a horizontal bar graph with profit percentage of company ppt powerpoint presentation shapes. This is a five stage process. The stages in this process are business, strategy, marketing, analysis, slide bar, target.
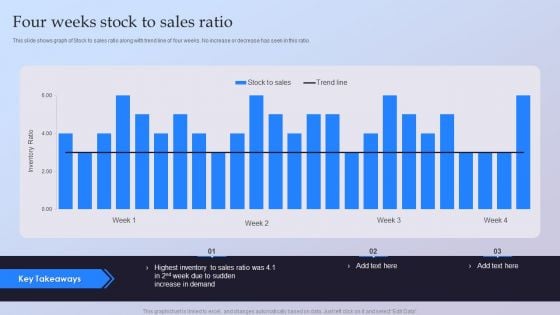
Four Weeks Stock To Sales Ratio Ppt Ideas Guide PDF
This slide shows graph of Stock to sales ratio along with trend line of four weeks. No increase or decrease has seen in this ratio. Pitch your topic with ease and precision using this Four Weeks Stock To Sales Ratio Ppt Ideas Guide PDF. This layout presents information on Highest Inventory, Sales Ratio, Increase Demand. It is also available for immediate download and adjustment. So, changes can be made in the color, design, graphics or any other component to create a unique layout.
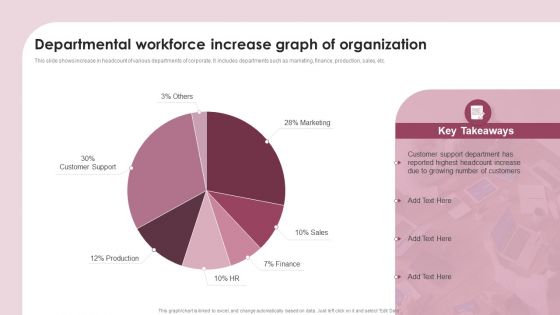
Departmental Workforce Increase Graph Of Organization Ppt Infographics Graphics Pictures PDF
This slide shows increase in headcount of various departments of corporate. It includes departments such as marketing, finance, production, sales, etc. Showcasing this set of slides titled Departmental Workforce Increase Graph Of Organization Ppt Infographics Graphics Pictures PDF. The topics addressed in these templates are Customer Support Department, Number Customers, Highest Headcount. All the content presented in this PPT design is completely editable. Download it and make adjustments in color, background, font etc. as per your unique business setting.
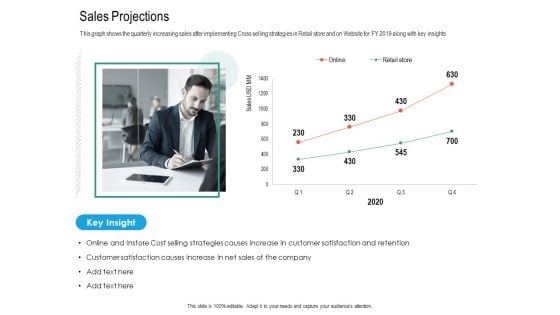
Upselling Strategies For Business Sales Projections Template PDF
This graph shows the quarterly increasing sales after implementing Cross selling strategies in Retail store and on Website for FY 2019 along with key insights. Deliver an awe inspiring pitch with this creative upselling strategies for business sales projections template pdf bundle. Topics like cost selling, strategies, retention, sales can be discussed with this completely editable template. It is available for immediate download depending on the needs and requirements of the user.
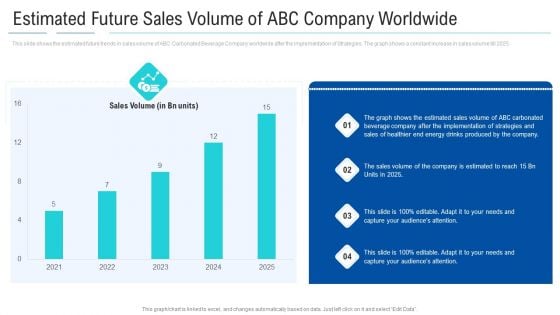
Estimated Future Sales Volume Of ABC Company Worldwide Clipart PDF
This slide shows the estimated future trends in sales volume of ABC Carbonated Beverage Company worldwide after the implementation of Strategies. The graph shows a constant increase in sales volume till 2025. Deliver an awe-inspiring pitch with this creative estimated future sales volume of abc company worldwide clipart pdf. bundle. Topics like estimated future sales volume of abc company worldwide can be discussed with this completely editable template. It is available for immediate download depending on the needs and requirements of the user.

Sales Result Evaluation Between Company Different Product Microsoft PDF
This slide signifies outlining and executing strategies on sales result comparison using bar graph. It includes various plans that are being implemented by the company for increase product growth. Showcasing this set of slides titled Sales Result Evaluation Between Company Different Product Microsoft PDF. The topics addressed in these templates are Door Marketing, Provide Coupons Rewards, Increase Quality Product. All the content presented in this PPT design is completely editable. Download it and make adjustments in color, background, font etc. as per your unique business setting.
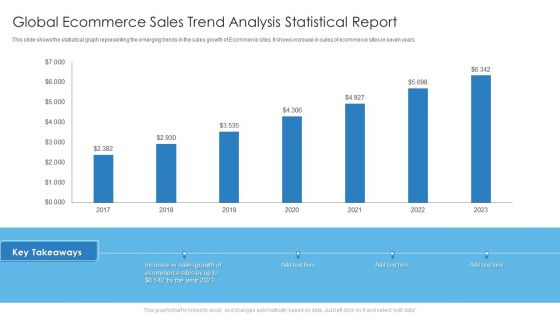
Global Ecommerce Sales Trend Analysis Statistical Report Mockup PDF
This slide shows the statistical graph representing the emerging trends in the sales growth of Ecommerce sites. It shows increase in sales of ecommerce sites in seven years. Deliver and pitch your topic in the best possible manner with this Global Ecommerce Sales Trend Analysis Statistical Report Mockup PDF. Use them to share invaluable insights on Sales Growth, Ecommerce Sites and impress your audience. This template can be altered and modified as per your expectations. So, grab it now.
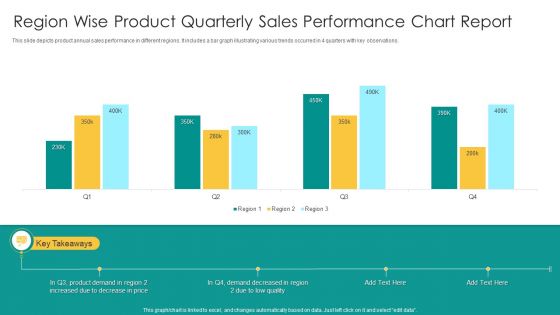
Region Wise Product Quarterly Sales Performance Chart Report Topics PDF
This slide depicts product annual sales performance in different regions. It includes a bar graph illustrating various trends occurred in 4 quarters with key observations. Showcasing this set of slides titled Region Wise Product Quarterly Sales Performance Chart Report Topics PDF. The topics addressed in these templates are Product Demand, Price, Low Quality. All the content presented in this PPT design is completely editable. Download it and make adjustments in color, background, font etc. as per your unique business setting.

Analyzing Companys Current Sales Revenue And Customer Base Graphics PDF
The following slide highlights the current scenario of company sales and customer retention rates. It illustrates graphs of last 3 years which shows company sales and net profit margins are declining and existing customer are leaving the company.Here you can discover an assortment of the finest PowerPoint and Google Slides templates. With these templates, you can create presentations for a variety of purposes while simultaneously providing your audience with an eye-catching visual experience. Download Analyzing Companys Current Sales Revenue And Customer Base Graphics PDF to deliver an impeccable presentation. These templates will make your job of preparing presentations much quicker, yet still, maintain a high level of quality. Slidegeeks has experienced researchers who prepare these templates and write high-quality content for you. Later on, you can personalize the content by editing the Analyzing Companys Current Sales Revenue And Customer Base Graphics PDF.
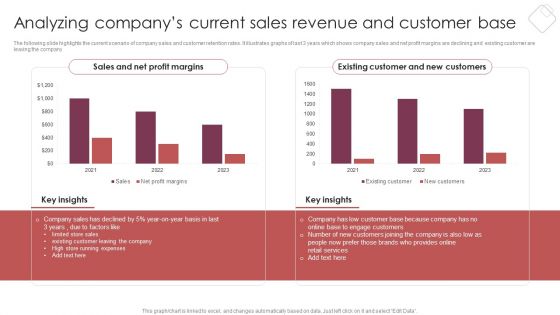
E Commerce Marketing Techniques To Boost Sales Analyzing Companys Current Sales Revenue And Customer Base Formats PDF
The following slide highlights the current scenario of company sales and customer retention rates. It illustrates graphs of last 3 years which shows company sales and net profit margins are declining and existing customer are leaving the company. Want to ace your presentation in front of a live audience. Our E Commerce Marketing Techniques To Boost Sales Analyzing Companys Current Sales Revenue And Customer Base Formats PDF can help you do that by engaging all the users towards you.. Slidegeeks experts have put their efforts and expertise into creating these impeccable powerpoint presentations so that you can communicate your ideas clearly. Moreover, all the templates are customizable, and easy-to-edit and downloadable. Use these for both personal and commercial use.
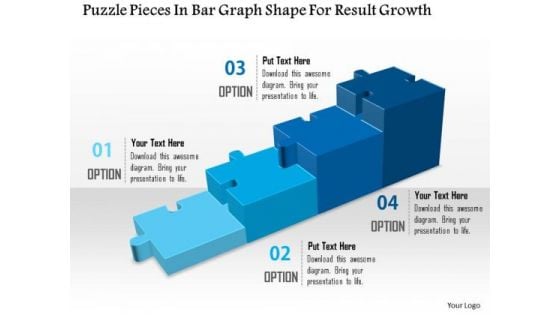
Puzzle Pieces In Bar Graph Shape For Result Growth Presentation Template
Define the growth factor for any business and sales activity with this unique PPT. this PPT has been crafted with graphic of bar graph made with puzzle pieces. Use this PPT for your business and sales presentations.
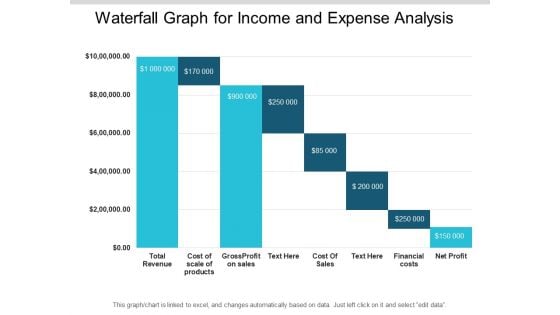
Waterfall Graph For Income And Expense Analysis Ppt PowerPoint Presentation File Deck
This is a waterfall graph for income and expense analysis ppt powerpoint presentation file deck. This is a eight stage process. The stages in this process are sales waterfall, waterfall chart, business.
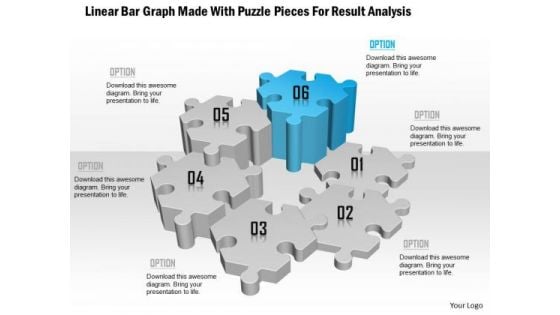
Linear Bar Graph Made With Puzzle Pieces For Result Analysis Presentation Template
This Power Point template has been used to show concept of result analysis. This PPT contains the graphic of linear bar graph made with puzzle. Use this PPT for business and sales presentations.
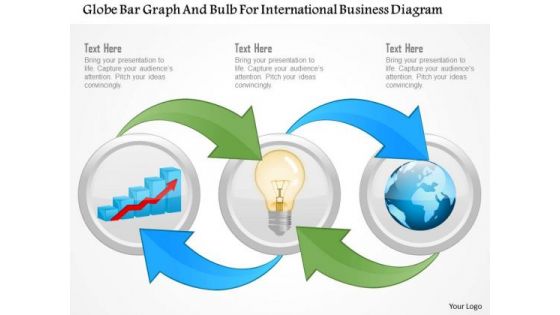
Business Diagram Globe Bar Graph And Bulb For International Business Diagram Presentation Template
Graphic of globe and bar graph with bulb has been used to craft this power point template diagram. This PPT diagram contains the concept of international business growth analysis. Use this PPT for global business and sales related presentations.
Profit Margin Growth Graph With Percentage Ratio Ppt PowerPoint Presentation Professional Icon PDF
Showcasing this set of slides titled profit margin growth graph with percentage ratio ppt powerpoint presentation professional icon pdf. The topics addressed in these templates are profit margin per sale, target per sales rep, 2017 to 2027. All the content presented in this PPT design is completely editable. Download it and make adjustments in color, background, font etc. as per your unique business setting.
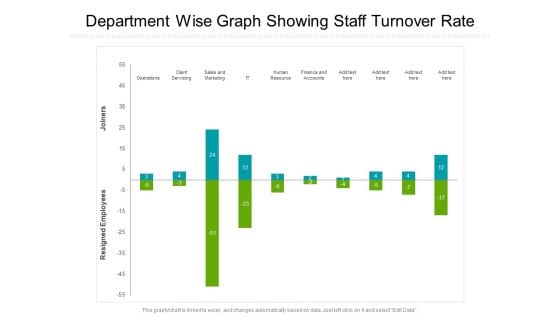
Department Wise Graph Showing Staff Turnover Rate Ppt PowerPoint Presentation Gallery Outfit PDF
Presenting this set of slides with name department wise graph showing staff turnover rate ppt powerpoint presentation gallery outfit pdf. The topics discussed in these slides are operations, client servicing, sales and marketing, it, human resource, finance and accounts. This is a completely editable PowerPoint presentation and is available for immediate download. Download now and impress your audience.
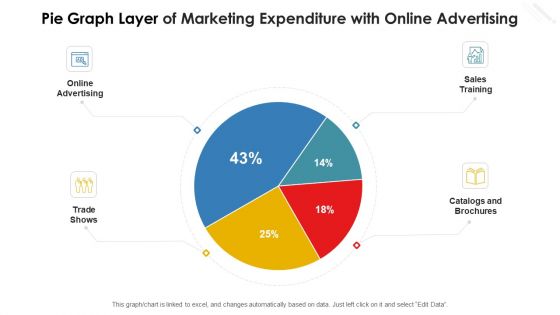
Pie Graph Layer Of Marketing Expenditure With Online Advertising Graphics PDF
Showcasing this set of slides titled pie graph layer of marketing expenditure with online advertising graphics pdf. The topics addressed in these templates are online advertising, trade shows, catalogs and brochures, sales training. All the content presented in this PPT design is completely editable. Download it and make adjustments in color, background, font etc. as per your unique business setting.

Graph Showing Revenue And Profit From Operations Ppt PowerPoint Presentation File Information PDF
Presenting this set of slides with name graph showing revenue and profit from operations ppt powerpoint presentation file information pdf. The topics discussed in these slides are gross revenue, gross profit, sales cost. This is a completely editable PowerPoint presentation and is available for immediate download. Download now and impress your audience.
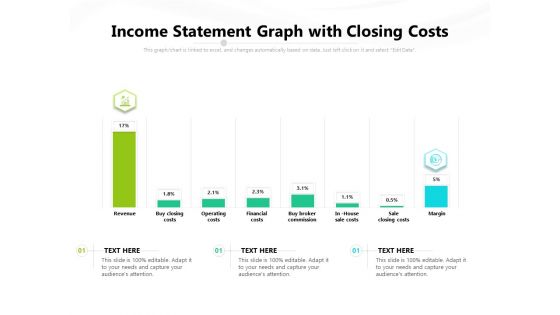
Income Statement Graph With Closing Costs Ppt PowerPoint Presentation Gallery Example Topics PDF
Presenting this set of slides with name income statement graph with closing costs ppt powerpoint presentation gallery example topics pdf. The topics discussed in these slides are revenue, buy closing costs, operating costs, financial costs, buy broker commission, in house sale costs, sale closing costs, margin. This is a completely editable PowerPoint presentation and is available for immediate download. Download now and impress your audience.

Vertical Bar Graph Illustrating Employee In Various Facilities Ppt PowerPoint Presentation Gallery Background Image PDF
Persuade your audience using this vertical bar graph illustrating employee in various facilities ppt powerpoint presentation gallery background image pdf. This PPT design covers four stages, thus making it a great tool to use. It also caters to a variety of topics including warehouse, sales office, manufacturing unit. Download this PPT design now to present a convincing pitch that not only emphasizes the topic but also showcases your presentation skills.
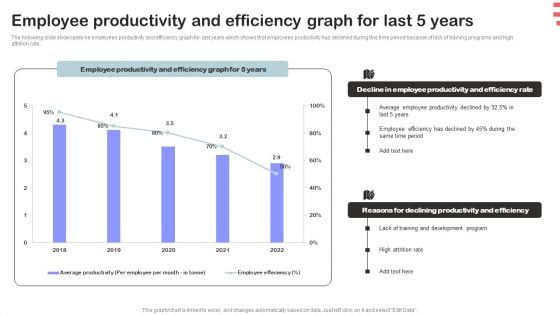
Corporate Training Program Employee Productivity And Efficiency Graph For Last 5 Years Elements PDF
The following slide showcases he employees productivity and efficiency graph for last years which shows that employees productivity has declined during this time period because of lack of training programs and high attrition rate. Make sure to capture your audiences attention in your business displays with our gratis customizable Corporate Training Program Employee Productivity And Efficiency Graph For Last 5 Years Elements PDF. These are great for business strategies, office conferences, capital raising or task suggestions. If you desire to acquire more customers for your tech business and ensure they stay satisfied, create your own sales presentation with these plain slides.
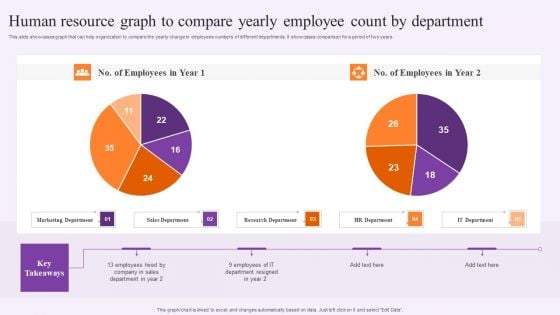
Human Resource Graph To Compare Yearly Employee Count By Department Professional PDF
This slide showcases graph that can help organization to compare the yearly change in employees numbers of different departments. It showcases comparison for a period of two years. Showcasing this set of slides titled Human Resource Graph To Compare Yearly Employee Count By Department Professional PDF. The topics addressed in these templates are Marketing Department, Sales Department, Research Department. All the content presented in this PPT design is completely editable. Download it and make adjustments in color, background, font etc. as per your unique business setting.
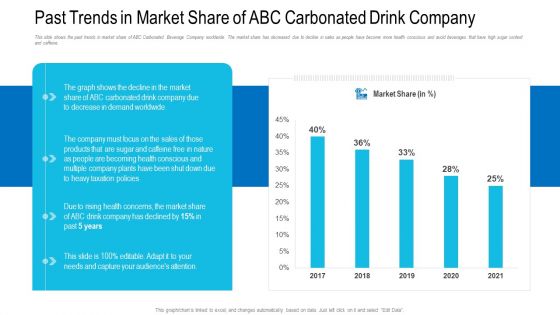
Past Trends In Market Share Of ABC Carbonated Drink Company Ppt Diagram Graph Charts PDF
This slide shows the past trends in market share of ABC Carbonated Beverage Company worldwide. The market share has decreased due to decline in sales as people have become more health conscious and avoid beverages that have high sugar content and caffeine. Deliver an awe inspiring pitch with this creative past trends in market share of abc carbonated drink company ppt diagram graph charts pdf bundle. Topics like past trends in market share of abc carbonated drink company can be discussed with this completely editable template. It is available for immediate download depending on the needs and requirements of the user.

Financial Planning And Examination Plan For Small And Large Enterprises Bar Graph Elements PDF
Slidegeeks is here to make your presentations a breeze with Financial Planning And Examination Plan For Small And Large Enterprises Bar Graph Elements PDF With our easy to use and customizable templates, you can focus on delivering your ideas rather than worrying about formatting. With a variety of designs to choose from, you are sure to find one that suits your needs. And with animations and unique photos, illustrations, and fonts, you can make your presentation pop. So whether you are giving a sales pitch or presenting to the board, make sure to check out Slidegeeks first.
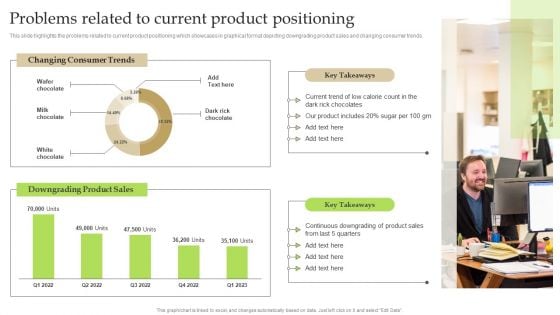
Problems Related To Current Product Positioning Ppt PowerPoint Presentation Diagram Graph Charts PDF
This slide highlights the problems related to current product positioning which showcases in graphical format depicting downgrading product sales and changing consumer trends. Do you have an important presentation coming up Are you looking for something that will make your presentation stand out from the rest Look no further than Problems Related To Current Product Positioning Ppt PowerPoint Presentation Diagram Graph Charts PDF. With our professional designs, you can trust that your presentation will pop and make delivering it a smooth process. And with Slidegeeks, you can trust that your presentation will be unique and memorable. So why wait Grab Problems Related To Current Product Positioning Ppt PowerPoint Presentation Diagram Graph Charts PDF today and make your presentation stand out from the rest
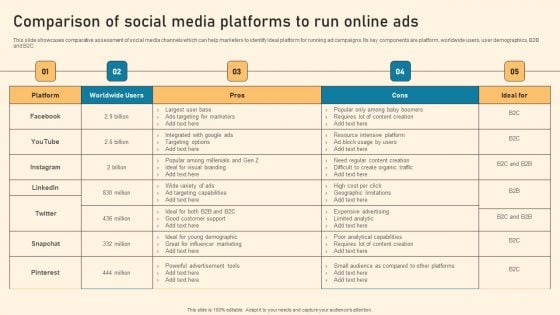
Comparison Of Social Media Platforms To Run Online Ads Ppt PowerPoint Presentation Diagram Graph Charts PDF
This slide showcases comparative assessment of social media channels which can help marketers to identify ideal platform for running ad campaigns. Its key components are platform, worldwide users, user demographics, B2B and B2C Slidegeeks is here to make your presentations a breeze with Comparison Of Social Media Platforms To Run Online Ads Ppt PowerPoint Presentation Diagram Graph Charts PDF With our easy to use and customizable templates, you can focus on delivering your ideas rather than worrying about formatting. With a variety of designs to choose from, you are sure to find one that suits your needs. And with animations and unique photos, illustrations, and fonts, you can make your presentation pop. So whether you are giving a sales pitch or presenting to the board, make sure to check out Slidegeeks first.
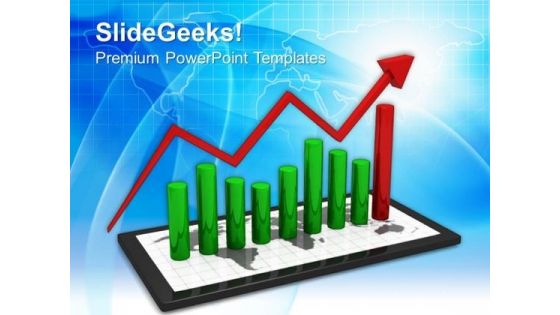
Tablet With Bar Graph Success PowerPoint Templates And PowerPoint Themes 1112
We present our Tablet With Bar Graph Success PowerPoint Templates And PowerPoint Themes 1112.Use our Business PowerPoint Templates because,Marketing Strategy Business Template:- Maximising sales of your product is the intended destination. Use our Marketing PowerPoint Templates because, The vision of being the market leader is clear to you. Use our Finance PowerPoint Templates because, Like your thoughts arrows are inherently precise and true. Use our Abstract PowerPoint Templates because,Explain the process by which you intend to right it. Use our Success PowerPoint Templates because, Expound on how you plan to gain their confidence and assure them of continued and consistent excellence in quality of service.Use these PowerPoint slides for presentations relating to Tablets with a bar graph Business Finance Marketing Abstract Success. The prominent colors used in the PowerPoint template are Red, Green, Black Establish control with our Tablet With Bar Graph Success PowerPoint Templates And PowerPoint Themes 1112. Let your thoughts take the reins.
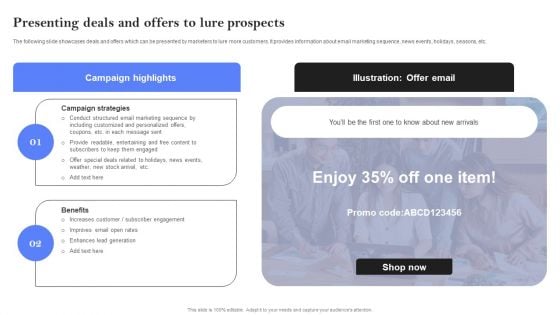
Presenting Deals And Offers To Lure Prospects Ppt PowerPoint Presentation Diagram Graph Charts PDF
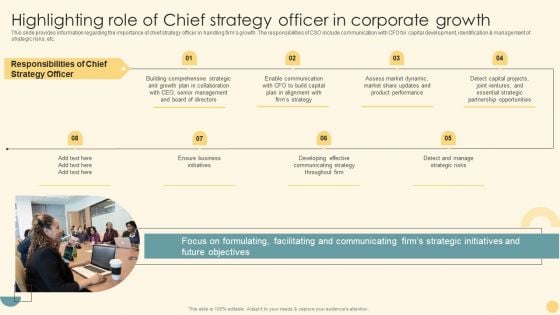
Highlighting Role Of Chief Strategy Officer In Corporate Growth Ppt PowerPoint Presentation Diagram Graph Charts PDF
This slide provides information regarding the importance of chief strategy officer in handling firms growth. The responsibilities of CSO include communication with CFO for capital development, identification and management of strategic risks, etc. Slidegeeks is here to make your presentations a breeze with Highlighting Role Of Chief Strategy Officer In Corporate Growth Ppt PowerPoint Presentation Diagram Graph Charts PDF With our easy to use and customizable templates, you can focus on delivering your ideas rather than worrying about formatting. With a variety of designs to choose from, you are sure to find one that suits your needs. And with animations and unique photos, illustrations, and fonts, you can make your presentation pop. So whether you are giving a sales pitch or presenting to the board, make sure to check out Slidegeeks first.
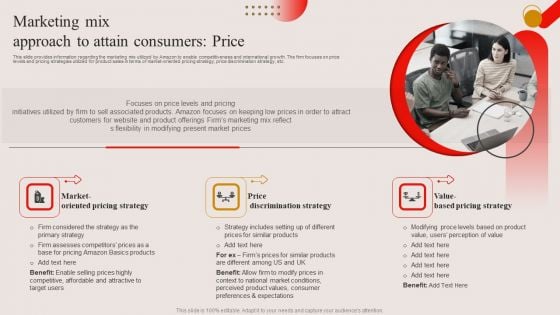
Marketing Mix Approach To Attain Consumers Price Ppt PowerPoint Presentation Diagram Graph Charts PDF
This slide provides information regarding the marketing mix utilized by Amazon to enable competitiveness and international growth. The firm focuses on price levels and pricing strategies utilized for product sales in terms of market-oriented pricing strategy, price discrimination strategy, etc. This Marketing Mix Approach To Attain Consumers Price Ppt PowerPoint Presentation Diagram Graph Charts PDF from Slidegeeks makes it easy to present information on your topic with precision. It provides customization options, so you can make changes to the colors, design, graphics, or any other component to create a unique layout. It is also available for immediate download, so you can begin using it right away. Slidegeeks has done good research to ensure that you have everything you need to make your presentation stand out. Make a name out there for a brilliant performance.
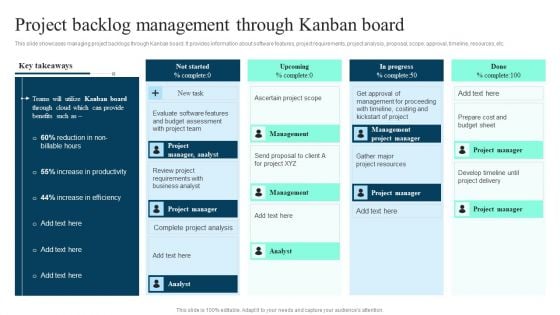
Project Backlog Management Through Kanban Board Ppt PowerPoint Presentation Diagram Graph Charts PDF
This slide showcases managing project backlogs through Kanban board. It provides information about software features, project requirements, project analysis, proposal, scope, approval, timeline, resources, etc. Slidegeeks is here to make your presentations a breeze with Project Backlog Management Through Kanban Board Ppt PowerPoint Presentation Diagram Graph Charts PDF With our easy to use and customizable templates, you can focus on delivering your ideas rather than worrying about formatting. With a variety of designs to choose from, you are sure to find one that suits your needs. And with animations and unique photos, illustrations, and fonts, you can make your presentation pop. So whether you are giving a sales pitch or presenting to the board, make sure to check out Slidegeeks first.
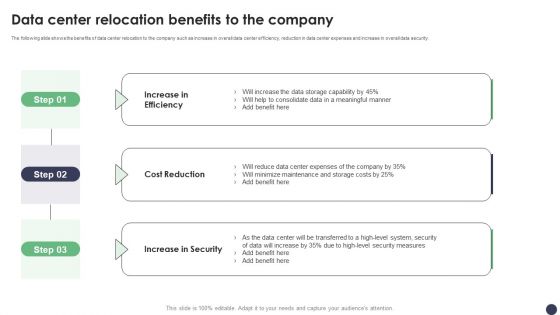
Data Center Relocation Benefits To The Company Ppt PowerPoint Presentation Diagram Graph Charts PDF
The following slide shows the benefits of data center relocation to the company such as increase in overall data center efficiency, reduction in data center expenses and increase in overall data security. Slidegeeks is here to make your presentations a breeze with Data Center Relocation Benefits To The Company Ppt PowerPoint Presentation Diagram Graph Charts PDF With our easy to use and customizable templates, you can focus on delivering your ideas rather than worrying about formatting. With a variety of designs to choose from, you are sure to find one that suits your needs. And with animations and unique photos, illustrations, and fonts, you can make your presentation pop. So whether you are giving a sales pitch or presenting to the board, make sure to check out Slidegeeks first.
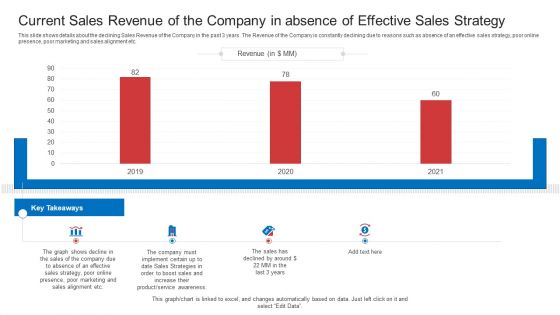
Strategic Plan To Increase Sales Volume And Revenue Current Sales Revenue Of The Company In Absence Of Effective Sales Strategy Diagrams PDF
This slide shows details about the declining Sales Revenue of the Company in the past 3 years. The Revenue of the Company is constantly declining due to reasons such as absence of an effective sales strategy, poor online presence, poor marketing and sales alignment etc. Deliver and pitch your topic in the best possible manner with this strategic plan to increase sales volume and revenue current sales revenue of the company in absence of effective sales strategy diagrams pdf. Use them to share invaluable insights on marketing, sales, strategy, effective, awareness and impress your audience. This template can be altered and modified as per your expectations. So, grab it now.

Strategic Plan To Increase Sales Volume And Revenue Current Length Of Sales Cycle In Absence Of Effective Sales Strategy Ideas PDF
This slide shows details about the increasing Sales Cycle Length of the Company in the past 3 years. The reasons for increasing Sales cycle Length are poor lead generation, poor sales process optimization, using cold calling technique most of the times etc. Deliver an awe inspiring pitch with this creative strategic plan to increase sales volume and revenue current length of sales cycle in absence of effective sales strategy ideas pdf bundle. Topics like technique, sales, process, optimization can be discussed with this completely editable template. It is available for immediate download depending on the needs and requirements of the user.
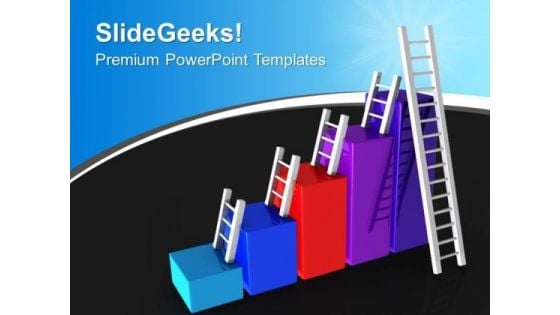
Colorful Bar Graph With Ladders PowerPoint Templates Ppt Backgrounds For Slides 1212
We present our Colorful Bar Graph With Ladders PowerPoint Templates PPT Backgrounds For Slides 1212.Use our Ladders PowerPoint Templates because this slide brings grey areas to the table and explain in detail you assessment of the need for care to ensure continued smooth progress. Download our Success PowerPoint Templates because iT outlines the entire thought process for the benefit of others. Tell it to the world with your characteristic aplomb. Download our Business PowerPoint Templates because the majestic tiger lord of all it surveys.It exudes power even when it is in repose. Download our Finance PowerPoint Templates because you have configured your targets, identified your goals as per priority and importance. Download our Marketing PowerPoint Templates because generation of sales is the core of any business.Use these PowerPoint slides for presentations relating to Ladder of success graph, business, ladders, success, finance, marketing . The prominent colors used in the PowerPoint template are Purple, Red, Blue. Use our Colorful Bar Graph With Ladders PowerPoint Templates PPT Backgrounds For Slides 1212 are aesthetically designed to attract attention. We guarantee that they will grab all the eyeballs you need. Presenters tell us our finance PowerPoint templates and PPT Slides are Zippy. People tell us our Colorful Bar Graph With Ladders PowerPoint Templates PPT Backgrounds For Slides 1212 are Delightful. You can be sure our graph PowerPoint templates and PPT Slides are Nice. Professionals tell us our Colorful Bar Graph With Ladders PowerPoint Templates PPT Backgrounds For Slides 1212 are Multicolored. Professionals tell us our business PowerPoint templates and PPT Slides are Chic. Add to your exhibition with our Colorful Bar Graph With Ladders PowerPoint Templates Ppt Backgrounds For Slides 1212. Your audience will find it cool.

Bar Graph Showing Growth Marketing PowerPoint Templates Ppt Backgrounds For Slides 1212
We present our Bar Graph Showing Growth Marketing PowerPoint Templates PPT Backgrounds For Slides 1212.Present our Arrows PowerPoint Templates because strengthen your relationship with your present customers and likely future ones as the occasion has an intrinsic business potential. Download and present our Business PowerPoint Templates because maximising sales of your product is the intended destination. Present our Marketing PowerPoint Templates because The marketplace is the merger of your dreams and your ability. Use our Finance PowerPoint Templates because there are a bunch of ideas brewing in your head which give you the heady taste of success. Download our Success PowerPoint Templates because the success of your venture depends on the performance of every team member.Use these PowerPoint slides for presentations relating to Graph showing rise in profits or earnings, Arrows, Business, Marketing, Finance, Success. The prominent colors used in the PowerPoint template are Red, Green, Gray. Professionals tell us our Bar Graph Showing Growth Marketing PowerPoint Templates PPT Backgrounds For Slides 1212 are Elegant. Use our profits PowerPoint templates and PPT Slides are Radiant. We assure you our Bar Graph Showing Growth Marketing PowerPoint Templates PPT Backgrounds For Slides 1212 are designed to make your presentations professional. We assure you our rise PowerPoint templates and PPT Slides are Sparkling. Presenters tell us our Bar Graph Showing Growth Marketing PowerPoint Templates PPT Backgrounds For Slides 1212 are topically designed to provide an attractive backdrop to any subject. PowerPoint presentation experts tell us our Arrows PowerPoint templates and PPT Slides are Festive. Try our Bar Graph Showing Growth Marketing PowerPoint Templates Ppt Backgrounds For Slides 1212 and get bitten by the bug. You will cease to consider anything else.
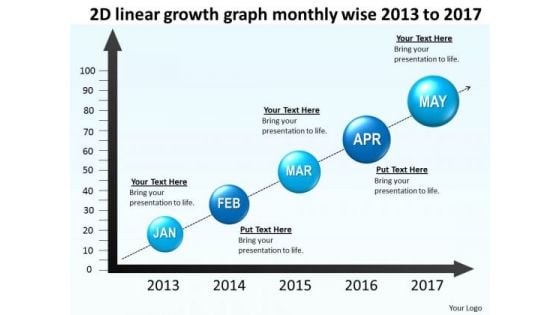
2d Linear Growth Graph Monthly Wise 2013 To 2017 PowerPoint Templates Ppt Slides Graphics
We present our 2D linear growth graph monthly wise 2013 to 2017 PowerPoint Templates PPT Slides Graphics.Use our Marketing PowerPoint Templates because customer satisfaction is a mantra of the marketplace. Building a loyal client base is an essential element of your business. Download and present our Timelines PowerPoint Templates because this diagram helps you to explain your strategy to co-ordinate activities of these seperate groups. Download our Business PowerPoint Templates because generation of sales is the core of any business. Use our Arrows PowerPoint Templates because You have found the one missing link in the picture. That one strand that will bring together the entire edifice. Put it out there for all to see. Emphasise the value of its contribution in propelling the venture forward. Use our Time planning PowerPoint Templates because it Draws the universal impact to highlight the similarities with your organizational structure and plans.Use these PowerPoint slides for presentations relating to Art, Background, Button, Call, City, Colorful, Concept, Country, Destination, Editable, Flag, Fuel, Geography, Graphic, Home, Icon, Illustration, Journey, Land, Locate, Location, Macro, Map, Mapping, Mark, Navigate, Needle, Petrol, Pin, Pinpoint, Place, Pointing, Pump, Push, Pushpin, Restaurant, Road, Roadmap, Service, Set, Shiny, Space, Symbol, Town, Travel, Trip. The prominent colors used in the PowerPoint template are Blue, Black, Blue light. PowerPoint presentation experts tell us our 2D linear growth graph monthly wise 2013 to 2017 PowerPoint Templates PPT Slides Graphics are Dynamic. Customers tell us our City PowerPoint templates and PPT Slides are specially created by a professional team with vast experience. They diligently strive to come up with the right vehicle for your brilliant Ideas. Customers tell us our 2D linear growth graph monthly wise 2013 to 2017 PowerPoint Templates PPT Slides Graphics are Splendid. Customers tell us our Button PowerPoint templates and PPT Slides are Functional. PowerPoint presentation experts tell us our 2D linear growth graph monthly wise 2013 to 2017 PowerPoint Templates PPT Slides Graphics help you meet deadlines which are an element of today's workplace. Just browse and pick the slides that appeal to your intuitive senses. People tell us our Destination PowerPoint templates and PPT Slides effectively help you save your valuable time. Make a fancy impression with our 2d Linear Growth Graph Monthly Wise 2013 To 2017 PowerPoint Templates Ppt Slides Graphics. You will be at the top of your game.

Business Revenue Bar Graph With Business Operational Expenditure Details Summary PDF
This slide represents business revenue bar graph with OPEX details which can be referred by companies to earn more revenue by controlling expenditures. It also provides information about marketing and sales, research and development, administration, total revenue, etc. Pitch your topic with ease and precision using this Business Revenue Bar Graph With Business Operational Expenditure Details Summary PDF. This layout presents information on Cost Of Marketing, Sales, Highest Amount. It is also available for immediate download and adjustment. So, changes can be made in the color, design, graphics or any other component to create a unique layout.
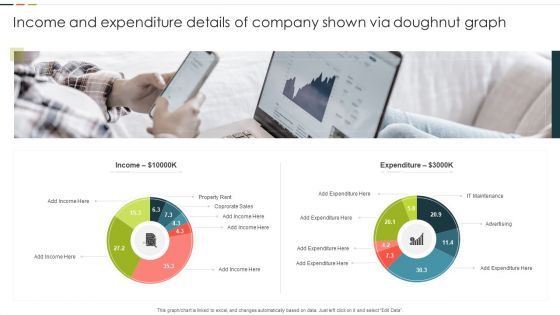
Income And Expenditure Details Of Company Shown Via Doughnut Graph Graphics PDF
This graph or chart is linked to excel, and changes automatically based on data. Just left click on it and select Edit Data. Pitch your topic with ease and precision using this Income And Expenditure Details Of Company Shown Via Doughnut Graph Graphics PDF. This layout presents information on Property Rent, Corporate Sales, Expenditure. It is also available for immediate download and adjustment. So, changes can be made in the color, design, graphics or any other component to create a unique layout.


 Continue with Email

 Home
Home


