Sales Kpi
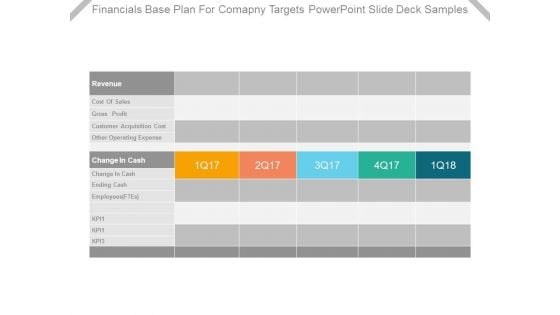
Financials Base Plan For Company Targets Powerpoint Slide Deck Samples
This is a financials base plan for company targets powerpoint slide deck samples. This is a five stage process. The stages in this process are revenue, cost of sales, gross profit, customer acquisition cost, other operating expense, change in cash, change in cash, ending cash, employees ftes, kpi.
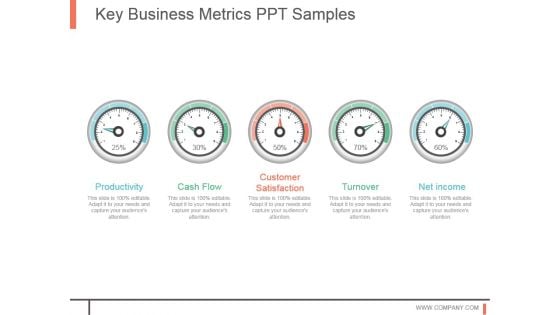
Key Business Metrics Ppt Samples
This is a key business metrics ppt samples. This is a five stage process. The stages in this process are productivity, cash flow, customer satisfaction, turnover, net income.
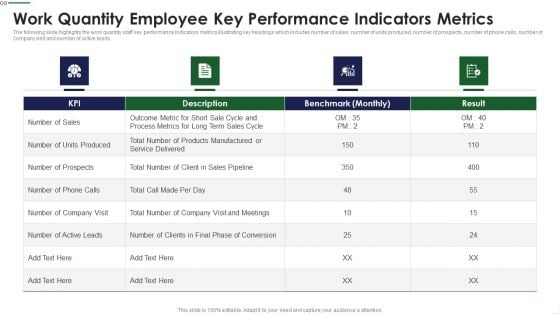
Work Quantity Employee Key Performance Indicators Metrics Summary PDF
The following slide highlights the work quantity staff key performance Indicators metrics illustrating key headings which includes number of sales, number of units produced, number of prospects, number of phone calls, number of company visit and number of active leads Deliver and pitch your topic in the best possible manner with this Work Quantity Employee Key Performance Indicators Metrics Summary PDF Use them to share invaluable insights on Outcome Metric, Process Metrics, Benchmark and impress your audience. This template can be altered and modified as per your expectations. So, grab it now.
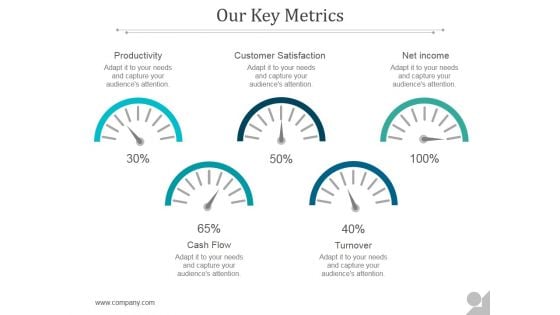
Our Key Metrics Ppt PowerPoint Presentation Examples
This is a our key metrics ppt powerpoint presentation examples. This is a five stage process. The stages in this process are productivity, customer satisfaction, net income, cash flow, turnover.
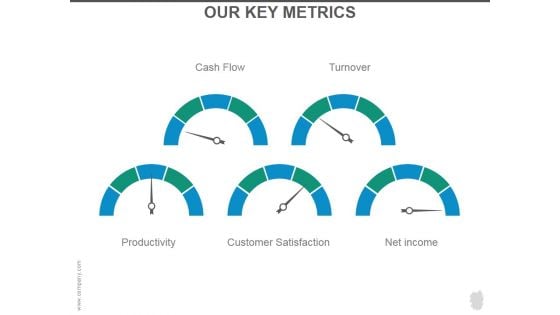
Our Key Metrics Ppt PowerPoint Presentation Portfolio
This is a our key metrics ppt powerpoint presentation portfolio. This is a five stage process. The stages in this process are cash flow, turnover, productivity, customer satisfaction, net income.
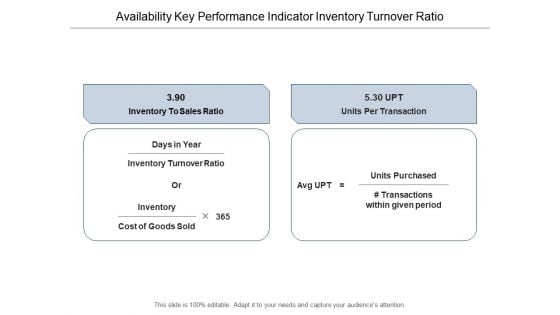
Availability Key Performance Indicator Inventory Turnover Ratio Ppt Powerpoint Presentation Layouts Graphics Download
This is a availability key performance indicator inventory turnover ratio ppt powerpoint presentation layouts graphics download. This is a two stage process. The stages in this process are availability kpi, availability dashboard, availability metrics.
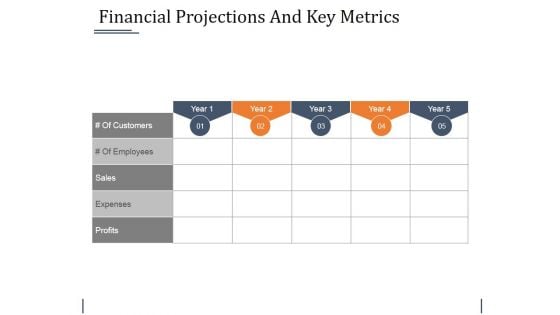
Financial Projections And Key Metrics Ppt PowerPoint Presentation Layouts Objects
This is a financial projections and key metrics ppt powerpoint presentation layouts objects. This is a five stage process. The stages in this process are sales, expenses, profits.
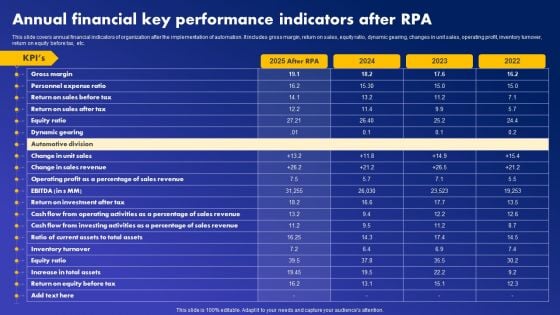
Annual Financial Key Performance Indicators After RPA Guidelines PDF
This slide covers annual financial indicators of organization after the implementation of automation. It includes gross margin, return on sales, equity ratio, dynamic gearing, changes in unit sales, operating profit, inventory turnover, return on equity before tax, etc. Create an editable Annual Financial Key Performance Indicators After RPA Guidelines PDF that communicates your idea and engages your audience. Whether you are presenting a business or an educational presentation, pre-designed presentation templates help save time. Annual Financial Key Performance Indicators After RPA Guidelines PDF is highly customizable and very easy to edit, covering many different styles from creative to business presentations. Slidegeeks has creative team members who have crafted amazing templates. So, go and get them without any delay.
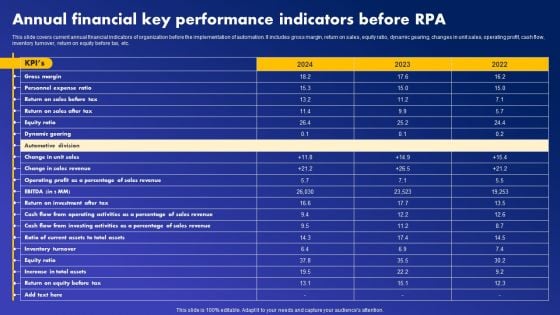
Annual Financial Key Performance Indicators Before RPA Download PDF
This slide covers current annual financial indicators of organization before the implementation of automation. It includes gross margin, return on sales, equity ratio, dynamic gearing, changes in unit sales, operating profit, cash flow, inventory turnover, return on equity before tax, etc. Slidegeeks is one of the best resources for PowerPoint templates. You can download easily and regulate Annual Financial Key Performance Indicators Before RPA Download PDF for your personal presentations from our wonderful collection. A few clicks is all it takes to discover and get the most relevant and appropriate templates. Use our Templates to add a unique zing and appeal to your presentation and meetings. All the slides are easy to edit and you can use them even for advertisement purposes.
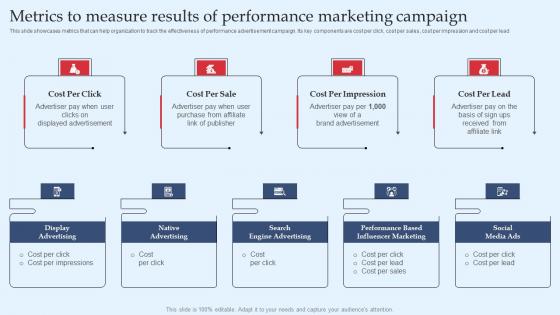
Strategic Performance Marketing Campaign Metrics To Measure Results Of Performance Themes Pdf
This slide showcases metrics that can help organization to track the effectiveness of performance advertisement campaign. Its key components are cost per click, cost per sales, cost per impression and cost per lead. Retrieve professionally designed Strategic Performance Marketing Campaign Metrics To Measure Results Of Performance Themes Pdf to effectively convey your message and captivate your listeners. Save time by selecting pre-made slideshows that are appropriate for various topics, from business to educational purposes. These themes come in many different styles, from creative to corporate, and all of them are easily adjustable and can be edited quickly. Access them as PowerPoint templates or as Google Slides themes. You do not have to go on a hunt for the perfect presentation because Slidegeeks got you covered from everywhere. This slide showcases metrics that can help organization to track the effectiveness of performance advertisement campaign. Its key components are cost per click, cost per sales, cost per impression and cost per lead.
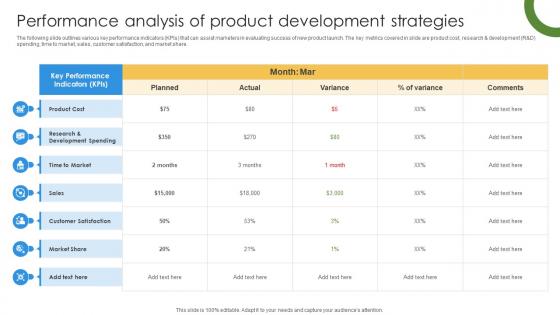
Marketing Growth Strategy To Strengthen Brand Performance Analysis Of Product Strategy SS V
The following slide outlines various key performance indicators KPIs that can assist marketers in evaluating success of new product launch. The key metrics covered in slide are product cost, research and development R and D spending, time to market, sales, customer satisfaction, and market share. If your project calls for a presentation, then Slidegeeks is your go-to partner because we have professionally designed, easy-to-edit templates that are perfect for any presentation. After downloading, you can easily edit Marketing Growth Strategy To Strengthen Brand Performance Analysis Of Product Strategy SS V and make the changes accordingly. You can rearrange slides or fill them with different images. Check out all the handy templates The following slide outlines various key performance indicators KPIs that can assist marketers in evaluating success of new product launch. The key metrics covered in slide are product cost, research and development R and D spending, time to market, sales, customer satisfaction, and market share.
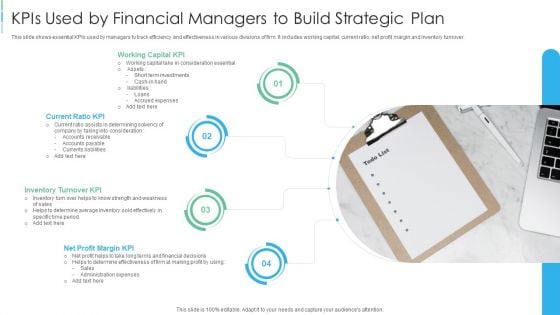
Kpis Used By Financial Managers To Build Strategic Plan Diagrams PDF
This slide shows essential KPIs used by managers to track efficiency and effectiveness in various divisions of firm. It includes working capital, current ratio, net profit margin and inventory turnover.Presenting Kpis Used By Financial Managers To Build Strategic Plan Diagrams PDF to dispense important information. This template comprises four stages. It also presents valuable insights into the topics including Working Capital KPI, Current Ratio KPI, Inventory Turnover KPI. This is a completely customizable PowerPoint theme that can be put to use immediately. So, download it and address the topic impactfully.
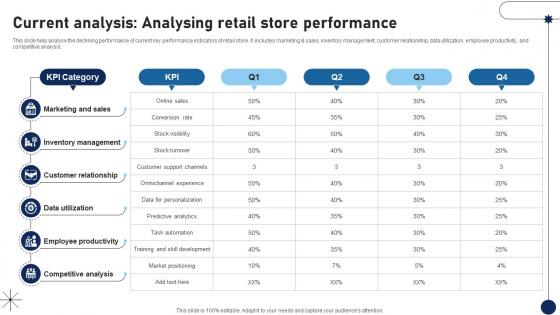
Current Analysis Analysing Retail Store Performance DT SS V
This slide help analyse the declining performance of current key performance indicators of retail store. It includes marketing and sales, inventory management, customer relationship, data utilization, employee productivity, and competitive analysis.Whether you have daily or monthly meetings, a brilliant presentation is necessary. Current Analysis Analysing Retail Store Performance DT SS V can be your best option for delivering a presentation. Represent everything in detail using Current Analysis Analysing Retail Store Performance DT SS V and make yourself stand out in meetings. The template is versatile and follows a structure that will cater to your requirements. All the templates prepared by Slidegeeks are easy to download and edit. Our research experts have taken care of the corporate themes as well. So, give it a try and see the results. This slide help analyse the declining performance of current key performance indicators of retail store. It includes marketing and sales, inventory management, customer relationship, data utilization, employee productivity, and competitive analysis.
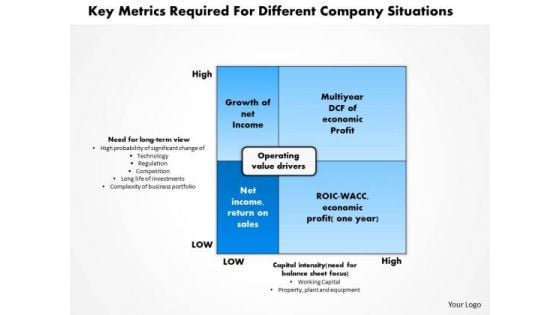
Business Framework Key Metrics Required For Different Company Situations PowerPoint Presentation
This diagram has been designed with framework of key metrics required for different company situations. This diagram contains rectangle of operating value drivers with four sections inside it representing terms like growth of net Income, multiyear DCF of economic profit, net income, return on sales, ROIC-WACC, and economic profit. Use this as a major element in streamlining any business process.

Our Performance Indicators Powerpoint Themes
This is a our performance indicators powerpoint themes. This is a five stage process. The stages in this process are cash flow, turnover, productivity, customer satisfaction, net income.
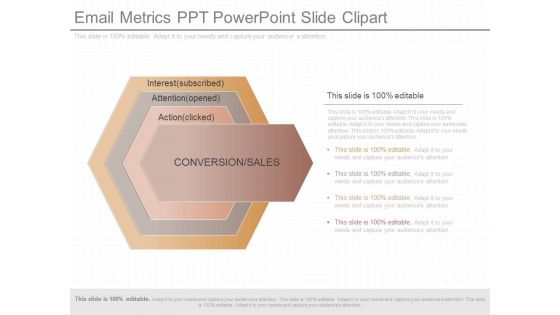
Email Metrics Ppt Powerpoint Slide Clipart
This is a email metrics ppt powerpoint slide clipart. This is a four stage process. The stages in this process are interest subscribed, attention opened, action clicked, conversion sales.
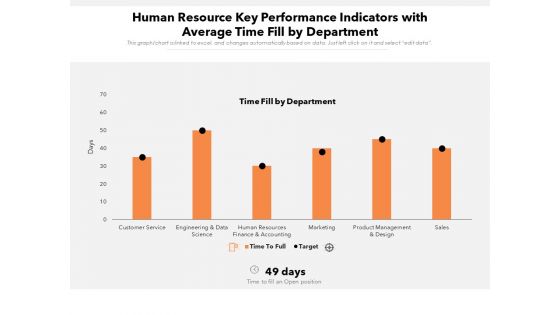
Human Resource Key Performance Indicators With Average Time Fill By Department Ppt PowerPoint Presentation Gallery Example Introduction PDF
Showcasing this set of slides titled human resource key performance indicators with average time fill by department ppt powerpoint presentation gallery example introduction pdf. The topics addressed in these templates are sales, service, finance. All the content presented in this PPT design is completely editable. Download it and make adjustments in color, background, font etc. as per your unique business setting.
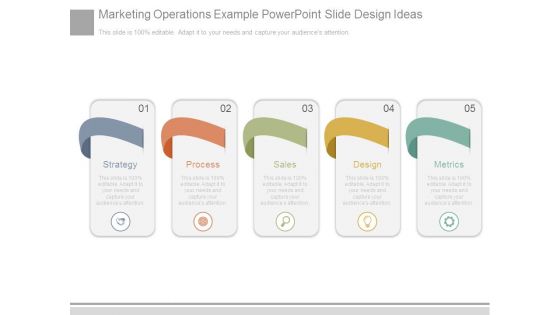
Marketing Operations Example Powerpoint Slide Design Ideas
This is a marketing operations example powerpoint slide design ideas. This is a five stage process. The stages in this process are strategy, process, sales, design, metrics.
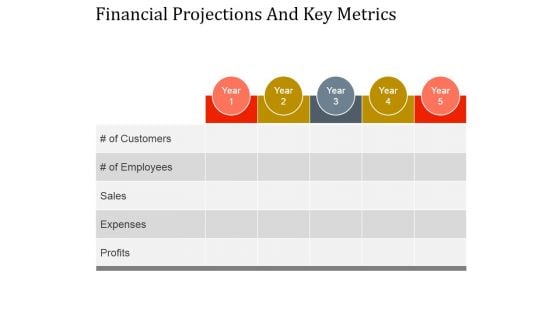
Financial Projections And Key Metrics Ppt PowerPoint Presentation Designs
This is a financial projections and key metrics ppt powerpoint presentation designs. This is a five stage process. The stages in this process are profits, expenses, sales, of employees, of customers.
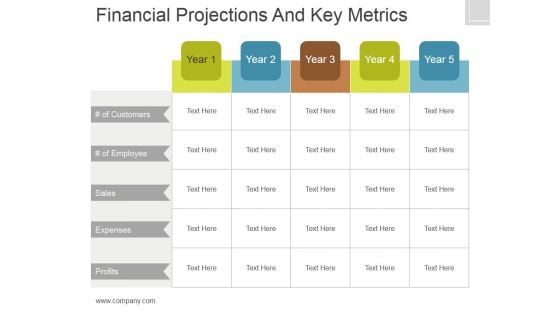
Financial Projections And Key Metrics Ppt PowerPoint Presentation Show
This is a financial projections and key metrics ppt powerpoint presentation show. This is a five stage process. The stages in this process are of customers, sales, expenses, profits.
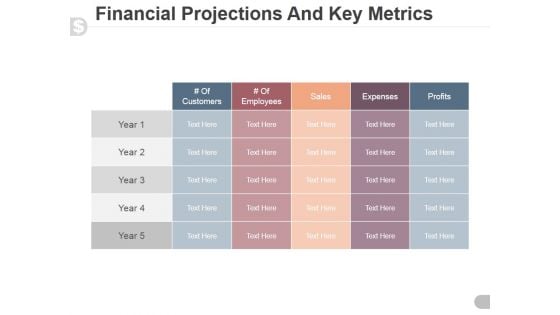
Financial Projections And Key Metrics Ppt PowerPoint Presentation Professional
This is a financial projections and key metrics ppt powerpoint presentation professional. This is a five stage process. The stages in this process are customers, employees, sales, expenses, profits.

Financial Projections And Key Metrics Ppt PowerPoint Presentation Styles Skills
This is a financial projections and key metrics ppt powerpoint presentation styles skills. This is a five stage process. The stages in this process are expenses, profits, sales, employees, years.
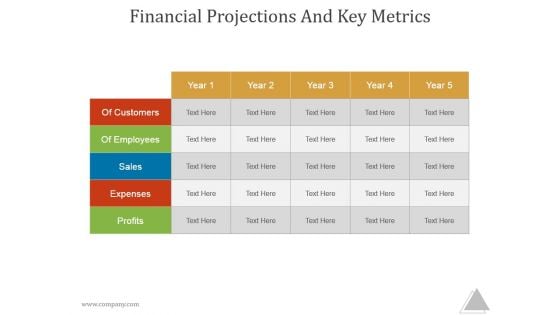
Financial Projections And Key Metrics Ppt PowerPoint Presentation Samples
This is a financial projections and key metrics ppt powerpoint presentation samples. This is a five stage process. The stages in this process are of customers, year, of employees, sales, expenses.
Availability Key Performance Indicator Inventory Turnover Ratio Ppt PowerPoint Presentation Icon Themes
Presenting this set of slides with name availability key performance indicator inventory turnover ratio ppt powerpoint presentation icon themes. The topics discussed in these slides are availability kpi, availability dashboard, availability metrics. This is a completely editable PowerPoint presentation and is available for immediate download. Download now and impress your audience.
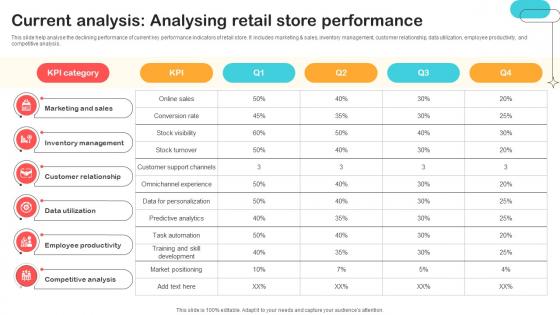
Current Analysis Analysing Retail Store Performance Optimizing Retail Operations With Digital DT SS V
This slide help analyse the declining performance of current key performance indicators of retail store. It includes marketing and sales, inventory management, customer relationship, data utilization, employee productivity, and competitive analysis.Whether you have daily or monthly meetings, a brilliant presentation is necessary. Current Analysis Analysing Retail Store Performance Optimizing Retail Operations With Digital DT SS V can be your best option for delivering a presentation. Represent everything in detail using Current Analysis Analysing Retail Store Performance Optimizing Retail Operations With Digital DT SS V and make yourself stand out in meetings. The template is versatile and follows a structure that will cater to your requirements. All the templates prepared by Slidegeeks are easy to download and edit. Our research experts have taken care of the corporate themes as well. So, give it a try and see the results. This slide help analyse the declining performance of current key performance indicators of retail store. It includes marketing and sales, inventory management, customer relationship, data utilization, employee productivity, and competitive analysis.
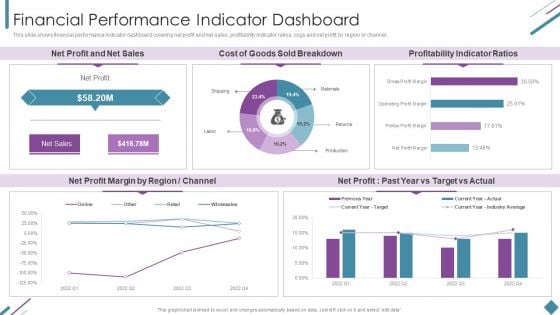
Metrics To Measure Business Performance Financial Performance Indicator Dashboard Pictures PDF
This slide shows financial performance indicator dashboard covering net profit and net sales, profitability indicator ratios, cogs and net profit by region or channel. Deliver an awe inspiring pitch with this creative Metrics To Measure Business Performance Financial Performance Indicator Dashboard Pictures PDF bundle. Topics like Net Profit, Net Sales, Cost Goods, Sold Breakdown can be discussed with this completely editable template. It is available for immediate download depending on the needs and requirements of the user.
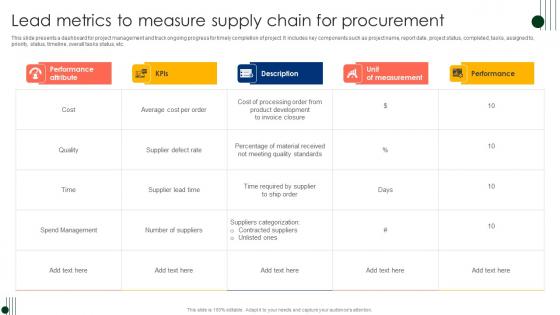
Lead Metrics To Measure Supply Chain For Procurement Ppt Professional Design Inspiration Pdf
This slide presents a dashboard for project management and track ongoing progress for timely completion of project. It includes key components such as project name, report date, project status, completed, tasks, assigned to, priority, status, timeline, overall tasks status, etc. Showcasing this set of slides titled Lead Metrics To Measure Supply Chain For Procurement Ppt Professional Design Inspiration Pdf. The topics addressed in these templates are Project Status, Completed, Tasks, Assigned To, Priority. All the content presented in this PPT design is completely editable. Download it and make adjustments in color, background, font etc. as per your unique business setting. This slide presents a dashboard for project management and track ongoing progress for timely completion of project. It includes key components such as project name, report date, project status, completed, tasks, assigned to, priority, status, timeline, overall tasks status, etc.
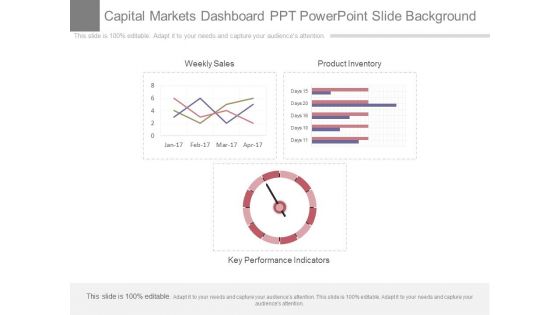
Capital Markets Dashboard Ppt Powerpoint Slide Background
This is a capital markets dashboard ppt powerpoint slide background. This is a three stage process. The stages in this process are weekly sales, product inventory, key performance indicators.
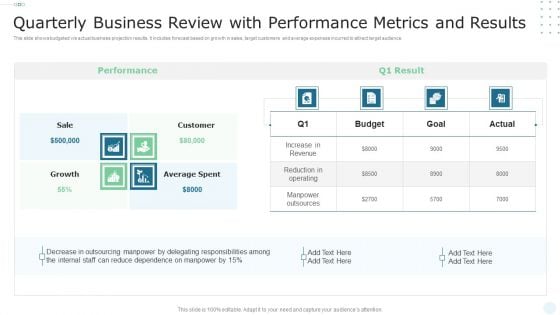
Quarterly Business Review With Performance Metrics And Results Ideas PDF
This slide shows budgeted v or s actual business projection results. It includes forecast based on growth in sales, target customers and average expenses incurred to attract target audience. Showcasing this set of slides titled Quarterly Business Review With Performance Metrics And Results Ideas PDF. The topics addressed in these templates are Sale, Customer, Average Spent. All the content presented in this PPT design is completely editable. Download it and make adjustments in color, background, font etc. as per your unique business setting.
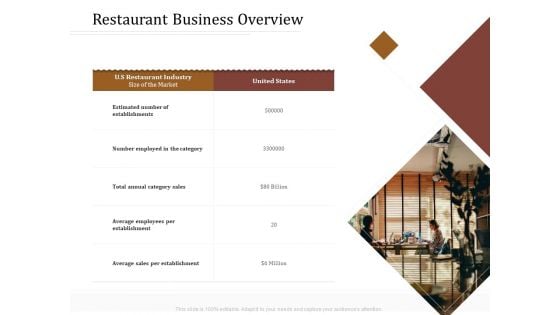
Key Metrics Hotel Administration Management Restaurant Business Overview Elements PDF
Presenting this set of slides with name key metrics hotel administration management restaurant business overview elements pdf. The topics discussed in these slides are average, sales, establishment, annual category. This is a completely editable PowerPoint presentation and is available for immediate download. Download now and impress your audience.
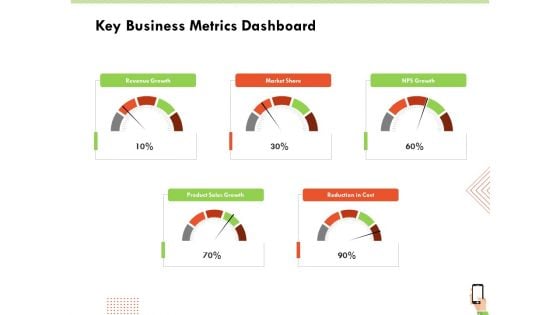
Multi Channel Online Commerce Key Business Metrics Dashboard Background PDF
Deliver and pitch your topic in the best possible manner with this multi channel online commerce key business metrics dashboard background pdf. Use them to share invaluable insights on revenue, market, sales, growth, cost and impress your audience. This template can be altered and modified as per your expectations. So, grab it now.
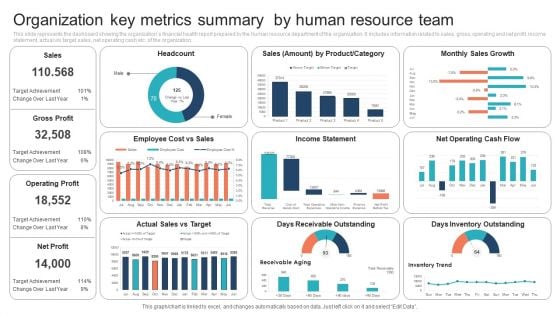
Organization Key Metrics Summary By Human Resource Team Information PDF
This slide represents the dashboard showing the organizations financial health report prepared by the human resource department of the organization. It includes information related to sales, gross, operating and net profit, income statement, actual vs target sales, net operating cash etc. of the organization.Showcasing this set of slides titled Organization Key Metrics Summary By Human Resource Team Information PDF. The topics addressed in these templates are Organization Key Metrics Summary, Human Resource Team. All the content presented in this PPT design is completely editable. Download it and make adjustments in color, background, font etc. as per your unique business setting.
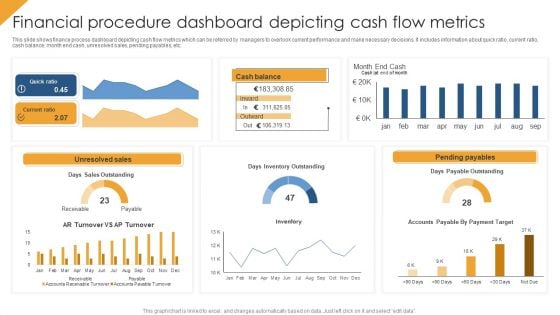
Financial Procedure Dashboard Depicting Cash Flow Metrics Structure PDF
This slide shows finance process dashboard depicting cash flow metrics which can be referred by managers to overlook current performance and make necessary decisions. It includes information about quick ratio, current ratio, cash balance, month end cash, unresolved sales, pending payables, etc. Pitch your topic with ease and precision using this Financial Procedure Dashboard Depicting Cash Flow Metrics Structure PDF. This layout presents information on Quick Ratio, Unresolved Sales, Pending Payables. It is also available for immediate download and adjustment. So, changes can be made in the color, design, graphics or any other component to create a unique layout.
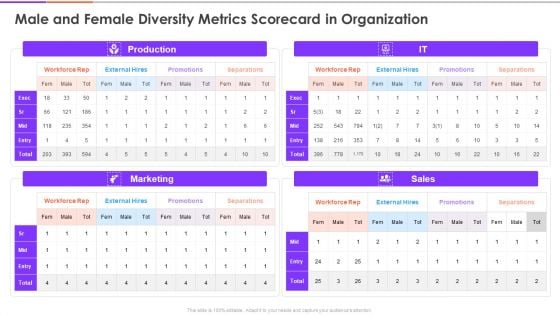
Enterprise Diversity Metrics And Scorecard Male And Female Diversity Metrics Scorecard In Organization Rules PDF
Deliver and pitch your topic in the best possible manner with this enterprise diversity metrics and scorecard male and female diversity metrics scorecard in organization rules pdf. Use them to share invaluable insights on production, marketing, sales, it and impress your audience. This template can be altered and modified as per your expectations. So, grab it now.
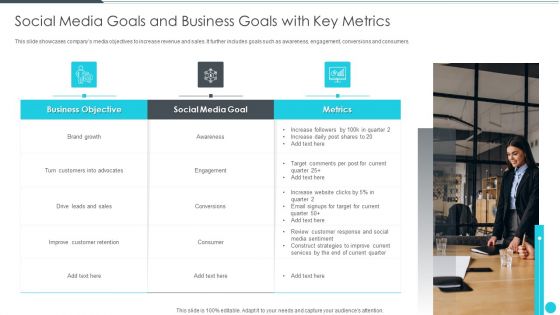
Social Media Goals And Business Goals With Key Metrics Structure PDF
This slide showcases companys media objectives to increase revenue and sales. It further includes goals such as awareness, engagement, conversions and consumers. Persuade your audience using this social media goals and business goals with key metrics structure pdf. This PPT design covers three stages, thus making it a great tool to use. It also caters to a variety of topics including brand growth, customers, sales. Download this PPT design now to present a convincing pitch that not only emphasizes the topic but also showcases your presentation skills.
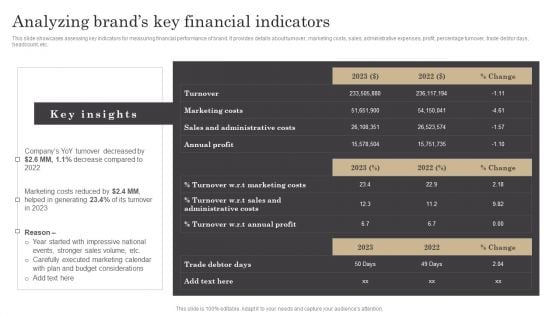
Analyzing Brands Key Financial Indicators Ppt Infographic Template Slides PDF
This slide showcases assessing key indicators for measuring financial performance of brand. It provides details about turnover, marketing costs, sales, administrative expenses, profit, percentage turnover, trade debtor days, headcount, etc. Are you in need of a template that can accommodate all of your creative concepts This one is crafted professionally and can be altered to fit any style. Use it with Google Slides or PowerPoint. Include striking photographs, symbols, depictions, and other visuals. Fill, move around, or remove text boxes as desired. Test out color palettes and font mixtures. Edit and save your work, or work with colleagues. Download Analyzing Brands Key Financial Indicators Ppt Infographic Template Slides PDF and observe how to make your presentation outstanding. Give an impeccable presentation to your group and make your presentation unforgettable.
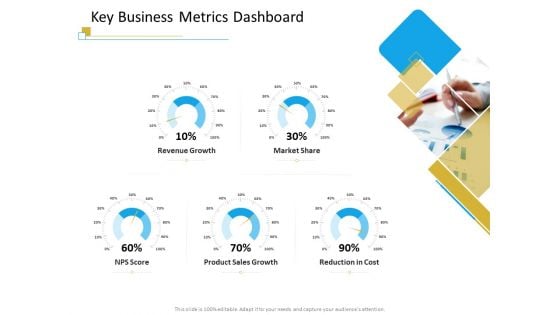
Successful Mobile Strategies For Business Key Business Metrics Dashboard Background PDF
Deliver and pitch your topic in the best possible manner with this successful mobile strategies for business key business metrics dashboard background pdf. Use them to share invaluable insights on revenue, growth, sales, cost, market and impress your audience. This template can be altered and modified as per your expectations. So, grab it now.
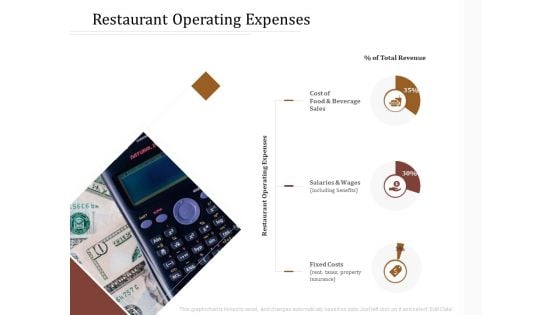
Key Metrics Hotel Administration Management Restaurant Operating Expenses Guidelines PDF
Presenting this set of slides with name key metrics hotel administration management restaurant operating expenses guidelines pdf. The topics discussed in these slides are cost, sales, salaries and wages, fixed costs, revenue. This is a completely editable PowerPoint presentation and is available for immediate download. Download now and impress your audience.
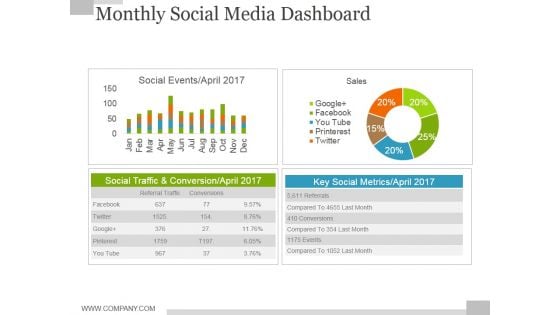
Monthly Social Media Dashboard Ppt PowerPoint Presentation Model Slide
This is a monthly social media dashboard ppt powerpoint presentation model slide. This is a four stage process. The stages in this process are sales, social events, business, finance, key social metrics.
Business Service Provider Accounting Performance Metrics Evaluated By Our Company Amount Icons PDF
Deliver an awe inspiring pitch with this creative business service provider accounting performance metrics evaluated by our company amount icons pdf bundle. Topics like revenue, expenses, sales, business can be discussed with this completely editable template. It is available for immediate download depending on the needs and requirements of the user.
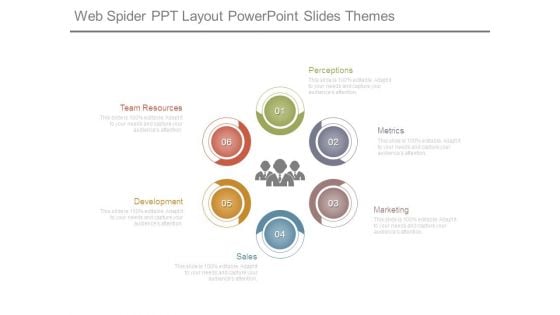
Web Spider Ppt Layout Powerpoint Slides Themes
This is a web spider ppt layout powerpoint slides themes. This is a six stage process. The stages in this process are perceptions, metrics, marketing, sales, development, team resources.
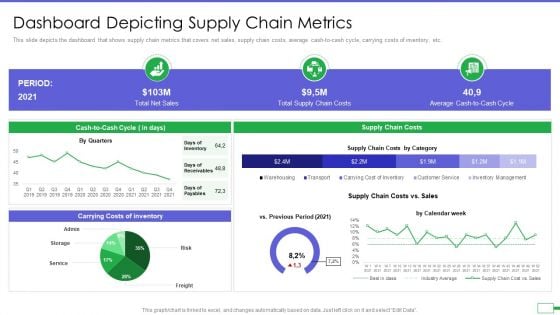
Iot And Digital Twin To Reduce Costs Post Covid Dashboard Depicting Supply Chain Metrics Information PDF
This slide depicts the dashboard that shows supply chain metrics that covers net sales, supply chain costs, average cash to cash cycle, carrying costs of inventory, etc. Deliver an awe inspiring pitch with this creative iot and digital twin to reduce costs post covid dashboard depicting supply chain metrics information pdf bundle. Topics like covers net sales, supply chain costs, average cash to cash cycle, carrying costs of inventory can be discussed with this completely editable template. It is available for immediate download depending on the needs and requirements of the user.
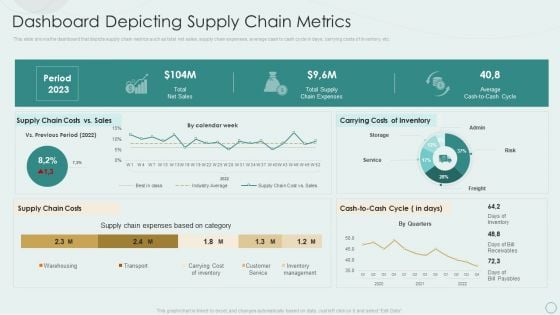
Learning Various Supply Chain Models Dashboard Depicting Supply Chain Metrics Pictures PDF
This slide shows the dashboard that depicts supply chain metrics such as total net sales, supply chain expenses, average cash to cash cycle in days, carrying costs of inventory, etc. Deliver an awe inspiring pitch with this creative Learning Various Supply Chain Models Dashboard Depicting Supply Chain Metrics Pictures PDF bundle. Topics like Period 2023, Total Net Sales, Carrying Costs Inventory, Supply Chain Costs can be discussed with this completely editable template. It is available for immediate download depending on the needs and requirements of the user.
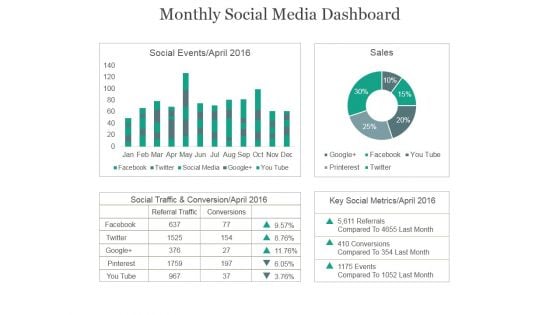
Monthly Social Media Dashboard Ppt PowerPoint Presentation Example 2015
This is a monthly social media dashboard ppt powerpoint presentation example 2015. This is a four stage process. The stages in this process are social events, sales, social traffic, conservation, key social metrics.
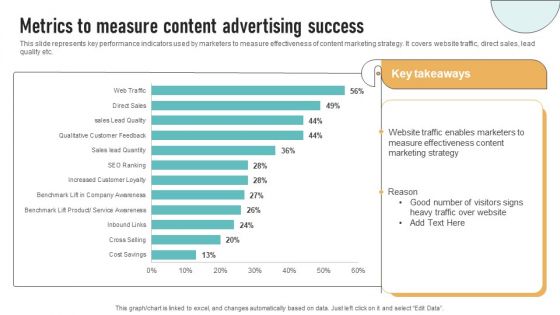
Metrics To Measure Content Advertising Success Demonstration PDF
This slide represents key performance indicators used by marketers to measure effectiveness of content marketing strategy. It covers website traffic, direct sales, lead quality etc. The Metrics To Measure Content Advertising Success Demonstration PDF is a compilation of the most recent design trends as a series of slides. It is suitable for any subject or industry presentation, containing attractive visuals and photo spots for businesses to clearly express their messages. This template contains a variety of slides for the user to input data, such as structures to contrast two elements, bullet points, and slides for written information. Slidegeeks is prepared to create an impression.
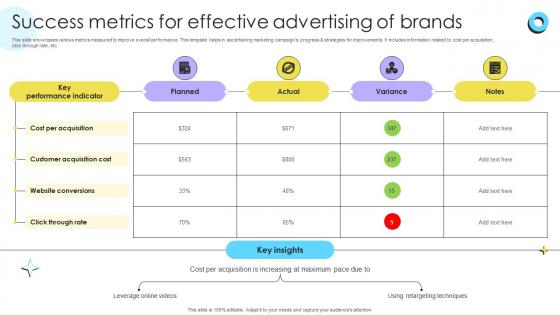
Success Metrics For Effective Advertising Encouraging Repetitive Customer Purchase Ppt Powerpoint
This slide showcases various metrics measured to improve overall performance. This template helps in ascertaining marketing campaigns progress and strategies for improvements. It includes information related to cost per acquisition, click through rate, etc. Retrieve professionally designed Success Metrics For Effective Advertising Encouraging Repetitive Customer Purchase Ppt Powerpoint to effectively convey your message and captivate your listeners. Save time by selecting pre-made slideshows that are appropriate for various topics, from business to educational purposes. These themes come in many different styles, from creative to corporate, and all of them are easily adjustable and can be edited quickly. Access them as PowerPoint templates or as Google Slides themes. You do not have to go on a hunt for the perfect presentation because Slidegeeks got you covered from everywhere. This slide showcases various metrics measured to improve overall performance. This template helps in ascertaining marketing campaigns progress and strategies for improvements. It includes information related to cost per acquisition, click through rate, etc.
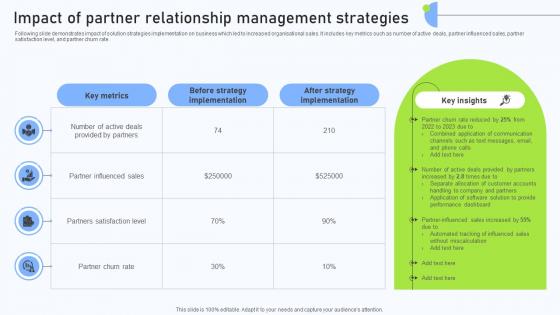
Relationship Management Automation Impact Of Partner Relationship Management
Following slide demonstrates impact of solution strategies implementation on business which led to increased organisational sales. It includes key metrics such as number of active deals, partner influenced sales, partner satisfaction level, and partner churn rate. Crafting an eye-catching presentation has never been more straightforward. Let your presentation shine with this tasteful yet straightforward Relationship Management Automation Impact Of Partner Relationship Management template. It offers a minimalistic and classy look that is great for making a statement. The colors have been employed intelligently to add a bit of playfulness while still remaining professional. Construct the ideal Relationship Management Automation Impact Of Partner Relationship Management that effortlessly grabs the attention of your audience Begin now and be certain to wow your customers Following slide demonstrates impact of solution strategies implementation on business which led to increased organisational sales. It includes key metrics such as number of active deals, partner influenced sales, partner satisfaction level, and partner churn rate.
Tactical Plan For Brand Remodeling Rebranding Performance Metrics Ppt Icon Brochure PDF
The purpose of this slide is to provide a glimpse of the rebranding performance metrics. Deliver an awe inspiring pitch with this creative tactical plan for brand remodeling rebranding performance metrics ppt icon brochure pdf bundle. Topics like target, sales, revenue can be discussed with this completely editable template. It is available for immediate download depending on the needs and requirements of the user.
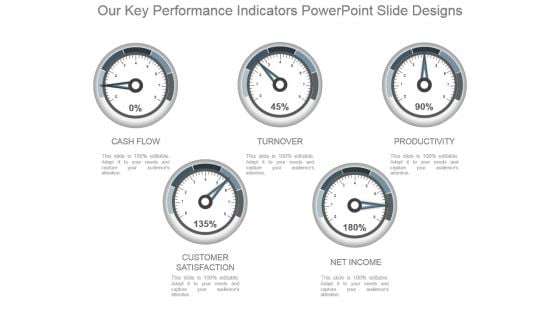
Our Key Performance Indicators Powerpoint Slide Designs
This is a our key performance indicators powerpoint slide designs. This is a five stage process. The stages in this process are cash flow, turnover, productivity, customer satisfaction, net income.
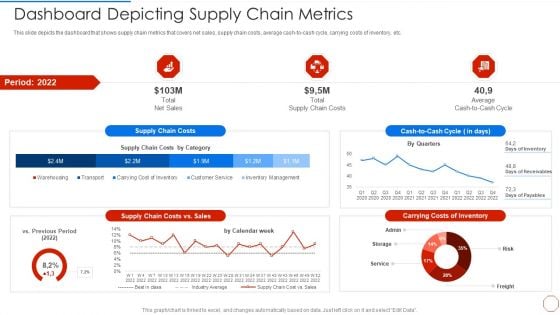
Minimizing Operational Cost Through Iot Virtual Twins Implementation Dashboard Depicting Supply Download PDF
This slide depicts the dashboard that shows supply chain metrics that covers net sales, supply chain costs, average cash to cash cycle, carrying costs of inventory, etc. Deliver an awe inspiring pitch with this creative minimizing operational cost through iot virtual twins implementation dashboard depicting supply download pdf bundle. Topics like sales, costs, supply, average can be discussed with this completely editable template. It is available for immediate download depending on the needs and requirements of the user.
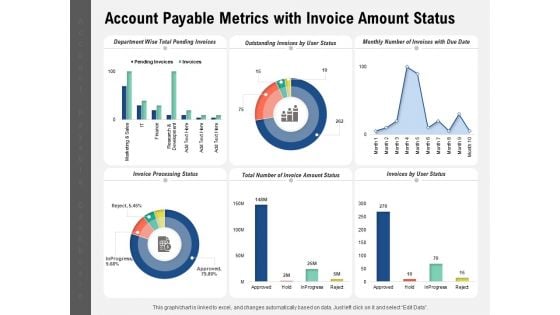
Account Payable Metrics With Invoice Amount Status Ppt PowerPoint Presentation Show Images PDF
Presenting this set of slides with name account payable metrics with invoice amount status ppt powerpoint presentation show images pdf. The topics discussed in these slides are marketing and sales, finance, research and development, pending invoices, invoices, it. This is a completely editable PowerPoint presentation and is available for immediate download. Download now and impress your audience.
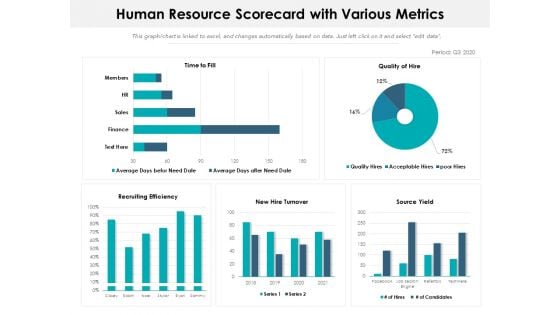
Human Resource Scorecard With Various Metrics Ppt PowerPoint Presentation Slides Demonstration PDF
Presenting this set of slides with name human resource scorecard with various metrics ppt powerpoint presentation slides demonstration pdf. The topics discussed in these slides are hr, sales, finance, recruiting efficiency, source yield, quality of hire. This is a completely editable PowerPoint presentation and is available for immediate download. Download now and impress your audience.
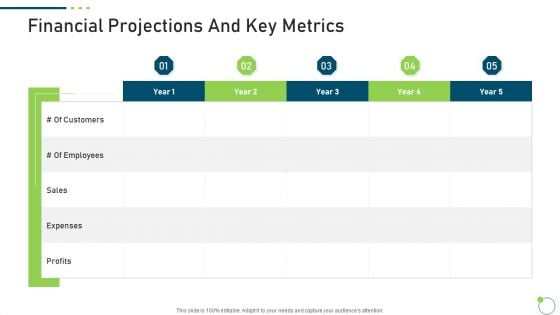
Investor Pitch Deck New Venture Capital Raising Financial Projections And Key Metrics Ideas PDF
Deliver and pitch your topic in the best possible manner with this investor pitch deck new venture capital raising financial projections and key metrics ideas pdf. Use them to share invaluable insights on sales, expenses, profits and impress your audience. This template can be altered and modified as per your expectations. So, grab it now.
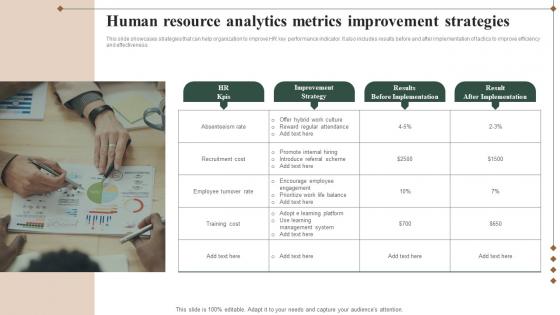
Human Resource Analytics Metrics Improvement Strategies Professional Pdf
This slide showcases strategies that can help organization to improve HR key performance indicator. It also includes results before and after implementation of tactics to improve efficiency and effectiveness.Showcasing this set of slides titled Human Resource Analytics Metrics Improvement Strategies Professional Pdf The topics addressed in these templates are Absenteeism Rate, Employee Turnover, Training Cost All the content presented in this PPT design is completely editable. Download it and make adjustments in color, background, font etc. as per your unique business setting. This slide showcases strategies that can help organization to improve HR key performance indicator. It also includes results before and after implementation of tactics to improve efficiency and effectiveness.
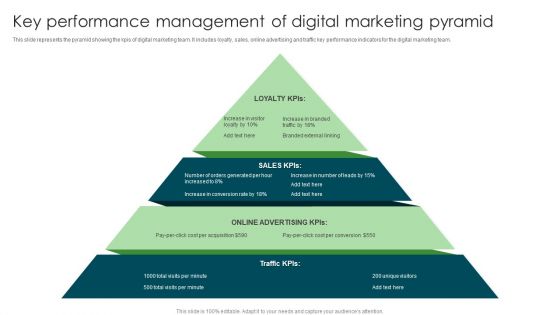
Key Performance Management Of Digital Marketing Pyramid Designs PDF
This slide represents the pyramid showing the kpis of digital marketing team. It includes loyalty, sales, online advertising and traffic key performance indicators for the digital marketing team. Presenting Key Performance Management Of Digital Marketing Pyramid Designs PDF to dispense important information. This template comprises three stages. It also presents valuable insights into the topics including Key Performance Management, Digital Marketing Pyramid. This is a completely customizable PowerPoint theme that can be put to use immediately. So, download it and address the topic impactfully.
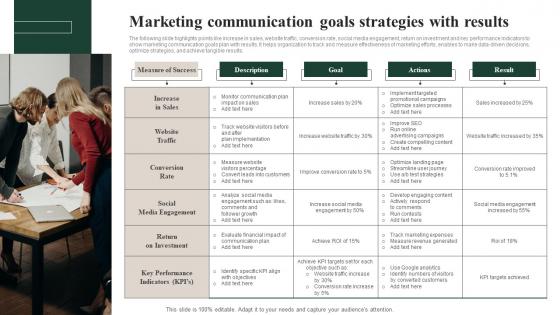
Marketing Communication Goals Strategies With Results Guidelines Pdf
The following slide highlights points like increase in sales, website traffic, conversion rate, social media engagement, return on investment and key performance indicators to show marketing communication goals plan with results. It helps organization to track and measure effectiveness of marketing efforts, enables to make data-driven decisions, optimize strategies, and achieve tangible results. Showcasing this set of slides titled Marketing Communication Goals Strategies With Results Guidelines Pdf The topics addressed in these templates are Increase In Sales, Website Traffic, Conversion Rate All the content presented in this PPT design is completely editable. Download it and make adjustments in color, background, font etc. as per your unique business setting. The following slide highlights points like increase in sales, website traffic, conversion rate, social media engagement, return on investment and key performance indicators to show marketing communication goals plan with results. It helps organization to track and measure effectiveness of marketing efforts, enables to make data-driven decisions, optimize strategies, and achieve tangible results.
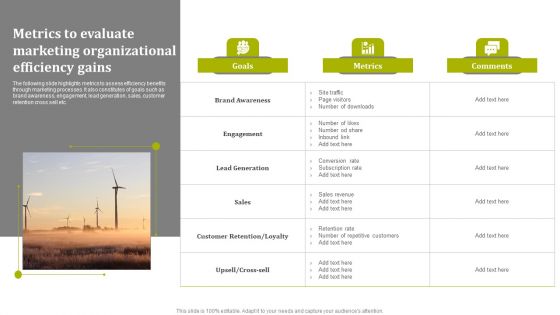
Metrics To Evaluate Marketing Organizational Efficiency Gains Microsoft PDF
The following slide highlights metrics to assess efficiency benefits through marketing processes. It also constitutes of goals such as brand awareness, engagement, lead generation, sales, customer retention cross sell etc. Showcasing this set of slides titled Metrics To Evaluate Marketing Organizational Efficiency Gains Microsoft PDF. The topics addressed in these templates are Goals, Metrics, Comments. All the content presented in this PPT design is completely editable. Download it and make adjustments in color, background, font etc. as per your unique business setting.
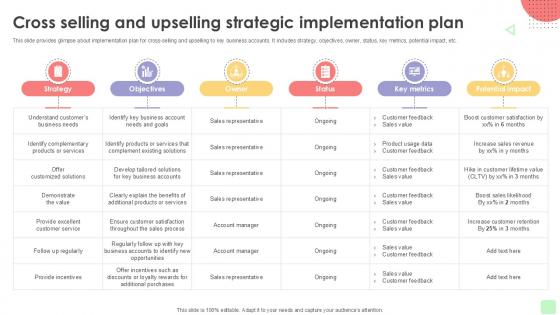
Cross Selling And Upselling Detailed Business Account PPT Template Strategy SS V
This slide provides glimpse about implementation plan for cross selling and upselling to key business accounts. It includes strategy, objectives, owner, status, key metrics, potential impact, etc. Dont compromise on a template that erodes your messages impact. Introducing our engaging Cross Selling And Upselling Detailed Business Account PPT Template Strategy SS V complete deck, thoughtfully crafted to grab your audiences attention instantly. With this deck, effortlessly download and adjust elements, streamlining the customization process. Whether youre using Microsoft versions or Google Slides, it fits seamlessly into your workflow. Furthermore, its accessible in JPG, JPEG, PNG, and PDF formats, facilitating easy sharing and editing. Not only that you also play with the color theme of your slides making it suitable as per your audiences preference. This slide provides glimpse about implementation plan for cross selling and upselling to key business accounts. It includes strategy, objectives, owner, status, key metrics, potential impact, etc.
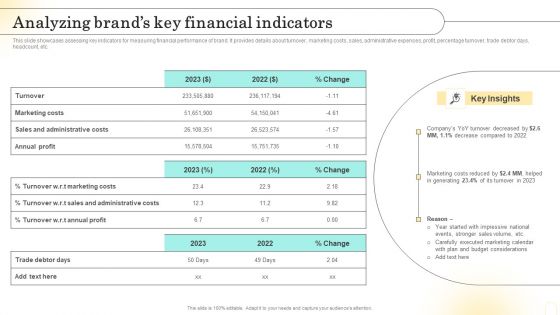
Emotional Marketing Strategy To Nurture Analyzing Brands Key Financial Indicators Demonstration PDF
This slide showcases assessing key indicators for measuring financial performance of brand. It provides details about turnover, marketing costs, sales, administrative expenses, profit, percentage turnover, trade debtor days, headcount, etc. Create an editable Emotional Marketing Strategy To Nurture Analyzing Brands Key Financial Indicators Demonstration PDF that communicates your idea and engages your audience. Whether youre presenting a business or an educational presentation, pre-designed presentation templates help save time. Emotional Marketing Strategy To Nurture Analyzing Brands Key Financial Indicators Demonstration PDF is highly customizable and very easy to edit, covering many different styles from creative to business presentations. Slidegeeks has creative team members who have crafted amazing templates. So, go and get them without any delay.
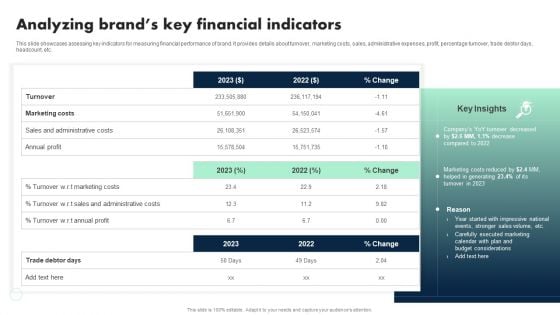
Apple Emotional Marketing Strategy Analyzing Brands Key Financial Indicators Rules PDF
This slide showcases assessing key indicators for measuring financial performance of brand. It provides details about turnover, marketing costs, sales, administrative expenses, profit, percentage turnover, trade debtor days, headcount, etc. Here you can discover an assortment of the finest PowerPoint and Google Slides templates. With these templates, you can create presentations for a variety of purposes while simultaneously providing your audience with an eye catching visual experience. Download Apple Emotional Marketing Strategy Analyzing Brands Key Financial Indicators Rules PDF to deliver an impeccable presentation. These templates will make your job of preparing presentations much quicker, yet still, maintain a high level of quality. Slidegeeks has experienced researchers who prepare these templates and write high quality content for you. Later on, you can personalize the content by editing the Apple Emotional Marketing Strategy Analyzing Brands Key Financial Indicators Rules PDF.


 Continue with Email

 Home
Home


