Sales Organization Chart
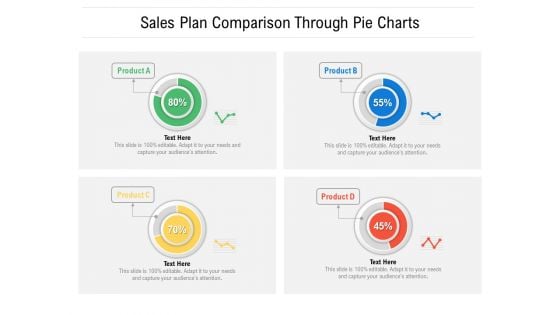
Sales Plan Comparison Through Pie Charts Ppt PowerPoint Presentation File Format Ideas PDF
Showcasing this set of slides titled sales plan comparison through pie charts ppt powerpoint presentation file format ideas pdf. The topics addressed in these templates are sales plan comparison through pie charts. All the content presented in this PPT design is completely editable. Download it and make adjustments in color, background, font etc. as per your unique business setting.
Business Charts PowerPoint Templates 3d Illustration Of Surprised Emoticon Picture Sales
Business Charts PowerPoint templates 3d illustration of surprised emoticon picture Sales-Use this Amazing 3D PowerPoint Diagram to express the Surprising Situation. This Diagram can be used in Business related Presentations. It consists of other colorful Emoticons which can be used for different purposes. Our Business Charts PowerPoint Templates 3d Illustration Of Surprised Emoticon Picture Sales will be your best buy. The value of your thoughts will definitely appreciate.

Business Charts PowerPoint Templates 3d Sales Puzzle Pieces Stock Illustration And Marketing Slides
Business Charts PowerPoint templates 3d Sales Puzzle pieces stock illustration and marketing Slides-This PowerPoint diagram shows two Missing Puzzles from 8x8 Matrix Diagram. There is a lot of space available for writing your text. You can easily edit the size, position, text, color. -Business Charts PowerPoint templates 3d Sales Puzzle pieces stock illustration and marketing Slides Turn the heat up with our Business Charts PowerPoint Templates 3d Sales Puzzle Pieces Stock Illustration And Marketing Slides. Make sure your presentation gets the attention it deserves.
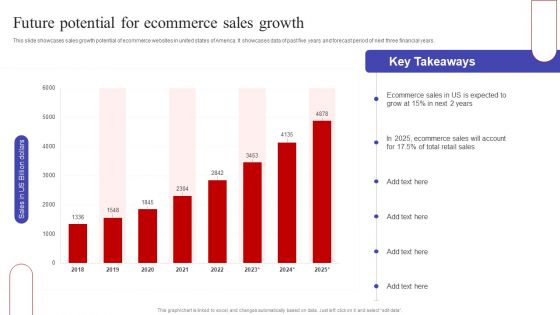
Future Potential For Ecommerce Sales Growth Ppt PowerPoint Presentation Diagram Graph Charts PDF
This slide showcases sales growth potential of ecommerce websites in united states of America. It showcases data of past five years and forecast period of next three financial years. Here you can discover an assortment of the finest PowerPoint and Google Slides templates. With these templates, you can create presentations for a variety of purposes while simultaneously providing your audience with an eye catching visual experience. Download Future Potential For Ecommerce Sales Growth Ppt PowerPoint Presentation Diagram Graph Charts PDF to deliver an impeccable presentation. These templates will make your job of preparing presentations much quicker, yet still, maintain a high level of quality. Slidegeeks has experienced researchers who prepare these templates and write high quality content for you. Later on, you can personalize the content by editing the Future Potential For Ecommerce Sales Growth Ppt PowerPoint Presentation Diagram Graph Charts PDF.
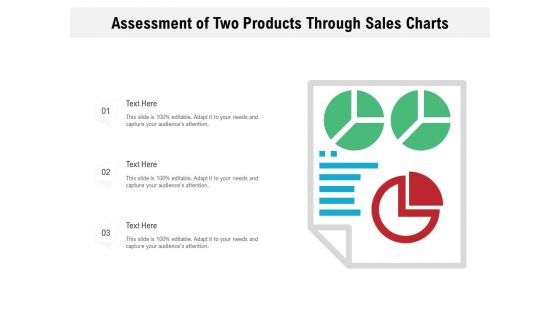
Assessment Of Two Products Through Sales Charts Ppt PowerPoint Presentation Styles Graphics Design PDF
Showcasing this set of slides titled assessment of two products through sales charts ppt powerpoint presentation styles graphics design pdf. The topics addressed in these templates are assessment of two products, through sales charts. All the content presented in this PPT design is completely editable. Download it and make adjustments in color, background, font etc. as per your unique business setting.
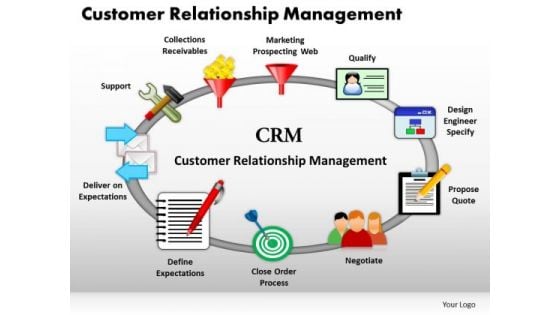
Business Circle Charts PowerPoint Templates Sales Customer Relationship Management Ppt Slides
Business Circle Charts PowerPoint Templates Sales customer relationship management PPT Slides-Use this graphics to discuss the main functions and various models of CRM;. Explain the role of salespeople as relationship developers.-Business Circle Charts PowerPoint Templates Sales customer relationship management PPT Slides-This template can be used for presentations relating to Analysis, Brainstorming, Business, Chart, Concept, Creative, Creativity, Crm, Customer, Diagram, Executive, Flowchart,Hand, Idea, Inspire, Interface, Layout, Legal, Management, Manager, Meeting, Note, Office, Pen, Plan, Presentation, Program, Relationship, Student, Teach, Teamwork, Technical Our Business Circle Charts PowerPoint Templates Sales Customer Relationship Management Ppt Slides aredelightfully crafted. Designed to charm the biggest disbelievers.
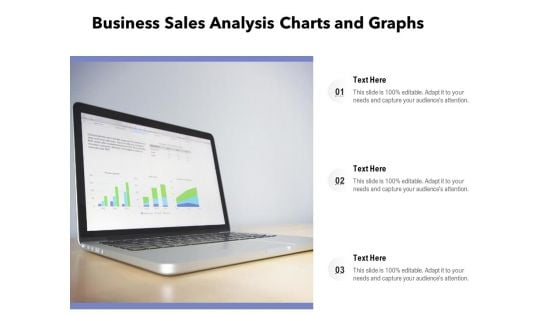
Business Sales Analysis Charts And Graphs Ppt PowerPoint Presentation File Deck PDF
Presenting business sales analysis charts and graphs ppt powerpoint presentation file deck pdf to dispense important information. This template comprises three stages. It also presents valuable insights into the topics including business sales analysis charts and graphs. This is a completely customizable PowerPoint theme that can be put to use immediately. So, download it and address the topic impactfully.
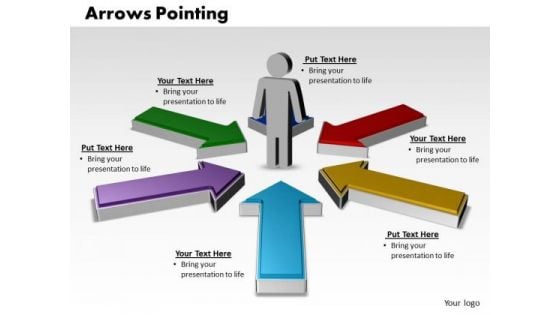
Business Charts PowerPoint Templates Arrows Pointing Inwards With Circular Direction Editable Sales
Business Charts PowerPoint templates arrows pointing inwards with circular direction editable Sales-This PowerPoint Diagram shows the five different colored Arrows pointing towards the man .It imitates the conceptualization of Success, Business, Marketing, Finance, Insurance etc. With our Business Charts PowerPoint Templates Arrows Pointing Inwards With Circular Direction Editable Sales your plans will never fall apart. They assist in maintaining close control.
Sales Performance Report With Charts And Graphs Ppt PowerPoint Presentation Icon Master Slide PDF
Presenting sales performance report with charts and graphs ppt powerpoint presentation icon master slide pdf to dispense important information. This template comprises three stages. It also presents valuable insights into the topics including sales performance report with charts and graphs. This is a completely customizable PowerPoint theme that can be put to use immediately. So, download it and address the topic impactfully.
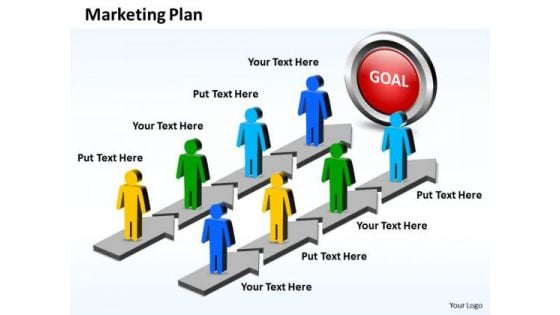
Business Charts PowerPoint Templates Stages For Marketing Plan Sales And Slides
Business Charts PowerPoint templates stages for marketing plan Sales and Slides-This PowerPoint diagram is a simple diagram that provides a graphical overview of a continuing sequence of stages, tasks, actions, or events in a parallel way. This PowerPoint diagram can be used for business process automation and other business related issues.-Business Charts PowerPoint templates stages for marketing plan Sales and Slides You intend to deliver. Make it happen with our Business Charts PowerPoint Templates Stages For Marketing Plan Sales And Slides. Make sure your presentation gets the attention it deserves.
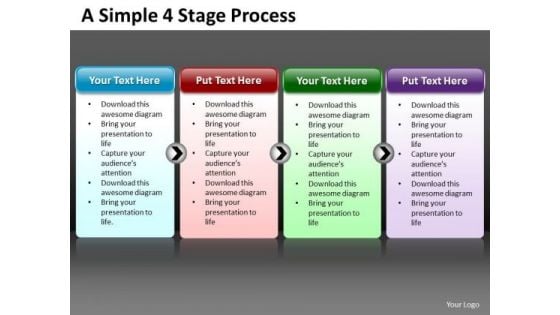
Business Charts PowerPoint Templates Simple 4 Stage Circular Process Editable Sales
Business Charts PowerPoint templates simple 4 stage circular process editable Sales-This PowerPoint Diagram consists of four animated Process tables of Different Colors. It can be used to symbolize four different Approaches or four distinct techniques. It consists of single color slide as well. This diagram will fit for Business Presentations. Open up the windows of your mind. Unlatch them with our Business Charts PowerPoint Templates Simple 4 Stage Circular Process Editable Sales.
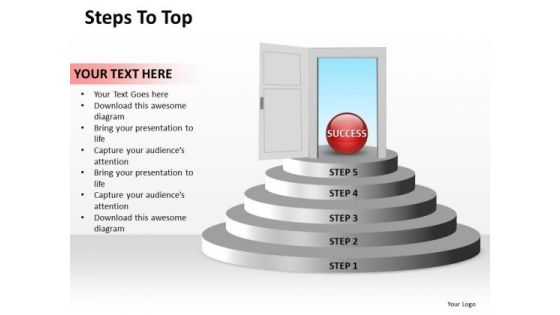
Business Charts PowerPoint Templates Steps To Reach The Top Editable Sales
Business Charts PowerPoint templates steps to reach the top editable Sales-This PowerPoint Diagram shows the doorsteps to reach the door that is Success. It portrays the concept of accomplishment, achievement, attainment, benefit, big hit, eminence, fame, flying colors, fortune, gain, good luck, good times, grand slam, lap of luxury, laughter, maturation, profit, progress, prosperity, realization, reward, triumph, and victory. Capture success with our Business Charts PowerPoint Templates Steps To Reach The Top Editable Sales. You will come out on top.
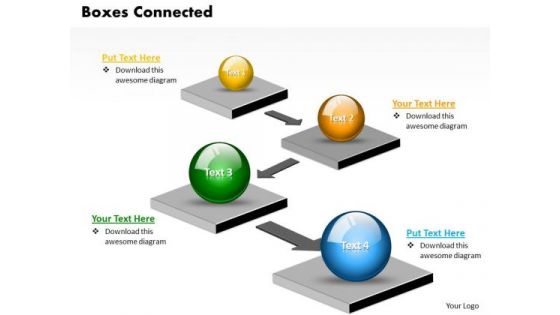
Business Charts PowerPoint Templates 3d Boxes Connected With Arrows Linear Circular Direction Sales
Business Charts PowerPoint templates 3d boxes connected with arrows linear circular direction Sales-Use this Graphical Interface to follow the Correct Path to reach the Destination. This 3D PowerPoint Diagram Shows Four Circular text boxes pointing one to the other defining which Path to follow. This Diagram will make your Presentation Attractive and Delightful to watch. Compare paths with our Business Charts PowerPoint Templates 3d Boxes Connected With Arrows Linear Circular Direction Sales. Download without worries with our money back guaranteee.

Business Charts PowerPoint Templates Cards And Dices Happy New Year Sales Marketing Slides
Business Charts PowerPoint templates cards and dices happy new year Sales marketing Slides-New Year is the time at which a new calendar year begins and the calendar's year count is incremented. This PowerPoint Diagram helps you to wish New Year in different way. It consists of many slides with different graphics. It shows different ways of representing 2013 and wishing New Year. Critique plans with our Business Charts PowerPoint Templates Cards And Dices Happy New Year Sales Marketing Slides. Download without worries with our money back guaranteee.
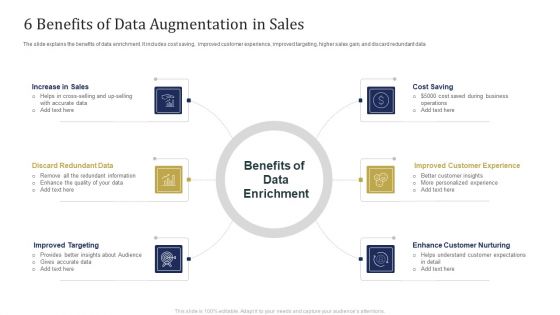
6 Benefits Of Data Augmentation In Sales Ppt Diagram Graph Charts PDF
The slide explains the benefits of data enrichment. It includes cost saving, improved customer experience, improved targeting, higher sales gain, and discard redundant data. Presenting 6 Benefits Of Data Augmentation In Sales Ppt Diagram Graph Charts PDF to dispense important information. This template comprises six stages. It also presents valuable insights into the topics including Discard Redundant Data, Improved Targeting, Enhance Customer Nurturing, Cost Saving. This is a completely customizable PowerPoint theme that can be put to use immediately. So, download it and address the topic impactfully.
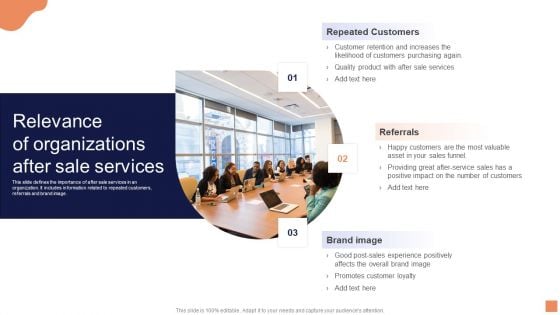
Relevance Of Organizations After Sale Services Information PDF
Presenting Relevance Of Organizations After Sale Services Information PDF to dispense important information. This template comprises three stages. It also presents valuable insights into the topics including Repeated Customers, Customer Retention, Likelihood Of Customers. This is a completely customizable PowerPoint theme that can be put to use immediately. So, download it and address the topic impactfully.
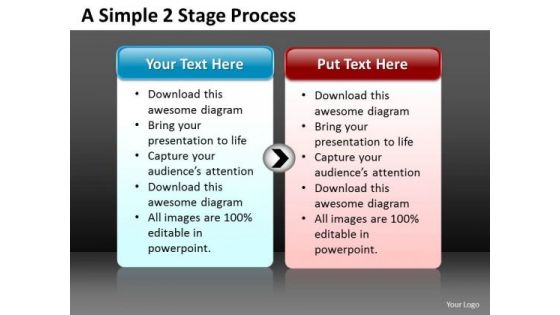
Business Charts PowerPoint Templates Simple 2 Stage Circular Flow Editable Sales
Business Charts PowerPoint templates simple 2 stage circular flow editable Sales-This PowerPoint Diagram consists of two steps Process of Different Colors. It can be used to symbolize two Steps involved in a some Process of Business. It consists of single color slide as well. This diagram will fit for Business Presentations. Create a better workplace with our Business Charts PowerPoint Templates Simple 2 Stage Circular Flow Editable Sales. Dont pass up this opportunity to shine.
Business Charts PowerPoint Templates Design Of An Emoticon Showing Angry Face Sales
Business Charts PowerPoint templates design of an emoticon showing angry face Sales-Use this Business PowerPoint Diagram to represent different types of angry faces. It portrays the concept of animosity, annoyance, antagonism, ill humor, ill temper, impatience, indignation, infuriation, irascibility, ire, irritability, vexation, violence. Encapsulate your thoughts in our Business Charts PowerPoint Templates Design Of An Emoticon Showing Angry Face Sales. They will become a class apart.
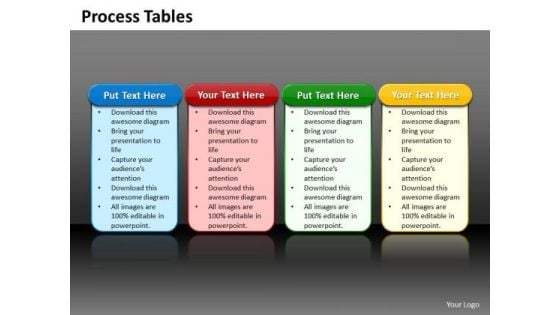
Business Charts PowerPoint Templates 4 Reasons You Should Buy From Circular Process Tables Sales
Business Charts PowerPoint templates 4 reasons you should buy from circular process tables Sales-This PowerPoint Diagram consists of four animated Process tables of Different Colors. It can be used to symbolize four different Approaches or four distinct techniques. It consists of single color slide as well. This diagram will fit for Business Presentations. Display entrepreneurial vision with our Business Charts PowerPoint Templates 4 Reasons You Should Buy From Circular Process Tables Sales. They will make you look good.
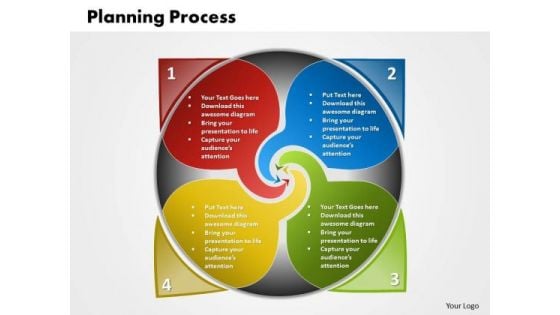
Business Charts PowerPoint Templates 4 Steps Planning Circular Direction Diagram Sales
Business Charts PowerPoint templates 4 steps planning circular direction diagram Sales-This Rangoli Based PowerPoint Diagram shows the four step planning process in Circular Manner. It shows four Phases required in any Process related to Business. Use this Fascinating Diagram to make your Presentation delightful. Add brilliance with our Business Charts PowerPoint Templates 4 Steps Planning Circular Direction Diagram Sales. You will come out on top.
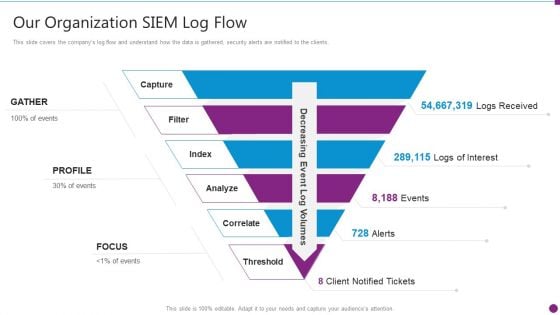
Security Information And Event Management Strategies For Financial Audit And Compliance Our Organization SIEM Log Flow Designs PDF
This slide covers the companys log flow and understand how the data is gathered, security alerts are notified to the clients. This is a security information and event management strategies for financial audit and compliance our organization siem log flow designs pdf template with various stages. Focus and dispense information on six stages using this creative set, that comes with editable features. It contains large content boxes to add your information on topics like our organization siem log flow. You can also showcase facts, figures, and other relevant content using this PPT layout. Grab it now.
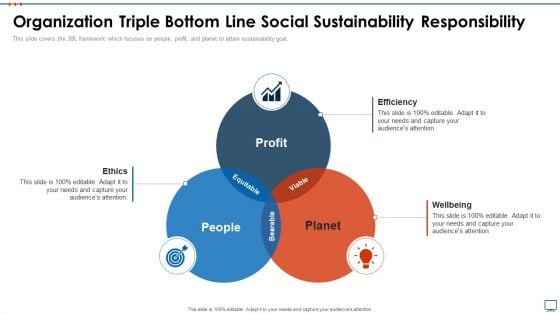
Business Plan Methods Tools And Templates Set 2 Organization Triple Bottom Line Social Sustainability Responsibility Professional PDF
This slide covers the 3BL framework which focuses on people, profit, and planet to attain sustainability goal. Presenting business plan methods tools and templates set 2 organization triple bottom line social sustainability responsibility professional pdf to provide visual cues and insights. Share and navigate important information on three stages that need your due attention. This template can be used to pitch topics like ethics, efficiency, wellbeing. In addtion, this PPT design contains high resolution images, graphics, etc, that are easily editable and available for immediate download.
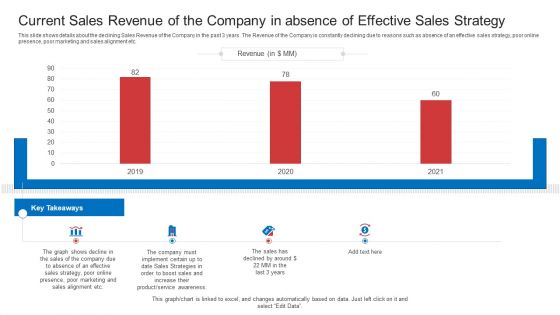
Strategic Plan To Increase Sales Volume And Revenue Current Sales Revenue Of The Company In Absence Of Effective Sales Strategy Diagrams PDF
This slide shows details about the declining Sales Revenue of the Company in the past 3 years. The Revenue of the Company is constantly declining due to reasons such as absence of an effective sales strategy, poor online presence, poor marketing and sales alignment etc. Deliver and pitch your topic in the best possible manner with this strategic plan to increase sales volume and revenue current sales revenue of the company in absence of effective sales strategy diagrams pdf. Use them to share invaluable insights on marketing, sales, strategy, effective, awareness and impress your audience. This template can be altered and modified as per your expectations. So, grab it now.

Strategic Plan To Increase Sales Volume And Revenue Current Length Of Sales Cycle In Absence Of Effective Sales Strategy Ideas PDF
This slide shows details about the increasing Sales Cycle Length of the Company in the past 3 years. The reasons for increasing Sales cycle Length are poor lead generation, poor sales process optimization, using cold calling technique most of the times etc. Deliver an awe inspiring pitch with this creative strategic plan to increase sales volume and revenue current length of sales cycle in absence of effective sales strategy ideas pdf bundle. Topics like technique, sales, process, optimization can be discussed with this completely editable template. It is available for immediate download depending on the needs and requirements of the user.
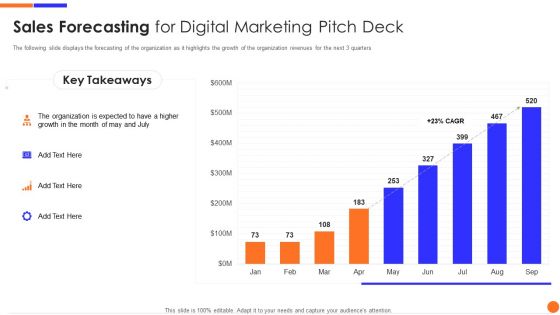
Sales Forecasting For Digital Marketing Pitch Deck Information PDF
The following slide displays the forecasting of the organization as it highlights the growth of the organization revenues for the next 3 quarters Deliver and pitch your topic in the best possible manner with this sales forecasting for digital marketing pitch deck information pdf. Use them to share invaluable insights on sales forecasting for digital marketing pitch deck and impress your audience. This template can be altered and modified as per your expectations. So, grab it now.
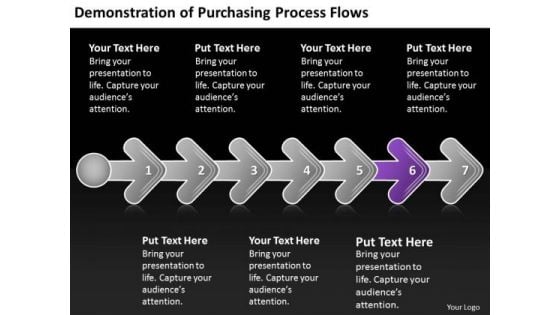
Demonstration Of Purchasing Process Flows Chart Slides Chart PowerPoint
We present our demonstration of purchasing process flows chart Slides chart PowerPoint.Download and present our Business PowerPoint Templates because you can Lead your flock steadily to greater heights. Look around at the vast potential of achievement around you. Download and present our Shapes PowerPoint Templates because you can take it along a sure fire road to good profit. Present our Process and Flows PowerPoint Templates because Our Template designs are State of the Art. Download and present our Flow charts PowerPoint Templates because you know that the core of any organisation is the people who work for it. Download and present our Arrows PowerPoint Templates because it unravels each one for your audience while setting key timelines as you go along.Use these PowerPoint slides for presentations relating to 3d, Abstract, Around, Arrows, Business, Center, Circle, Circular, Concept, Connections, Curve, Cycle, Directions, Distribution, Illustration, Management, Middle, Objects, Plan, Process, Recycle, Rounded, Shadows, Space, System. The prominent colors used in the PowerPoint template are Purple, Gray, Black. Use our demonstration of purchasing process flows chart Slides chart PowerPoint are Adorable. Presenters tell us our Concept PowerPoint templates and PPT Slides are One-of-a-kind. Presenters tell us our demonstration of purchasing process flows chart Slides chart PowerPoint are Classic. You can be sure our Circular PowerPoint templates and PPT Slides are Fashionable. PowerPoint presentation experts tell us our demonstration of purchasing process flows chart Slides chart PowerPoint will get their audience's attention. Professionals tell us our Concept PowerPoint templates and PPT Slides are the best it can get when it comes to presenting. Prepare your brigade with our Demonstration Of Purchasing Process Flows Chart Slides Chart PowerPoint. Get them ready for the battle for success.
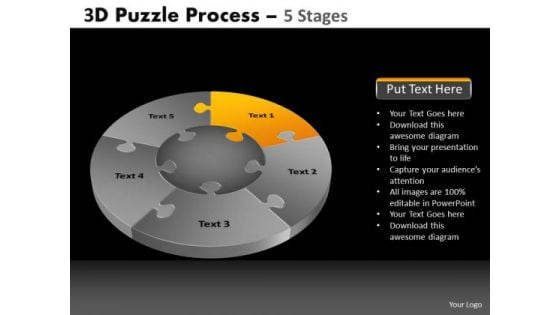
PowerPoint Slidelayout Chart Pie Chart Puzzle Process Ppt Process
PowerPoint Slidelayout Chart Pie chart Puzzle Process PPT Process-These high quality, editable pre-designed powerpoint slides have been carefully created by our professional team to help you impress your audience. Each graphic in every slide is vector based and is 100% editable in powerpoint. Each and every property of any slide - color, size, shading etc can be modified to build an effective powerpoint presentation. Use these slides to convey complex business concepts in a simplified manner. Any text can be entered at any point in the powerpoint slide. Simply DOWNLOAD, TYPE and PRESENT! Play your cards well with our PowerPoint Slidelayout Chart Pie Chart Puzzle Process Ppt Process. Give your thoughts a good deal.
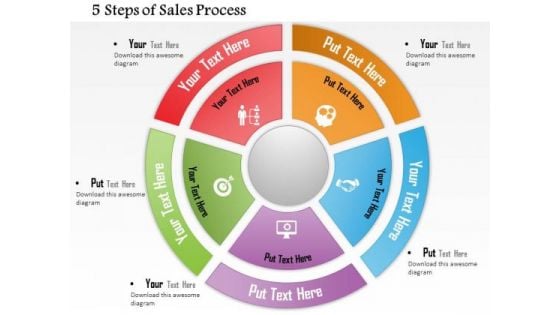
Business Diagram 5 Steps Of Sales Process Presentation Template
This business diagram is useful for business presentation that can incorporate the strategies that you need in order to include the details as well as the organization structure. This fabulous diagram transforms your boring, sleep-inducing presentations into an aggressive, professional, energetic PowerPoint presentation.
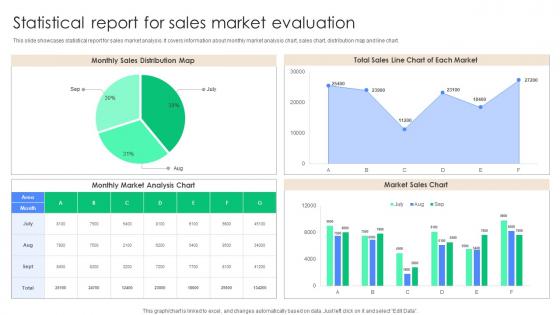
Statistical Report For Sales Market Evaluation Clipart Pdf
This slide showcases statistical report for sales market analysis. It covers information about monthly market analysis chart, sales chart, distribution map and line chart. Showcasing this set of slides titled Statistical Report For Sales Market Evaluation Clipart Pdf. The topics addressed in these templates are Monthly Market Analysis Chart, Market Sales Chart, Sales Chart Each Market. All the content presented in this PPT design is completely editable. Download it and make adjustments in color, background, font etc. as per your unique business setting. This slide showcases statistical report for sales market analysis. It covers information about monthly market analysis chart, sales chart, distribution map and line chart.
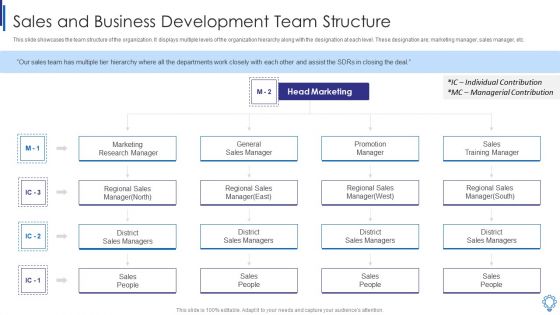
Sales And Business Development Team Structure Infographics PDF
This slide showcases the team structure of the organization. It displays multiple levels of the organization hierarchy along with the designation at each level. These designation are marketing manager, sales manager, etc. Presenting sales and business development team structure infographics pdf to provide visual cues and insights. Share and navigate important information on four stages that need your due attention. This template can be used to pitch topics like marketing research manager, general sales manager, sales training manager, individual contribution, managerial contribution. In addtion, this PPT design contains high resolution images, graphics, etc, that are easily editable and available for immediate download.
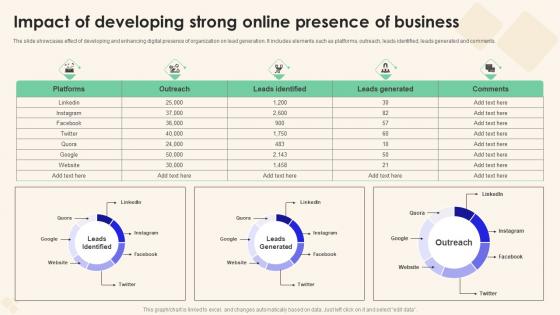
Impact Of Developing Strong Online Sales Performance Enhancement Diagrams Pdf
The slide showcases effect of developing and enhancing digital presence of organization on lead generation. It includes elements such as platforms, outreach, leads identified, leads generated and comments. Are you in need of a template that can accommodate all of your creative concepts This one is crafted professionally and can be altered to fit any style. Use it with Google Slides or PowerPoint. Include striking photographs, symbols, depictions, and other visuals. Fill, move around, or remove text boxes as desired. Test out color palettes and font mixtures. Edit and save your work, or work with colleagues. Download Impact Of Developing Strong Online Sales Performance Enhancement Diagrams Pdf and observe how to make your presentation outstanding. Give an impeccable presentation to your group and make your presentation unforgettable. The slide showcases effect of developing and enhancing digital presence of organization on lead generation. It includes elements such as platforms, outreach, leads identified, leads generated and comments.
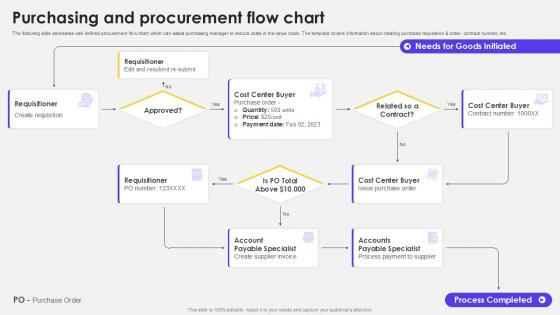
Purchasing And Procurement Flow Chart
Find a pre-designed and impeccable Purchasing And Procurement Flow Chart. The templates can ace your presentation without additional effort. You can download these easy-to-edit presentation templates to make your presentation stand out from others. So, what are you waiting for Download the template from Slidegeeks today and give a unique touch to your presentation. This slide showcases a clear procurement flowchart that assist in purchasing managers minimize costs in the value chain. It includes details on creating purchase requests, generating orders, managing contract numbers, and other important steps for efficient procurement.
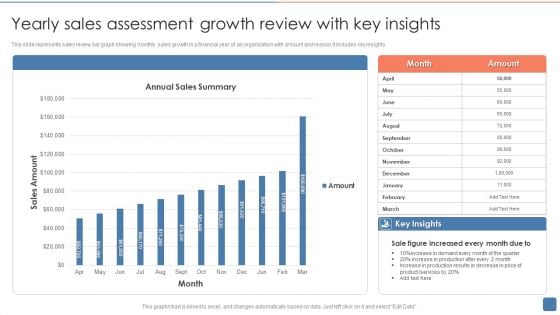
Yearly Sales Assessment Growth Review With Key Insights Infographics PDF
This slide represents sales review bar graph showing monthly sales growth in a financial year of an organization with amount and reason.It includes key insights. Showcasing this set of slides titled Yearly Sales Assessment Growth Review With Key Insights Infographics PDF. The topics addressed in these templates are Sale Figure, Demand, Services. All the content presented in this PPT design is completely editable. Download it and make adjustments in color, background, font etc. as per your unique business setting.
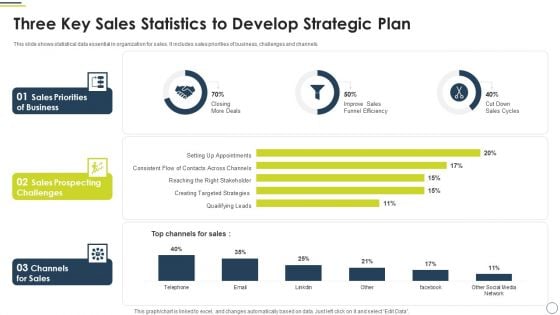
Three Key Sales Statistics To Develop Strategic Plan Microsoft PDF
This slide shows statistical data essential in organization for sales. It includes sales priorities of business, challenges and channels. Pitch your topic with ease and precision using this Three Key Sales Statistics To Develop Strategic Plan Microsoft PDF. This layout presents information on Sales Priorities Business, Sales Prospecting Challenges, Channels For Sales. It is also available for immediate download and adjustment. So, changes can be made in the color, design, graphics or any other component to create a unique layout.
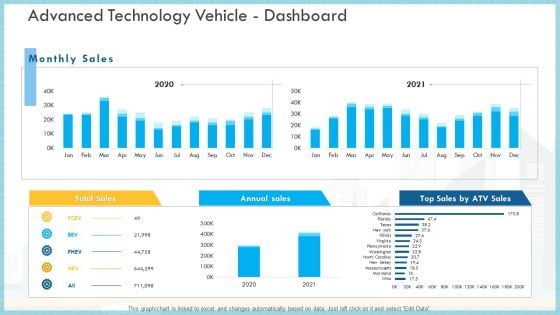
Loss Of Income And Financials Decline In An Automobile Organization Case Study Advanced Technology Vehicle Dashboard Infographics PDF
This graph or chart is linked to excel, and changes automatically based on data. Just left click on it and select Edit Data.Deliver an awe inspiring pitch with this creative loss of income and financials decline in an automobile organization case study advanced technology vehicle dashboard infographics pdf bundle. Topics like total sales, annual sales, monthly sales can be discussed with this completely editable template. It is available for immediate download depending on the needs and requirements of the user.
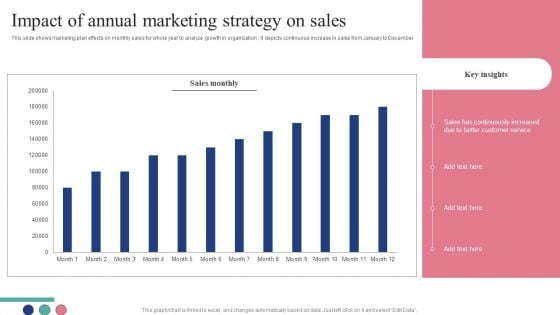
Impact Of Annual Marketing Strategy On Sales Download PDF
This slide shows marketing plan effects on monthly sales for whole year to analyze growth in organization . It depicts continuous increase in sales from January to December Showcasing this set of slides titled Impact Of Annual Marketing Strategy On Sales Download PDF. The topics addressed in these templates are Sales Monthly, Key Insights, Sales. All the content presented in this PPT design is completely editable. Download it and make adjustments in color, background, font etc. as per your unique business setting.
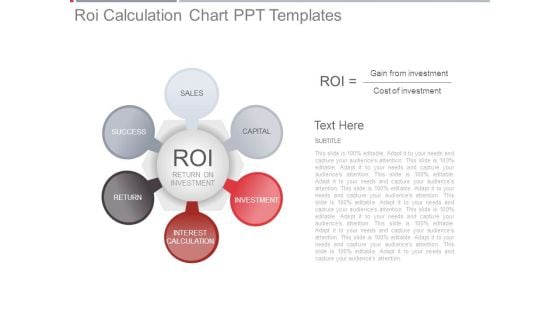
Roi Calculation Chart Ppt Templates
This is a roi calculation chart ppt templates. This is a six stage process. The stages in this process are sales, capital, investment, interest calculation, return, success, return on investment.
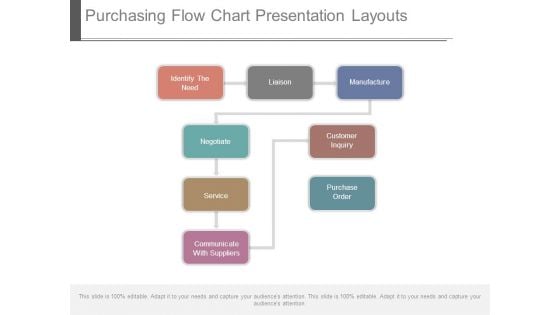
Purchasing Flow Chart Presentation Layouts
This is a purchasing flow chart presentation layouts. This is a eight stage process. The stages in this process are identify the need, liaison, manufacture, negotiate, customer inquiry, service, purchase order, communicate with suppliers.

Analysis Of Ecommerce Sales In Power BI Ppt Slide SS
This slide showcases dashboard for customer segmentation analysis. This template aims to provide opportunities to focus on more customers for selling cosmetics products and can be used to predict business growth. It helps business organization to enhance revenue from sales by focusing on the profit margins. Create an editable Analysis Of Ecommerce Sales In Power BI Ppt Slide SS that communicates your idea and engages your audience. Whether you are presenting a business or an educational presentation, pre-designed presentation templates help save time. Analysis Of Ecommerce Sales In Power BI Ppt Slide SS is highly customizable and very easy to edit, covering many different styles from creative to business presentations. Slidegeeks has creative team members who have crafted amazing templates. So, go and get them without any delay. This slide showcases dashboard for customer segmentation analysis. This template aims to provide opportunities to focus on more customers for selling cosmetics products and can be used to predict business growth. It helps business organization to enhance revenue from sales by focusing on the profit margins.
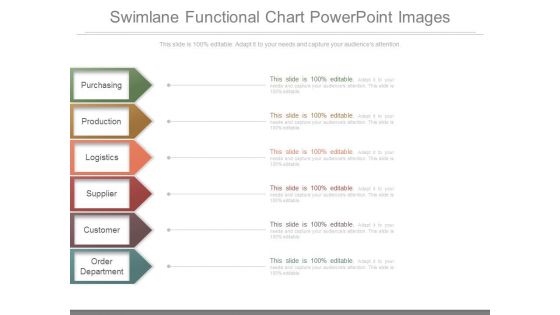
Swimlane Functional Chart Powerpoint Images
This is a swimlane functional chart powerpoint images. This is a six stage process. The stages in this process are purchasing, production, logistics, supplier, customer, order department.
Sales Performance Dashboard With Average Lead Tracking Time Background PDF
This slide showcases dashboard for sales performance that can help organization to analyze the effectiveness of sales campaigns and average response time of lead. Its key components are average contract value, average sales cycle length, follow up contract rate and sales activity. Showcasing this set of slides titled Sales Performance Dashboard With Average Lead Tracking Time Background PDF. The topics addressed in these templates are Avg Contract Value, Sales Activity, Contract Rate. All the content presented in this PPT design is completely editable. Download it and make adjustments in color, background, font etc. as per your unique business setting.
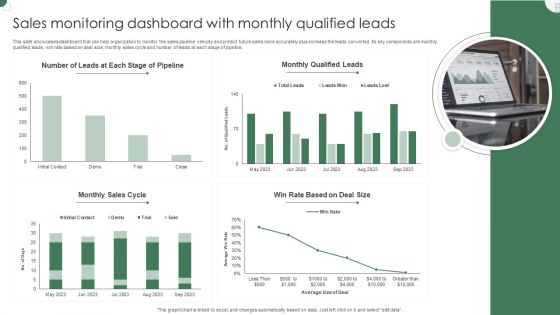
Sales Monitoring Dashboard With Monthly Qualified Leads Guidelines PDF
This slide showcases dashboard that can help organization to monitor the sales pipeline velocity and predict future sales more accurately plus increase the leads converted. Its key components are monthly qualified leads, win rate based on deal size, monthly sales cycle and number of leads at each stage of pipeline. Pitch your topic with ease and precision using this Sales Monitoring Dashboard With Monthly Qualified Leads Guidelines PDF. This layout presents information on Monthly Qualified, Monthly Sales Cycle, Deal Size. It is also available for immediate download and adjustment. So, changes can be made in the color, design, graphics or any other component to create a unique layout.
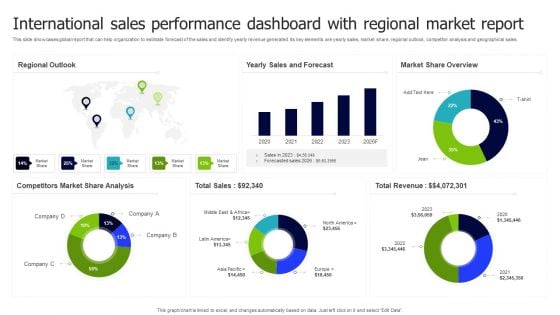
International Sales Performance Dashboard With Regional Market Report Inspiration PDF
This slide showcases global report that can help organization to estimate forecast of the sales and identify yearly revenue generated. Its key elements are yearly sales, market share, regional outlook, competitor analysis and geographical sales. Pitch your topic with ease and precision using this International Sales Performance Dashboard With Regional Market Report Inspiration PDF. This layout presents information on Regional Outlook, Sales And Forecast, Market Share Overview. It is also available for immediate download and adjustment. So, changes can be made in the color, design, graphics or any other component to create a unique layout.

Manufactured Products Sales Performance Monitoring Dashboard Information PDF
This slide shows the dashboard the data related to the sales performance of the products manufactured by the organization in order to effectively measure and monitor the performance of the sales team. It shows details related to revenue generated and units sold etc.Pitch your topic with ease and precision using this Manufactured Products Sales Performance Monitoring Dashboard Information PDF. This layout presents information on Monthly Revenue, Manufactured Products, Sales Performance Monitoring. It is also available for immediate download and adjustment. So, changes can be made in the color, design, graphics or any other component to create a unique layout.
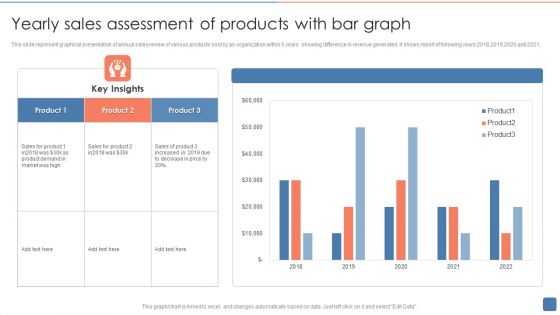
Yearly Sales Assessment Of Products With Bar Graph Structure PDF
This slide represent graphical presentation of annual sales review of various products sold by an organization within 5 years showing difference in revenue generated .It shows report of following years 2018,2019,2020,and 2021. Showcasing this set of slides titled Yearly Sales Assessment Of Products With Bar Graph Structure PDF. The topics addressed in these templates are Product, Sales Of Product, Product Demand. All the content presented in this PPT design is completely editable. Download it and make adjustments in color, background, font etc. as per your unique business setting.
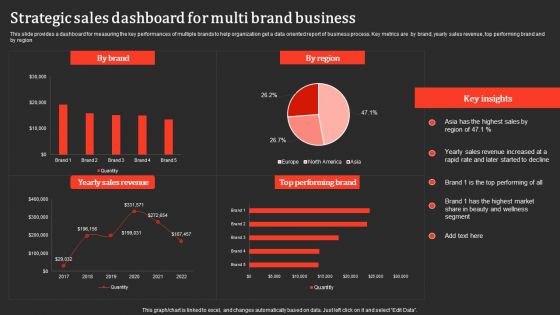
Strategic Sales Dashboard For Multi Brand Business Professional PDF
This slide provides a dashboard for measuring the key performances of multiple brands to help organization get a data oriented report of business process. Key metrics are by brand, yearly sales revenue, top performing brand and by region. Pitch your topic with ease and precision using this Strategic Sales Dashboard For Multi Brand Business Professional PDF. This layout presents information on Yearly Sales Revenue, Performing Brand. It is also available for immediate download and adjustment. So, changes can be made in the color, design, graphics or any other component to create a unique layout.
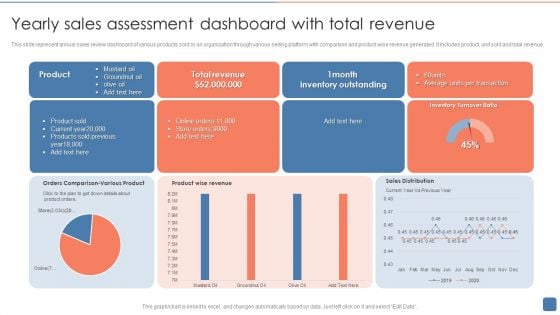
Yearly Sales Assessment Dashboard With Total Revenue Introduction PDF
This slide represent annual sales review dashboard of various products sold by an organization through various selling platform with comparison and product wise revenue generated .It includes product, unit sold and total revenue. Showcasing this set of slides titled Yearly Sales Assessment Dashboard With Total Revenue Introduction PDF. The topics addressed in these templates are Product Sold, Inventory Outstanding, Average. All the content presented in this PPT design is completely editable. Download it and make adjustments in color, background, font etc. as per your unique business setting.
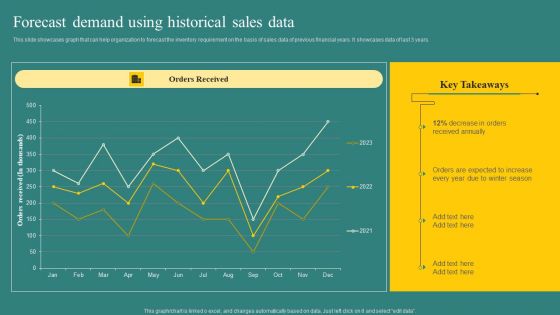
Forecast Demand Using Historical Sales Data Background PDF
This slide showcases graph that can help organization to forecast the inventory requirement on the basis of sales data of previous financial years. It showcases data of last 3 years. Take your projects to the next level with our ultimate collection of Forecast Demand Using Historical Sales Data Background PDF. Slidegeeks has designed a range of layouts that are perfect for representing task or activity duration, keeping track of all your deadlines at a glance. Tailor these designs to your exact needs and give them a truly corporate look with your own brand colors they will make your projects stand out from the rest.
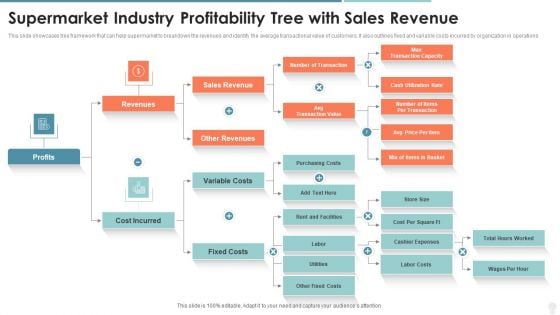
Supermarket Industry Profitability Tree With Sales Revenue Portrait PDF
This slide showcases tree framework that can help supermarket to breakdown the revenues and identify the average transactional value of customers. It also outlines fixed and variable costs incurred by organization in operations. Persuade your audience using this supermarket industry profitability tree with sales revenue portrait pdf. This PPT design covers three stages, thus making it a great tool to use. It also caters to a variety of topics including revenues, sales revenue, number of transaction. Download this PPT design now to present a convincing pitch that not only emphasizes the topic but also showcases your presentation skills.

Gold Chart Business PowerPoint Template 0810
3D gold growth graph with world map. All in gold. Take control with our Gold Chart Business PowerPoint Template 0810. Do not be fatalistic in your approach.
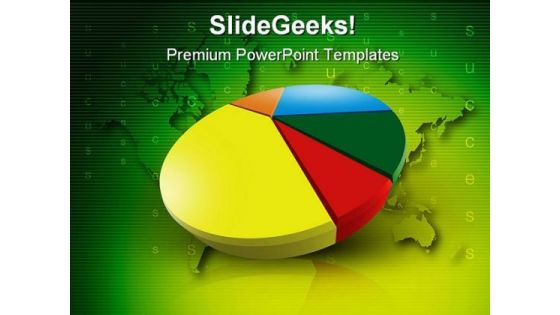
Pie Chart Business People PowerPoint Template 0810
This is a 3d model of a business success Beam up your ideam with our Pie Chart Business People PowerPoint Template 0810. You will come out on top.
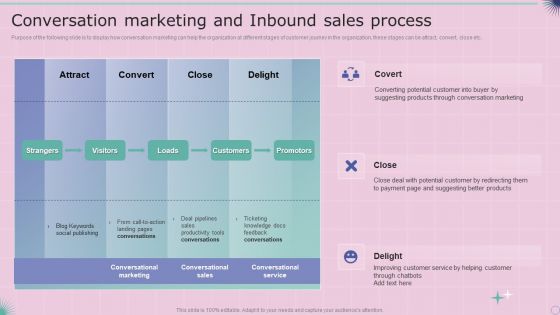
Conversation Marketing And Inbound Sales Process Formats PDF
Purpose of the following slide is to display how conversation marketing can help the organization at different stages of customer journey in the organization, these stages can be attract, convert, close etc. Deliver an awe inspiring pitch with this creative Conversation Marketing And Inbound Sales Process Formats PDF bundle. Topics like Potential Customer, Conversation Marketing, Customer Service can be discussed with this completely editable template. It is available for immediate download depending on the needs and requirements of the user.

Sales Force Structure Ppt PowerPoint Presentation Ideas Slide Download
This is a sales force structure ppt powerpoint presentation ideas slide download. This is a three stage process. The stages in this process are national sales manager, zonal sales manager, area sales manager, sales officer.
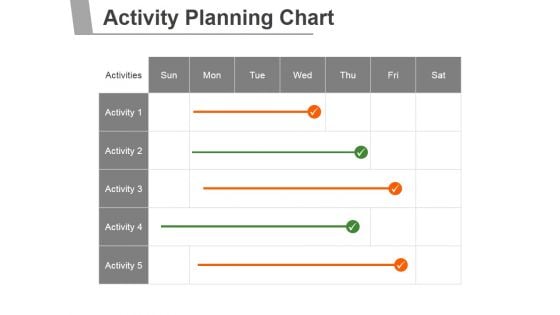
Activity Planning Chart Ppt PowerPoint Presentation Shapes
This is a activity planning chart ppt powerpoint presentation shapes. This is a seven stage process. The stages in this process are business, marketing, management, chart, planning.
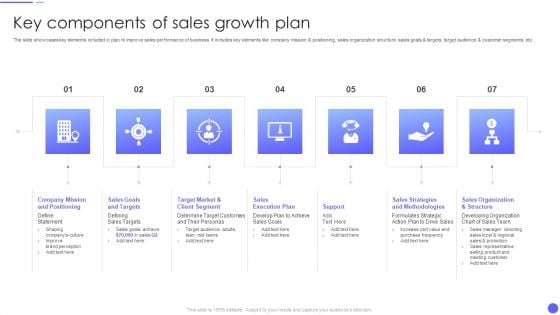
Key Components Of Sales Growth Plan Clipart PDF
The slide showcases key elements included in plan to improve sales performance of business. It includes key elements like company mission positioning, sales organization structure, sales goals targets, target audience customer segments, etc.Persuade your audience using this Key Components Of Sales Growth Plan Clipart PDF This PPT design covers seven stages, thus making it a great tool to use. It also caters to a variety of topics including Sales Strategies, Sales Organization, Determine Target Download this PPT design now to present a convincing pitch that not only emphasizes the topic but also showcases your presentation skills.
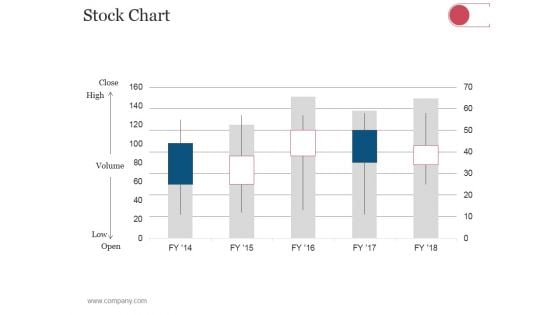
Stock Chart Ppt PowerPoint Presentation Diagram Ppt
This is a stock chart ppt powerpoint presentation diagram ppt. This is a five stage process. The stages in this process are business, strategy, analysis, marketing, stock chart.
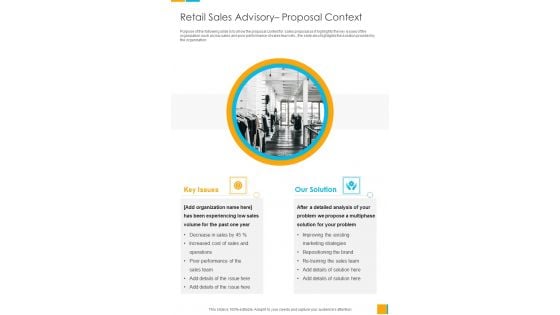
Retail Sales Advisory Proposal Context One Pager Sample Example Document
Purpose of the following slide is to show the proposal context for sales proposal as it highlights the key issues of the organization such as low sales and poor performance of sales team etc., the slide also highlights the solution provided by the organization. Presenting you an exemplary Retail Sales Advisory Proposal Context One Pager Sample Example Document. Our one-pager comprises all the must-have essentials of an inclusive document. You can edit it with ease, as its layout is completely editable. With such freedom, you can tweak its design and other elements to your requirements. Download this Retail Sales Advisory Proposal Context One Pager Sample Example Document brilliant piece now.

Scatter Chart Ppt PowerPoint Presentation Examples
This is a scatter chart ppt powerpoint presentation examples. This is a eight stage process. The stages in this process are business, strategy, marketing, success, profit in sales.
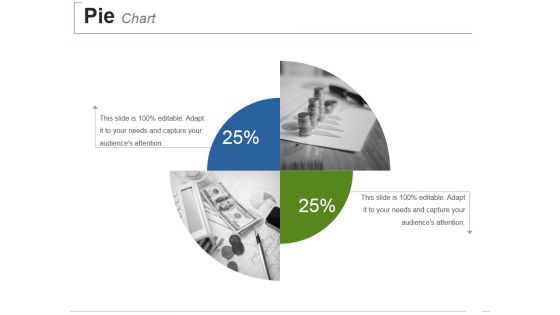
Pie Chart Ppt PowerPoint Presentation Styles Inspiration
This is a pie chart ppt powerpoint presentation styles inspiration. This is a two stage process. The stages in this process are finance, management, marketing, success, business, analysis.
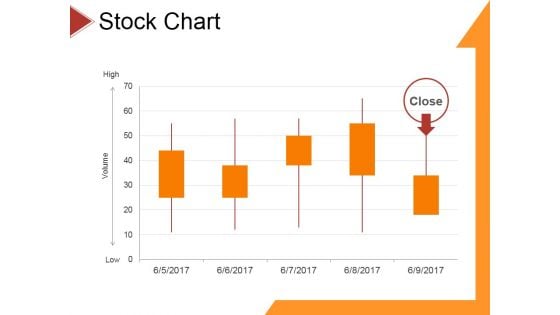
Stock Chart Ppt PowerPoint Presentation File Ideas
This is a stock chart ppt powerpoint presentation file ideas. This is a five stage process. The stages in this process are business, strategy, analysis, pretention, finance.


 Continue with Email

 Home
Home


