Scoring Chart
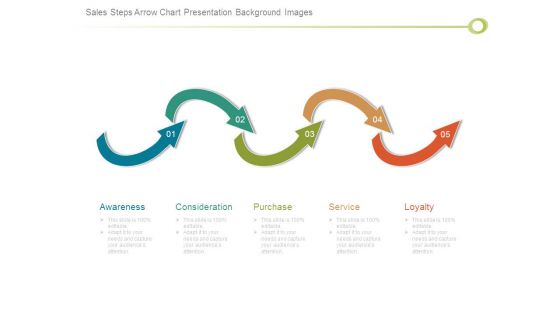
Sales Steps Arrow Chart Presentation Background Images
This is a sales steps arrow chart presentation background images. This is a five stage process. The stages in this process are awareness, consideration, purchase, service, loyalty.

X And R Analysis Chart Ppt Presentation
This is a x and r analysis chart ppt presentation. This is a two stage process. The stages in this process are subtitle, ucl, lcl, option.
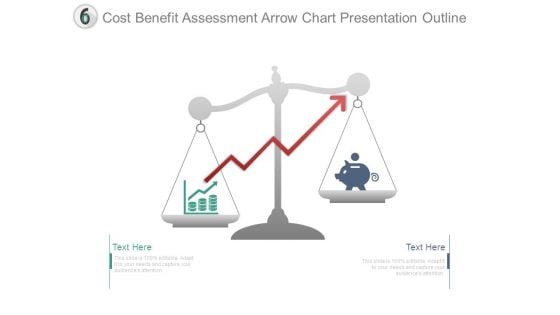
Cost Benefit Assessment Arrow Chart Presentation Outline
This is a cost benefit assessment arrow chart presentation outline. This is a two stage process. The stages in this process are compare, arrows, finance, money, strategy.

Possible Solutions Puzzle Chart Good Ppt Example
This is a possible solutions puzzle chart good ppt example. This is a nine stage process. The stages in this process are solution, puzzle, key, strategy, game, marketing.
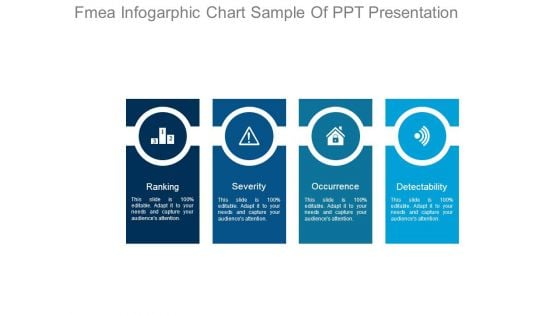
Fmea Infogarphic Chart Sample Of Ppt Presentation
This is a fmea infogarphic chart sample of ppt presentation. This is a four stage process. The stages in this process are ranking, severity, occurrence, detectability.
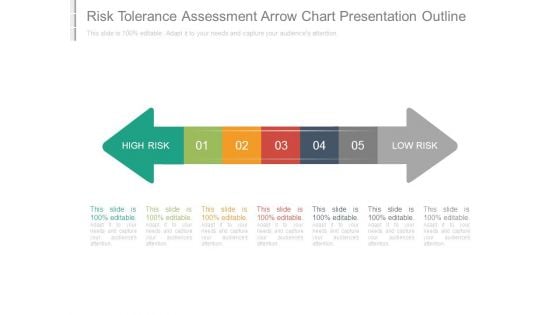
Risk Tolerance Assessment Arrow Chart Presentation Outline
This is a risk tolerance assessment arrow chart presentation outline. This is a five stage process. The stages in this process are high risk, low risk.
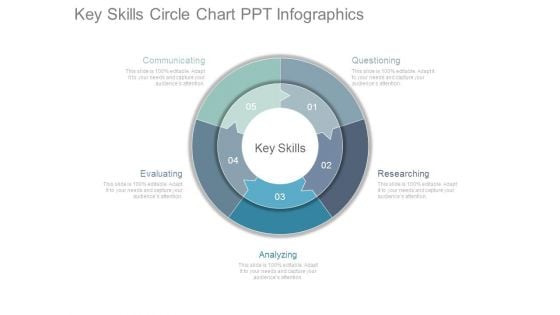
Key Skills Circle Chart Ppt Infographics
This is a key skills circle chart ppt infographics. This is a five stage process. The stages in this process are questioning, researching, analyzing, evaluating, communicating, key skills.
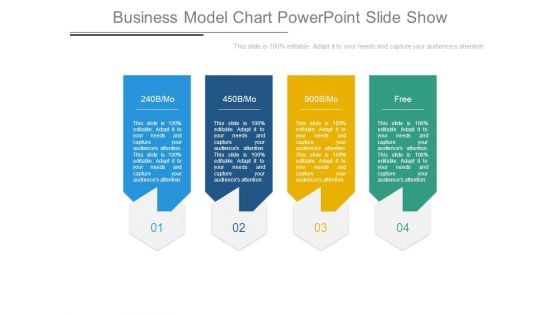
Business Model Chart Powerpoint Slide Show
This is a business model chart powerpoint slide show. This is a four stage process. The stages in this process are free.
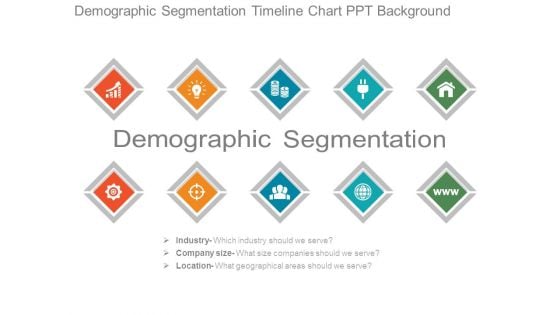
Demographic Segmentation Timeline Chart Ppt Background
This is a demographic segmentation timeline chart ppt background. This is a five stage process. The stages in this process are industry, company size, location.
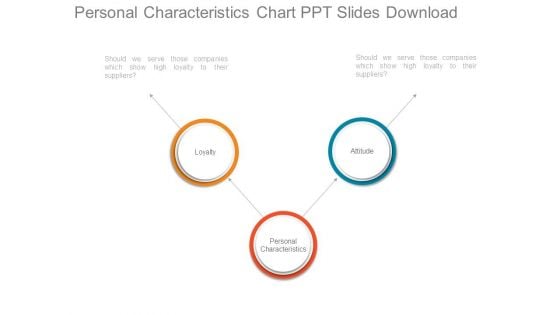
Personal Characteristics Chart Ppt Slides Download
This is a personal characteristics chart ppt slides download. This is a two stage process. The stages in this process are loyalty, attitude, personal characteristics.
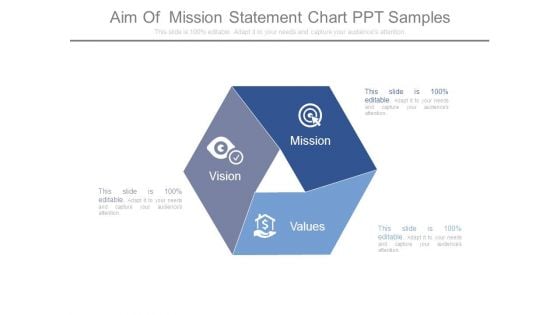
Aim Of Mission Statement Chart Ppt Samples
This is a aim of mission statement chart ppt samples. This is a three stage process. The stages in this process are vision, values, mission.
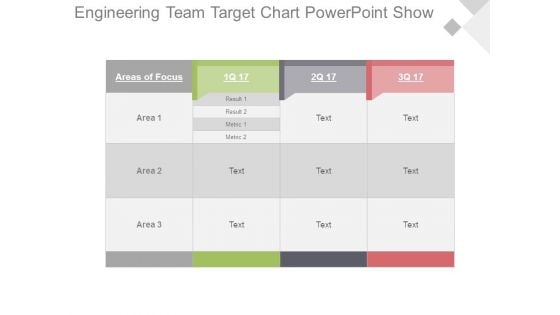
Engineering Team Target Chart Powerpoint Show
This is a engineering team target chart powerpoint show. This is a four stage process. The stages in this process are areas of focus, result, metric, area.
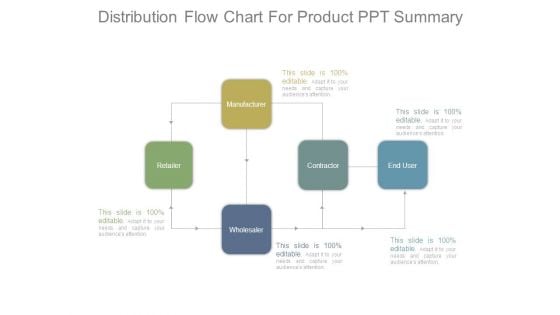
Distribution Flow Chart For Product Ppt Summary
This is a distribution flow chart for product ppt summary. This is a five stage process. The stages in this process are retailer, manufacturer, contractor, end user, wholesaler.
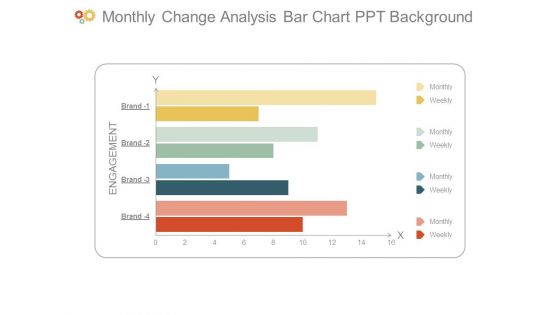
Monthly Change Analysis Bar Chart Ppt Background
This is a monthly change analysis bar chart ppt background. This is a four stage process. The stages in this process are engagement, monthly, weekly, brand.
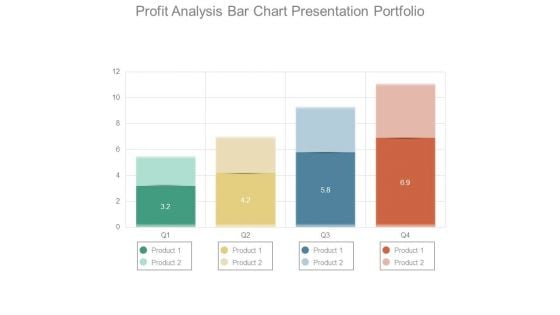
Profit Analysis Bar Chart Presentation Portfolio
This is a profit analysis bar chart presentation portfolio. This is a four stage process. The stages in this process are product.
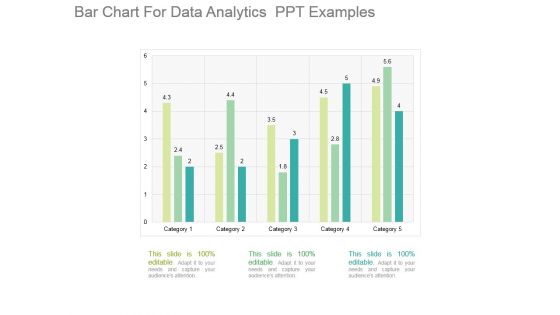
Bar Chart For Data Analytics Ppt Examples
This is a bar chart for data analytics ppt examples. This is a five stage process. The stages in this process are category.
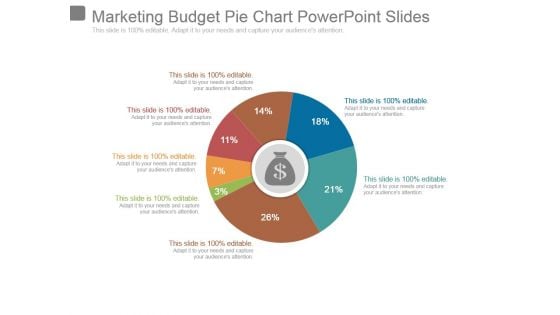
Marketing Budget Pie Chart Powerpoint Slides
This is a marketing budget pie chart powerpoint slides. This is a seven stage process. The stages in this process are business, marketing, strategy, finance, percentage.
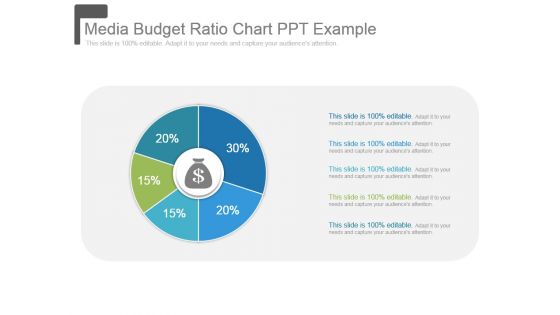
Media Budget Ratio Chart Ppt Example
This is a media budget ratio chart ppt example. This is a five stage process. The stages in this process are strategy, finance, percentage, business, marketing.
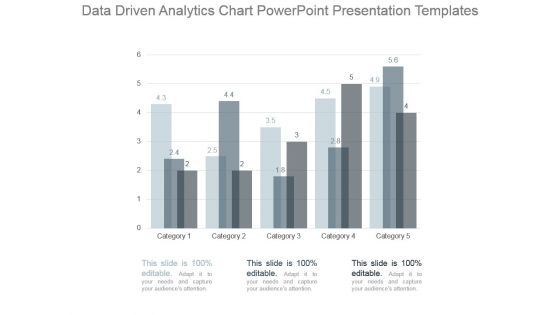
Data Driven Analytics Chart Powerpoint Presentation Templates
This is a data driven analytics chart powerpoint presentation templates. This is a five stage process. The stages in this process are category.
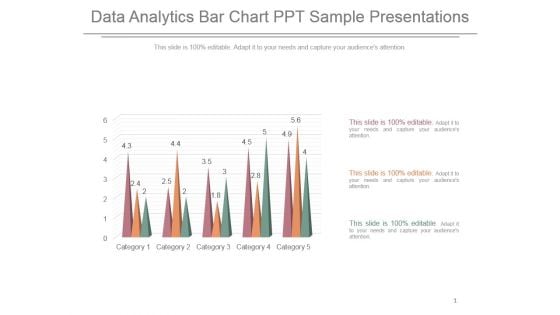
Data Analytics Bar Chart Ppt Sample Presentations
This is a data analytics bar chart ppt sample presentations. This is a five stage process. The stages in this process are category.
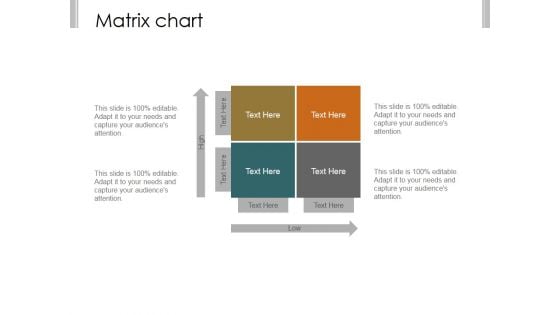
Matrix Chart Ppt PowerPoint Presentation Show
This is a matrix chart ppt powerpoint presentation show. This is a four stage process. The stages in this process are business, strategy, marketing, analysis.
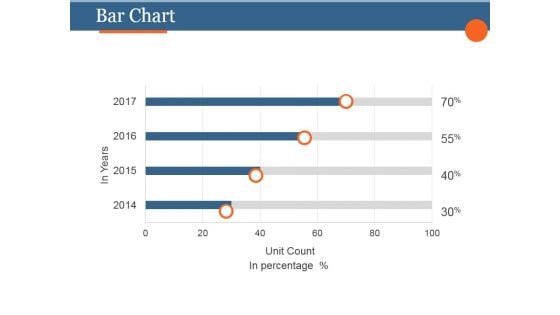
Bar Chart Ppt PowerPoint Presentation Layouts
This is a bar chart ppt powerpoint presentation layouts. This is a four stage process. The stages in this process are business, strategy, marketing, analysis, finance.
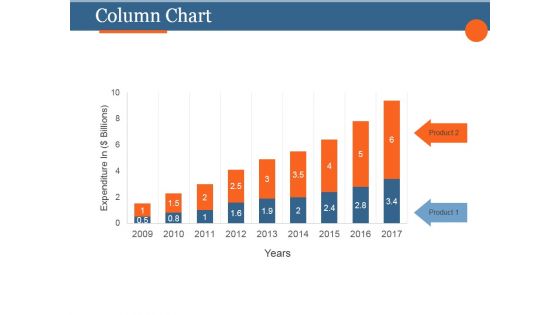
Column Chart Ppt PowerPoint Presentation Designs Download
This is a column chart ppt powerpoint presentation designs download. This is a two stage process. The stages in this process are business, strategy, marketing, analysis, growth.

Donut Chart Ppt PowerPoint Presentation Ideas
This is a donut chart ppt powerpoint presentation ideas. This is a six stage process. The stages in this process are business, strategy, marketing, analysis, finance.
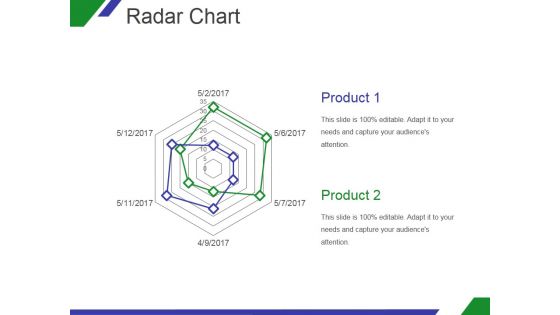
Radar Chart Ppt PowerPoint Presentation Template
This is a radar chart ppt powerpoint presentation template. This is a two stage process. The stages in this process are product, marketing, business, shape.
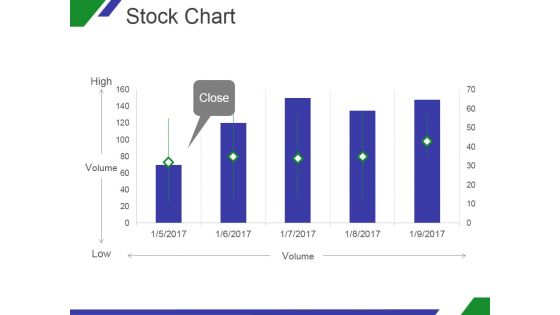
Stock Chart Ppt PowerPoint Presentation Slides
This is a stock chart ppt powerpoint presentation slides. This is a five stage process. The stages in this process are close, volume, high, low.
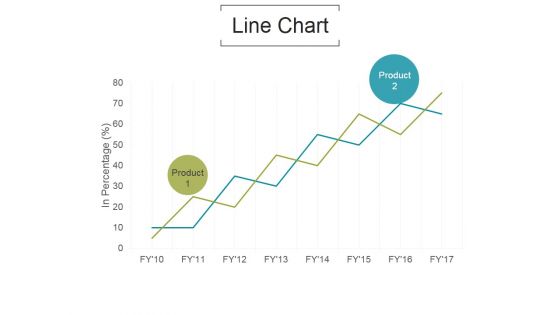
Line Chart Ppt PowerPoint Presentation Model
This is a line chart ppt powerpoint presentation model. This is a two stage process. The stages in this process are in percentage, product, business.
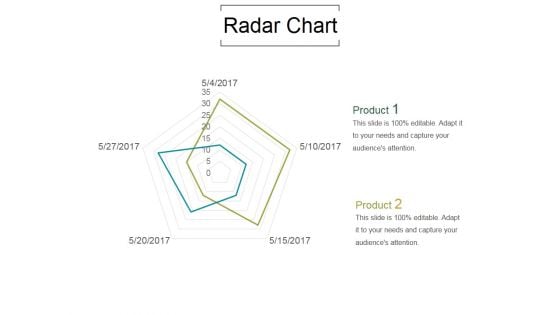
Radar Chart Ppt PowerPoint Presentation Samples
This is a radar chart ppt powerpoint presentation samples. This is a two stage process. The stages in this process are product, marketing, business.
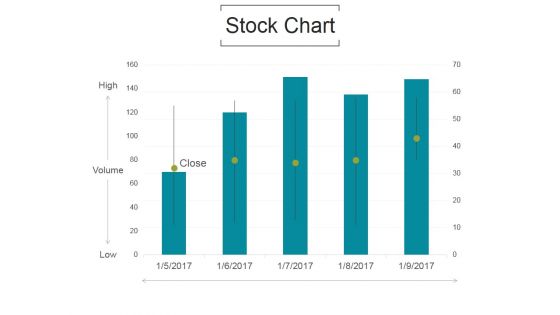
Stock Chart Ppt PowerPoint Presentation Example File
This is a stock chart ppt powerpoint presentation example file. This is a five stage process. The stages in this process are volume, high, low, close.
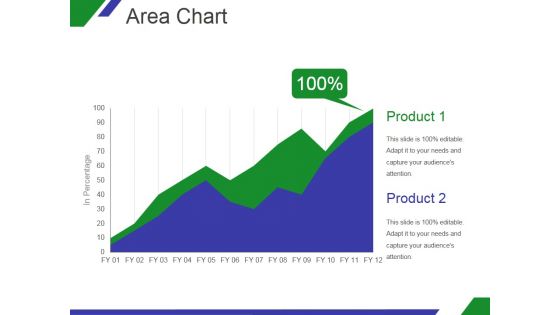
Area Chart Ppt PowerPoint Presentation Designs
This is a area chart ppt powerpoint presentation designs. This is a two stage process. The stages in this process are product, graph, in percentage, growth, business.
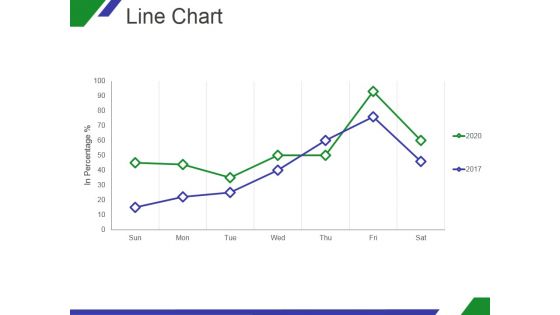
Line Chart Ppt PowerPoint Presentation Shapes
This is a line chart ppt powerpoint presentation shapes. This is a two stage process. The stages in this process are growth, in percentage, sun, mon, tue, wed.
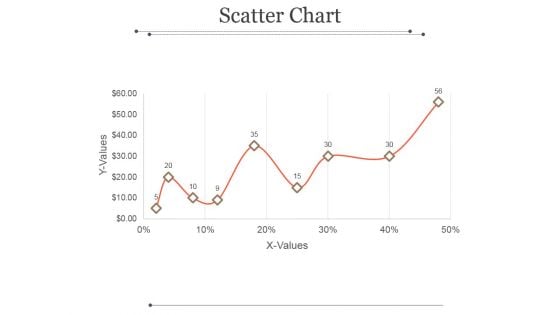
Scatter Chart Ppt PowerPoint Presentation Example
This is a scatter chart ppt powerpoint presentation example. This is a nine stage process. The stages in this process are x values, y values, business, growth, success.
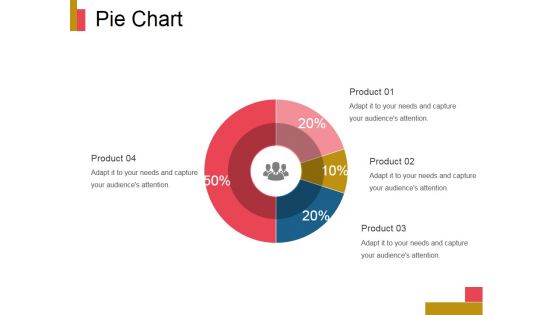
Pie Chart Ppt PowerPoint Presentation Design Ideas
This is a pie chart ppt powerpoint presentation design ideas. This is a four stage process. The stages in this process are product, finance, business, marketing, pie.
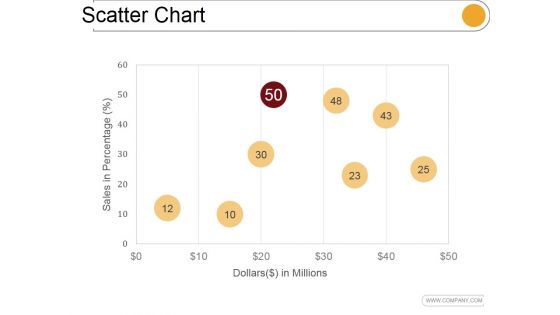
Scatter Chart Ppt PowerPoint Presentation Slide Download
This is a scatter chart ppt powerpoint presentation slide download. This is a eight stage process. The stages in this process are dollars, sales in percentage, business, marketing.

Stock Chart Ppt PowerPoint Presentation Inspiration
This is a stock chart ppt powerpoint presentation inspiration. This is a five stage process. The stages in this process are high, volume, low, close.
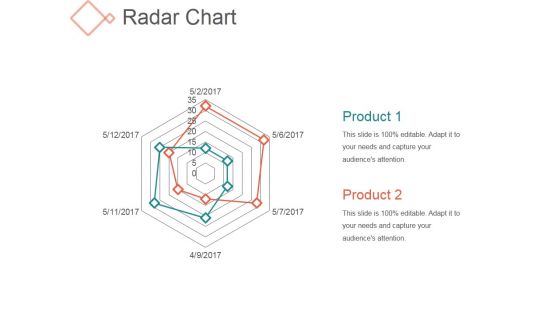
Radar Chart Ppt PowerPoint Presentation Influencers
This is a radar chart ppt powerpoint presentation influencers. This is a two stage process. The stages in this process are business, marketing, product, shapes.

Stock Chart Ppt PowerPoint Presentation Professional
This is a stock chart ppt powerpoint presentation professional. This is a five stage process. The stages in this process are high, volume, low, close.
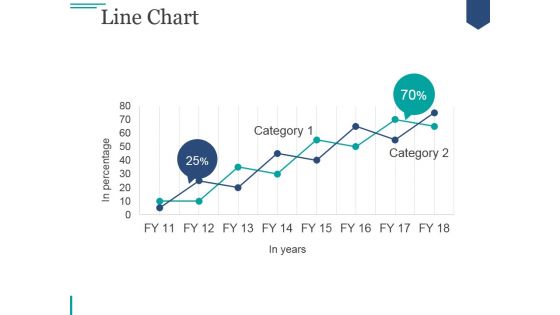
Line Chart Ppt PowerPoint Presentation Tips
This is a line chart ppt powerpoint presentation tips. This is a two stage process. The stages in this process are business, marketing, strategy, success, growth.

Stock Chart Ppt PowerPoint Presentation Topics
This is a stock chart ppt powerpoint presentation topics. This is a five stage process. The stages in this process are high, volume, low, volume.
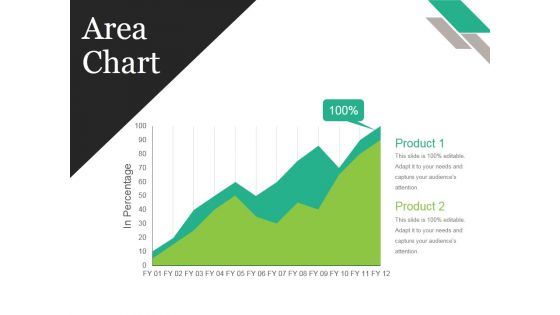
Area Chart Ppt PowerPoint Presentation Summary Graphics
This is a area chart ppt powerpoint presentation summary graphics. This is a two stage process. The stages in this process are business, strategy, marketing, analysis, finance, growth.
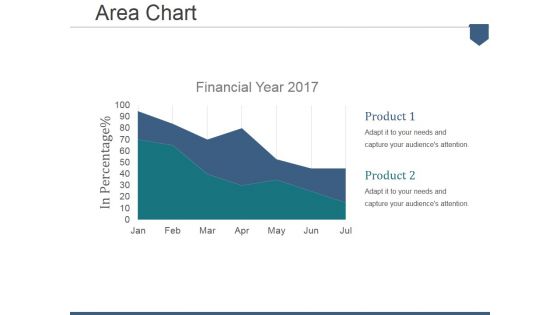
Area Chart Ppt PowerPoint Presentation Summary Example
This is a area chart ppt powerpoint presentation summary example. This is a two stage process. The stages in this process are financial year, in percentage, product.
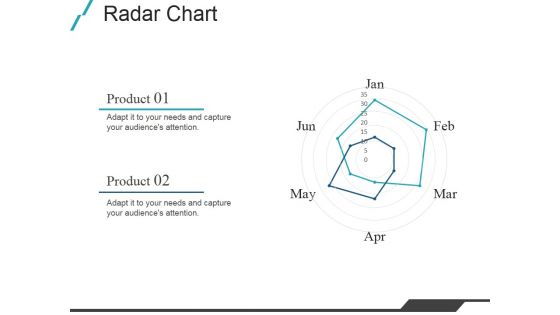
Radar Chart Ppt PowerPoint Presentation Show Sample
This is a radar chart ppt powerpoint presentation show sample. This is a five stage process. The stages in this process are product, business, marketing, shapes.
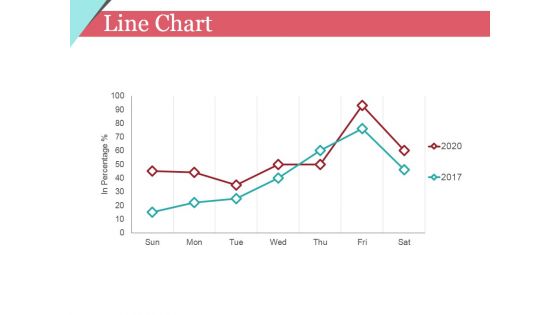
Line Chart Ppt PowerPoint Presentation Infographics Ideas
This is a line chart ppt powerpoint presentation infographics ideas. This is a two stage process. The stages in this process are growth, graph, marketing.
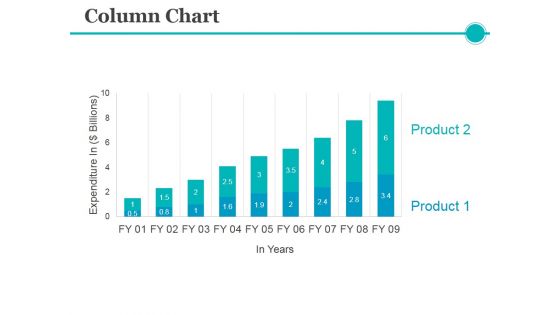
Column Chart Ppt PowerPoint Presentation Inspiration Visuals
This is a column chart ppt powerpoint presentation inspiration visuals. This is a nine stage process. The stages in this process are business, marketing, product, expenditure.
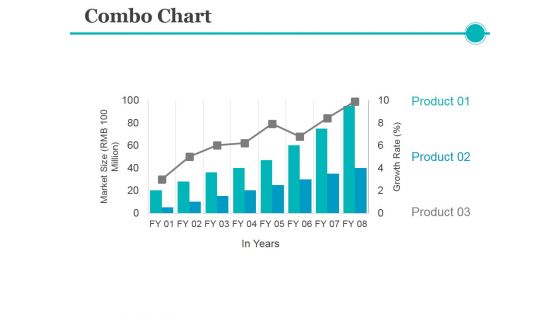
Combo Chart Ppt PowerPoint Presentation Pictures Layouts
This is a combo chart ppt powerpoint presentation pictures layouts. This is a eight stage process. The stages in this process are product, growth rate, market size, years.
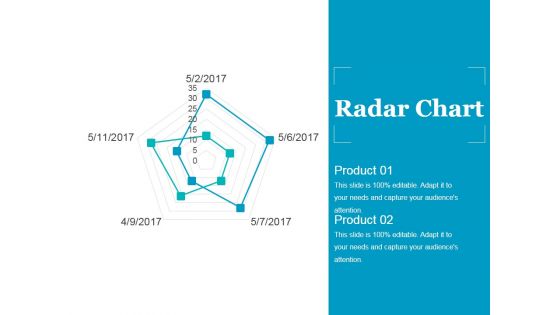
Radar Chart Ppt PowerPoint Presentation Model Tips
This is a radar chart ppt powerpoint presentation model tips. This is a five stage process. The stages in this process are product, business, marketing, shapes.
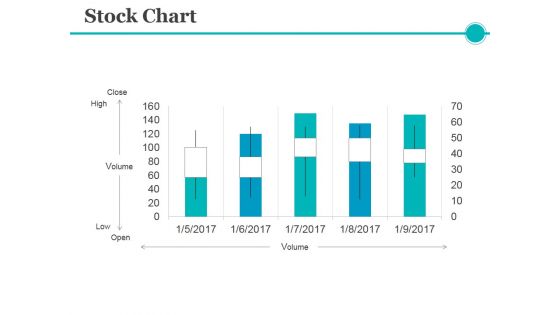
Stock Chart Ppt PowerPoint Presentation Ideas Example
This is a stock chart ppt powerpoint presentation ideas example. This is a five stage process. The stages in this process are volume, close, high, low, open.
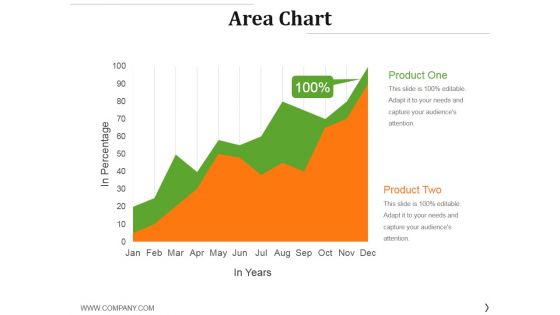
Area Chart Ppt PowerPoint Presentation Gallery Inspiration
This is a area chart ppt powerpoint presentation gallery inspiration. This is a two stage process. The stages in this process are product, growth, success, graph, finance.
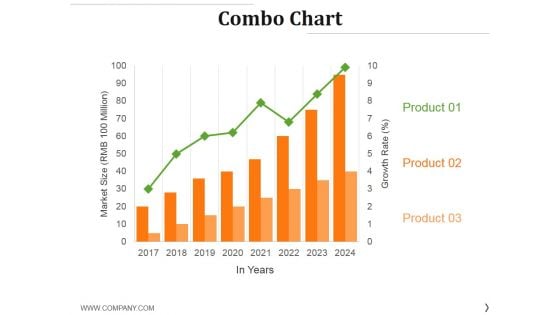
Combo Chart Ppt PowerPoint Presentation File Model
This is a combo chart ppt powerpoint presentation file model. This is a eight stage process. The stages in this process are product, year, market size, business, marketing.
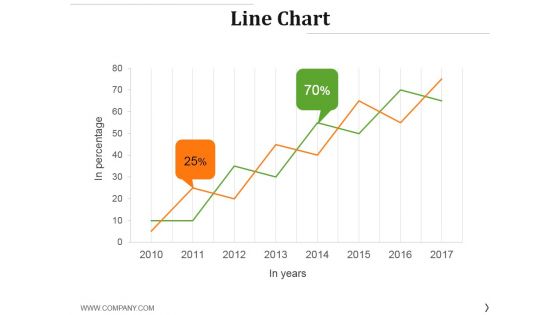
Line Chart Ppt PowerPoint Presentation Professional Template
This is a line chart ppt powerpoint presentation professional template. This is a two stage process. The stages in this process are business, finance, percentage, growth, success.
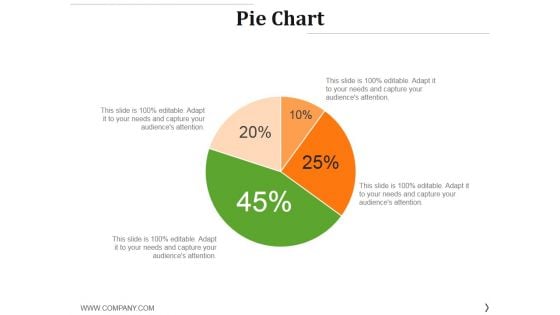
Pie Chart Ppt PowerPoint Presentation Layouts Shapes
This is a pie chart ppt powerpoint presentation layouts shapes. This is a four stage process. The stages in this process are pie, finance, percentage, business, marketing.
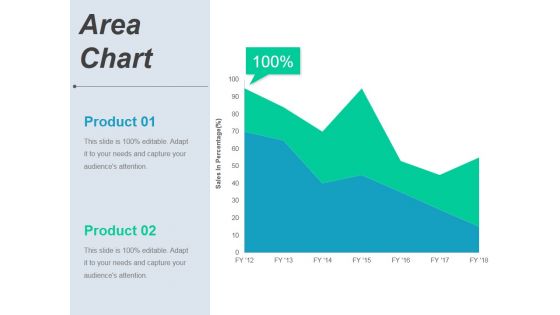
Area Chart Ppt PowerPoint Presentation Pictures Visuals
This is a area chart ppt powerpoint presentation pictures visuals. This is a two stage process. The stages in this process are product, business, finance, marketing.
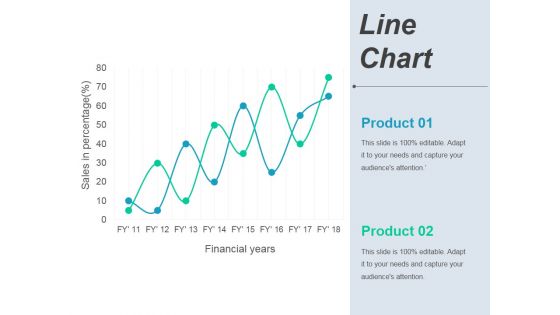
Line Chart Ppt PowerPoint Presentation Ideas Deck
This is a line chart ppt powerpoint presentation ideas deck. This is a two stage process. The stages in this process are business, marketing, finance, growth.
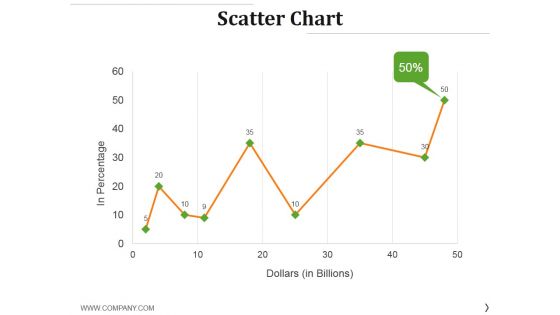
Scatter Chart Ppt PowerPoint Presentation Layouts Gridlines
This is a scatter chart ppt powerpoint presentation layouts gridlines. This is a nine stage process. The stages in this process are in percentage, dollars, growth, success, finance.

Stock Chart Ppt PowerPoint Presentation Ideas Brochure
This is a stock chart ppt powerpoint presentation ideas brochure. This is a five stage process. The stages in this process are high, volume, low, close.
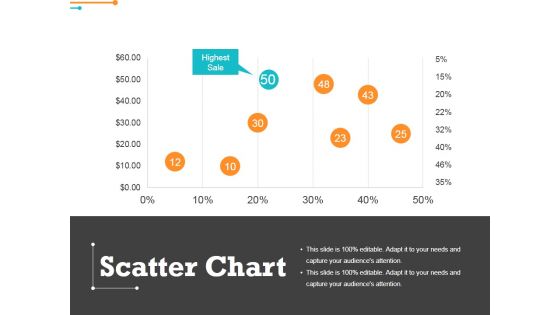
Scatter Chart Ppt PowerPoint Presentation Outline Graphics
This is a scatter chart ppt powerpoint presentation outline graphics. This is a eight stage process. The stages in this process are highest sale, percentage, finance, business.
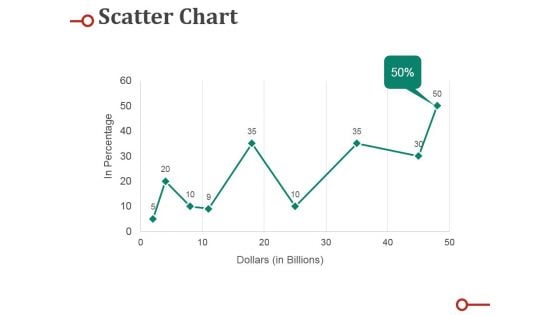
Scatter Chart Ppt PowerPoint Presentation Professional Deck
This is a scatter chart ppt powerpoint presentation professional deck. This is a nine stage process. The stages in this process are percentage, business, marketing, graph, line.

Line Chart Ppt PowerPoint Presentation Model Visuals
This is a line chart ppt powerpoint presentation model visuals. This is a two stage process. The stages in this process are business, strategy, analysis, pretention, growth strategy.
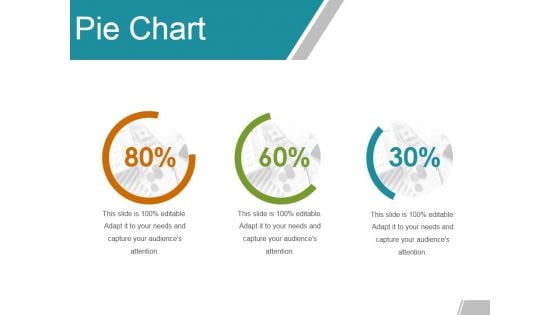
Pie Chart Ppt PowerPoint Presentation Summary Slide
This is a pie chart ppt powerpoint presentation summary slide. This is a three stage process. The stages in this process are percentage, finance, marketing, business.
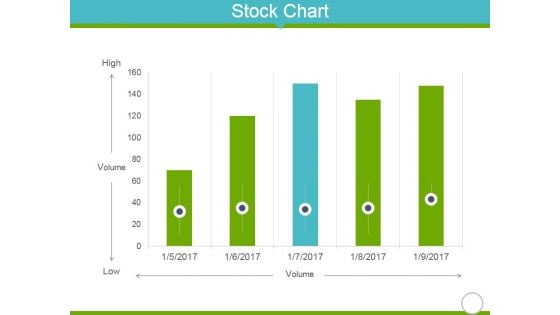
Stock Chart Ppt PowerPoint Presentation Portfolio Infographics
This is a stock chart ppt powerpoint presentation portfolio infographics. This is a five stage process. The stages in this process are high, volume, low, finance, business.


 Continue with Email

 Home
Home


