Scoring Chart
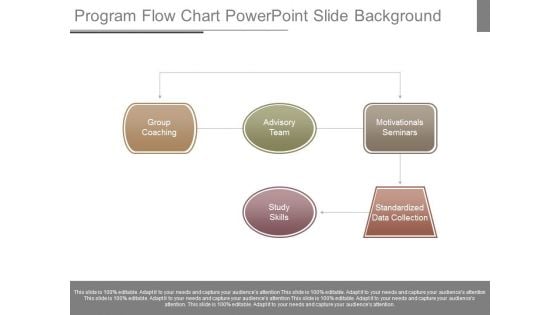
Program Flow Chart Powerpoint Slide Background
This is a program flow chart powerpoint slide background. This is a five stage process. The stages in this process are group coaching, advisory team, study skills, motivationals seminars, standardized data collection.
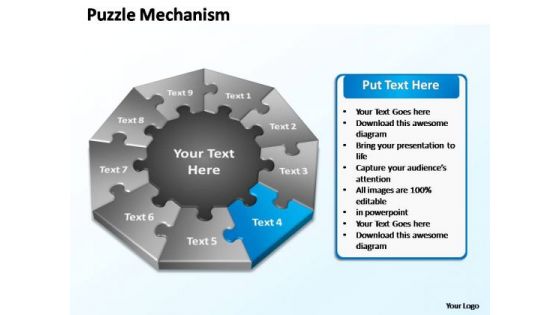
PowerPoint Layout Chart Puzzle Mechanism Ppt Slide
PowerPoint Layout Chart Puzzle Mechanism PPT Slide-The basic stages are in place. Various threads are joining up and being stitched together providing necessary strength Now you have to take the last leap. Illustrate your ideas and imprint them in the minds of your team with this template. Feel the buzz as they comprehend your plan to get the entire act together. Watch their eyes light up with enthusiasm as they see the dream emerge.-PowerPoint Layout Chart Puzzle Mechanism PPT Slide Concentrate on the important stuff with our PowerPoint Layout Chart Puzzle Mechanism Ppt Slide. You will come out on top.
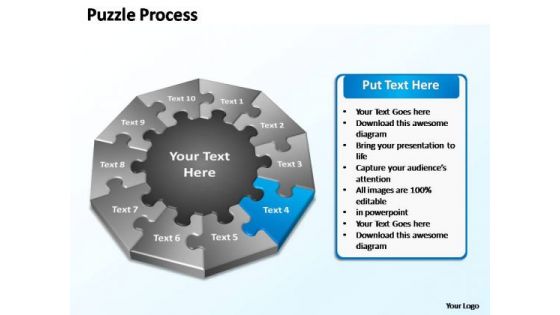
PowerPoint Presentation Chart Puzzle Business Ppt Template
PowerPoint Presentation Chart Puzzle Business PPT Template-The basic stages are in place. Various threads are joining up and being stitched together providing necessary strength Now you have to take the last leap. Illustrate your ideas and imprint them in the minds of your team with this template. Feel the buzz as they comprehend your plan to get the entire act together. Watch their eyes light up with enthusiasm as they see the dream emerge.-PowerPoint Presentation Chart Puzzle Business PPT Template Get appropriate assistance anytimewith our PowerPoint Presentation Chart Puzzle Business Ppt Template. Be assured of access from anywhere.
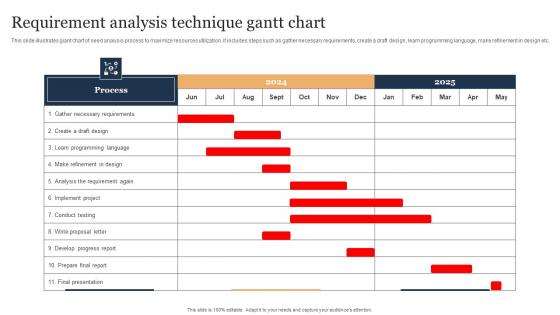
Requirement Analysis Technique Gantt Chart Guidelines Pdf
This slide illustrates giant chart of need analysis process to maximize resources utilization. It includes steps such as gather necessary requirements, create a draft design, learn programming language, make refinement in design etc. Pitch your topic with ease and precision using this Requirement Analysis Technique Gantt Chart Guidelines Pdf. This layout presents information on Requirement Analysis Technique, Resources Utilization, Learn Programming Language. It is also available for immediate download and adjustment. So, changes can be made in the color, design, graphics or any other component to create a unique layout. This slide illustrates giant chart of need analysis process to maximize resources utilization. It includes steps such as gather necessary requirements, create a draft design, learn programming language, make refinement in design etc.
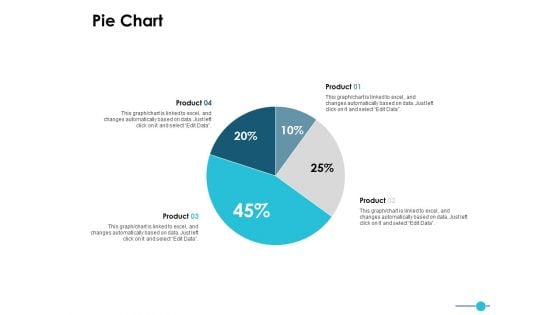
Pie Chart Finance Ppt PowerPoint Presentation Deck
This is a pie chart finance ppt powerpoint presentation deck. The topics discussed in this diagram are marketing, business, management, planning, strategy This is a completely editable PowerPoint presentation, and is available for immediate download.
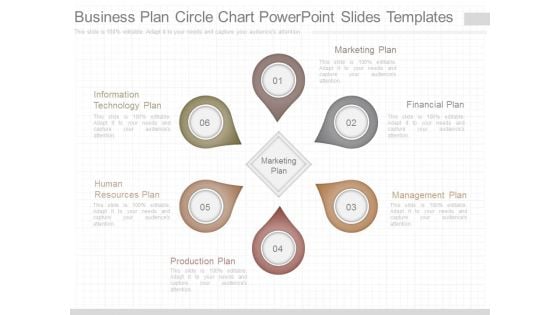
Business Plan Circle Chart Powerpoint Slides Templates
This is a business plan circle chart powerpoint slides templates. This is a six stage process. The stages in this process are information technology plan, human resources plan, production plan, marketing plan, marketing plan, financial plan, management plan.
Supply Chain Flow Chart Template Ppt Icon
This is a supply chain flow chart template ppt icon. This is a five stage process. The stages in this process are retailer, customer, supplier, manufacturer, manufacturing units, distributor, supply chain management.
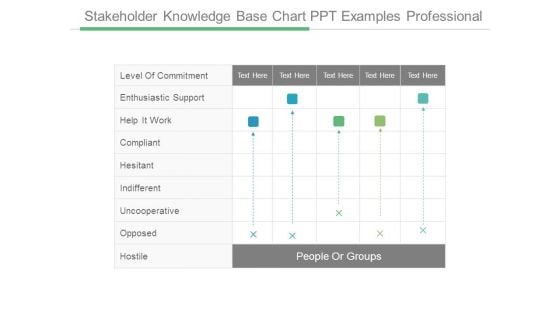
Stakeholder Knowledge Base Chart Ppt Examples Professional
This is a stakeholder knowledge base chart ppt examples professional. This is a five stage process. The stages in this process are people or groups, level of commitment, enthusiastic support, help it work, compliant, hesitant, indifferent, uncooperative, opposed, hostile.
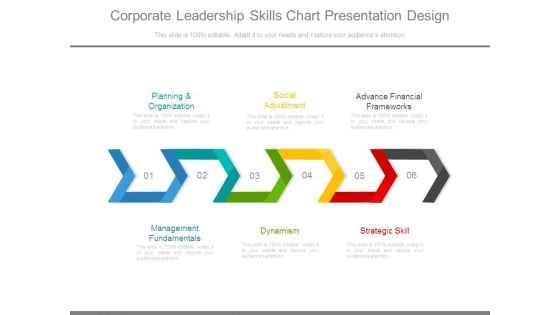
Corporate Leadership Skills Chart Presentation Design
This is a corporate leadership skills chart presentation design. This is a six stage process. The stages in this process are planning and organization, social adjustment, advance financial frameworks, management fundamentals, dynamism, strategic skill.
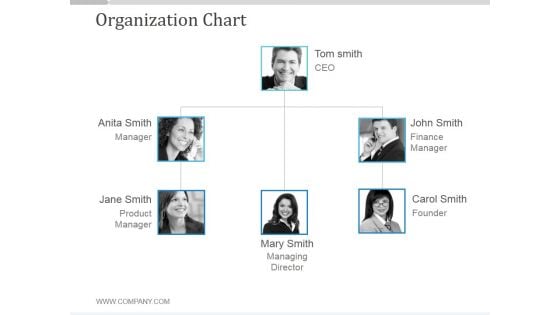
Organization Chart Ppt PowerPoint Presentation Backgrounds
This is a organization chart ppt powerpoint presentation backgrounds. This is a three stage process. The stages in this process are tom smith ceo, john smith finance manager, john smith finance manager, john smit finance manager.
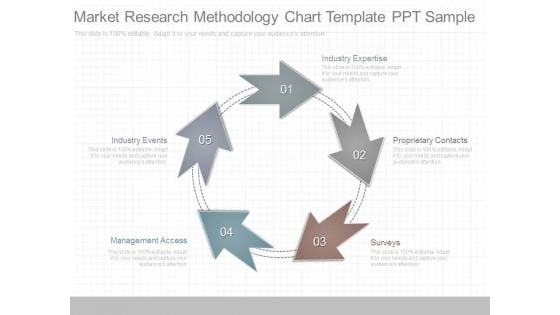
Market Research Methodology Chart Template Ppt Sample
This is a market research methodology chart template ppt sample. This is a five stage process. The stages in this process are industry expertise, proprietary contacts, surveys, industry events, management access.
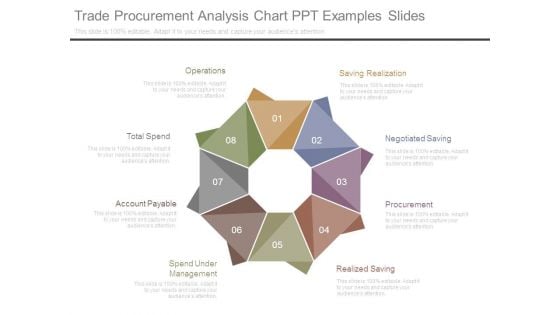
Trade Procurement Analysis Chart Ppt Examples Slides
This is a trade procurement analysis chart ppt examples slides. This is a eight stage process. The stages in this process are operations, total spend, account payable, spend under management, realized saving, procurement, negotiated saving, saving realization.
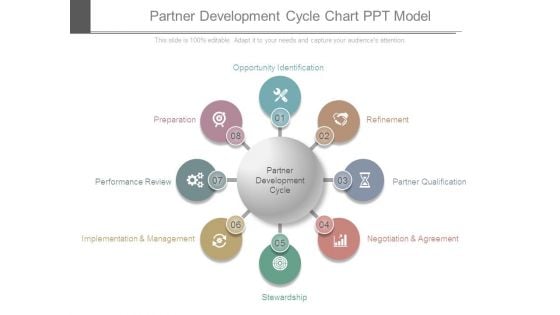
Partner Development Cycle Chart Ppt Model
This is a partner development cycle chart ppt model. This is a eight stage process. The stages in this process are opportunity identification, refinement, partner qualification, negotiation and agreement, stewardship, implementation and management, performance review, preparation.
Hierarchy Chart Powerpoint Slide Background Picture
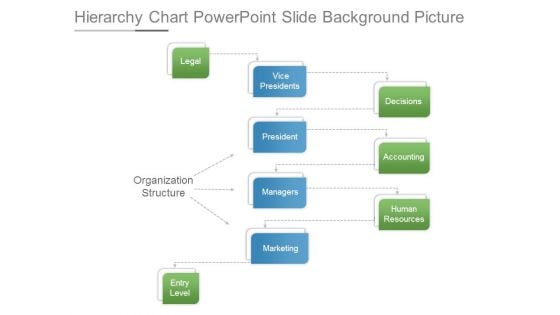
This is a hierarchy chart powerpoint slide background picture. This is a eight stage process. The stages in this process are organization structure, legal, vice presidents, decisions, president, managers, marketing, accounting, human resources, entry level.
Area Chart Ppt PowerPoint Presentation Gallery Icons
This is a area chart ppt powerpoint presentation gallery icons. This is a two stage process. The stages in this process are financial year, sales in percentage, product, finance, graph.
Activity Planning Chart Ppt PowerPoint Presentation Designs
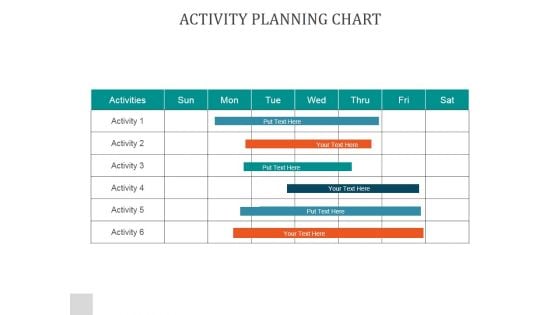
This is a activity planning chart ppt powerpoint presentation designs. This is a seven stage process. The stages in this process are sun, mon, tue, wed, thru, fri, sat.
Employee Counseling Process Workflow Chart Download PDF
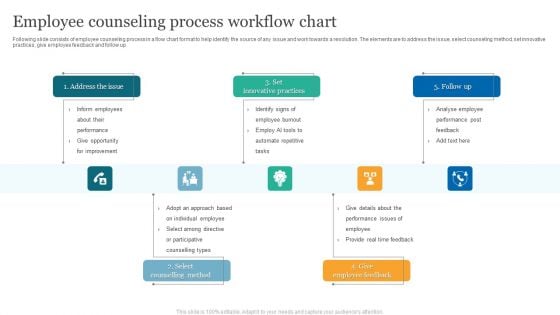
Following slide consists of employee counseling process in a flow chart format to help identify the source of any issue and work towards a resolution. The elements are to address the issue, select counseling method, set innovative practices, give employee feedback and follow up. Presenting Employee Counseling Process Workflow Chart Download PDF. This template comprises Five stages. It also presents valuable insights into the topics including Address The Issue, Select Counselling Method, Set Innovative Practices. This is a completely customizable PowerPoint theme that can be put to use immediately. So, download it and address the topic impactfully.
Financial Logistics Pyramid Chart Presentation Ideas
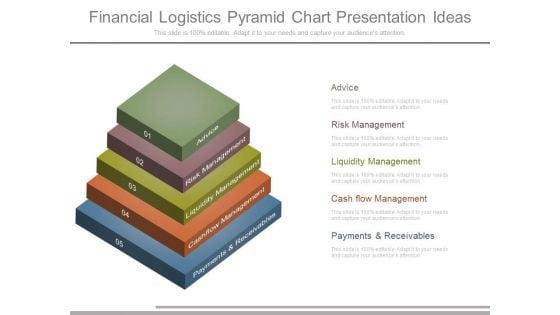
This is a financial logistics pyramid chart presentation ideas. This is a five stage process. The stages in this process are advice, risk management, liquidity management, cash flow management, payments and receivables.
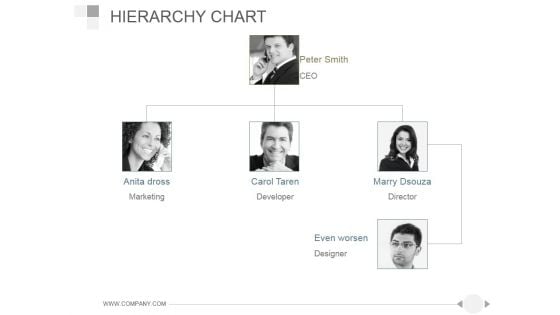
Hierarchy Chart Ppt PowerPoint Presentation Ideas
This is a hierarchy chart ppt powerpoint presentation ideas. This is a three stage process. The stages in this process are peter smith, anita dross, carol taren, marry dsouza, even worsen.
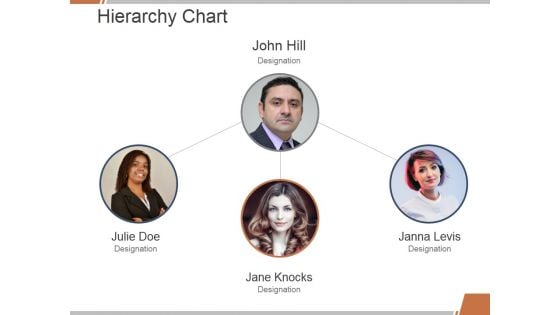
Hierarchy Chart Ppt PowerPoint Presentation Summary Deck
This is a hierarchy chart ppt powerpoint presentation summary deck. This is a three stage process. The stages in this process are john hill, julie doe, jane knocks, janna levis.
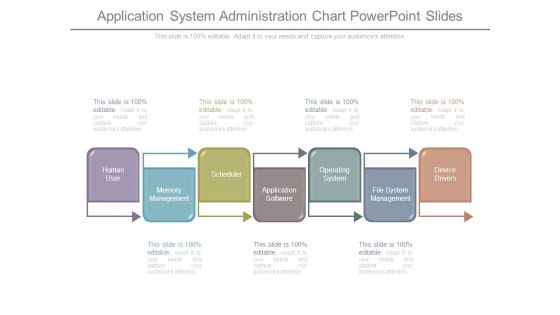
Application System Administration Chart Powerpoint Slides
This is a application system administration chart powerpoint slides. This is a seven stage process. The stages in this process are human user, memory management, scheduler, application software, operating system, file system management, device drivers.
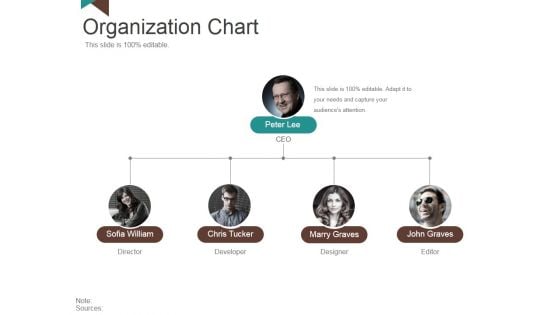
Organization Chart Ppt PowerPoint Presentation Styles Outfit
This is a organization chart ppt powerpoint presentation styles outfit. This is a four stage process. The stages in this process are peter lee, sofia william, chris tucker, marry graves, john graves.
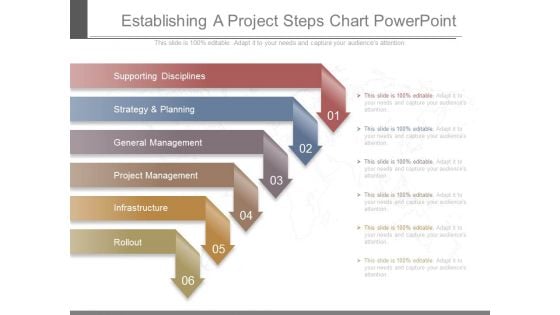
Establishing A Project Steps Chart Powerpoint
This is a establishing a project steps chart powerpoint. This is a six stage process. The stages in this process are supporting disciplines, strategy and planning, general management, project management, infrastructure, rollout.
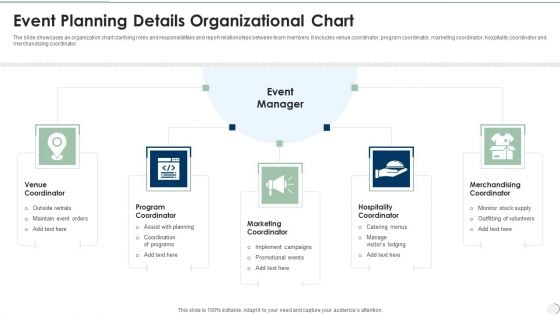
Event Planning Details Organizational Chart Information PDF
The slide showcases an organization chart clarifying roles and responsibilities and report relationships between team members. It includes venue coordinator, program coordinator, marketing coordinator, hospitality coordinator and merchandising coordinator. Presenting Event Planning Details Organizational Chart Information PDF to dispense important information. This template comprises five stages. It also presents valuable insights into the topics including Program Coordinator, Marketing Coordinator, Hospitality Coordinator. This is a completely customizable PowerPoint theme that can be put to use immediately. So, download it and address the topic impactfully.
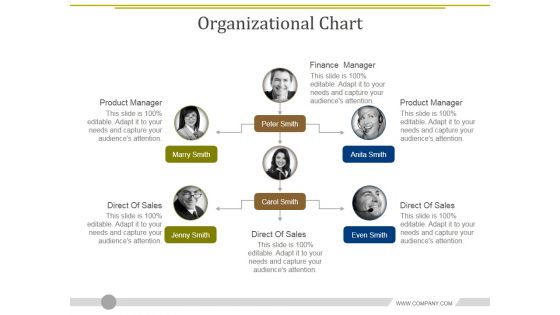
Organizational Chart Ppt PowerPoint Presentation Layouts Demonstration
This is a organizational chart ppt powerpoint presentation layouts demonstration. This is a six stage process. The stages in this process are finance manager, product manager, direct of sales, direct of sales, direct of sales.
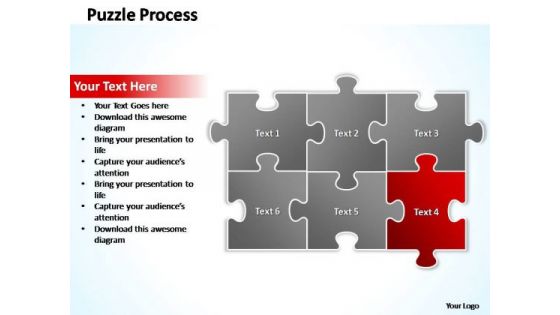
PowerPoint Slide Layout Chart Puzzle Ppt Theme
This diagram shows an organized view of business services and processes. Dare to dream with our PowerPoint Slide Layout Chart Puzzle Ppt Theme. You will come out on top.
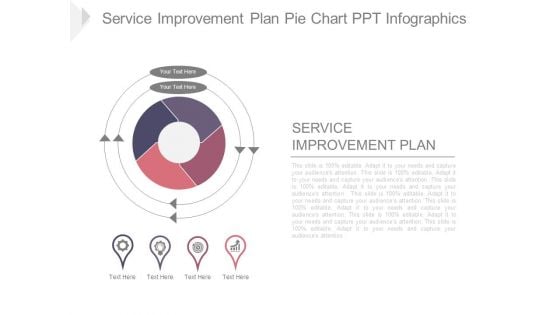
Service Improvement Plan Pie Chart Ppt Infographics
This is a service improvement plan pie chart ppt infographics. This is a four stage process. The stages in this process are service improvement plan, business, strategy, marketing, management.
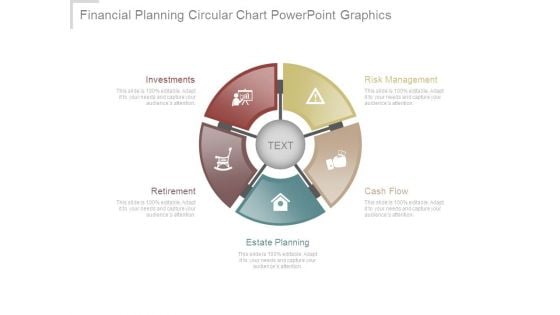
Financial Planning Circular Chart Powerpoint Graphics
This is a financial planning circular chart powerpoint graphics. This is a five stage process. The stages in this process are risk management, cash flow, estate planning, retirement, investments.
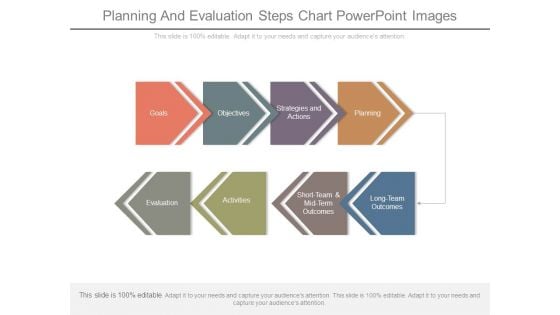
Planning And Evaluation Steps Chart Powerpoint Images
This is a planning and evaluation steps chart powerpoint images. This is a eight stage process. The stages in this process are goals, objectives, strategies and actions, planning, evaluation, activities, short team and mid term outcomes, long team outcomes.
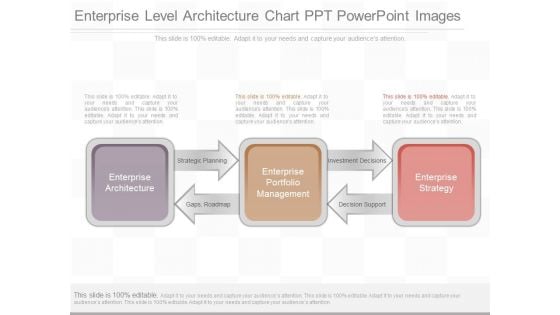
Enterprise Level Architecture Chart Ppt Powerpoint Images
This is a enterprise level architecture chart ppt powerpoint images. This is a three stage process. The stages in this process are enterprise architecture, strategic planning, gaps, roadmap, enterprise portfolio management, investment decisions, decision support, enterprise strategy.
Bar Chart Ppt PowerPoint Presentation Icon Demonstration
This is a bar chart ppt powerpoint presentation icon demonstration. This is a seven stage process. The stages in this process are product, sales in percentage, financial year, graph.
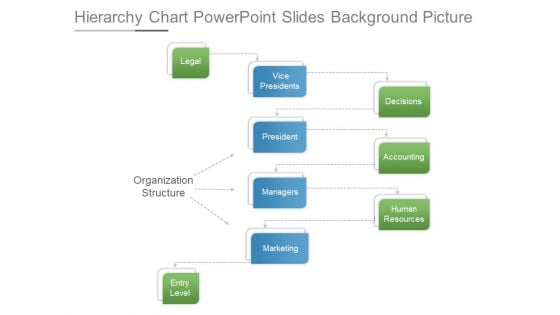
Hierarchy Chart Powerpoint Slides Background Picture
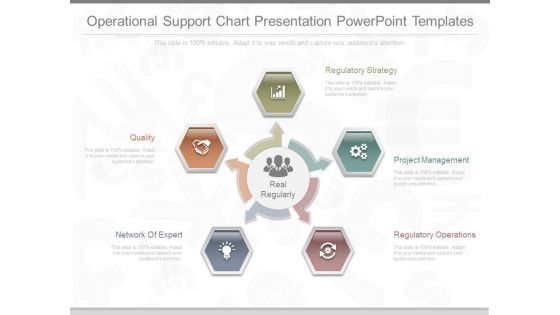
Operational Support Chart Presentation Powerpoint Templates
This is a operational support chart presentation powerpoint templates. This is a five stage process. The stages in this process are regulatory strategy, project management, regulatory operations, network of expert, quality.
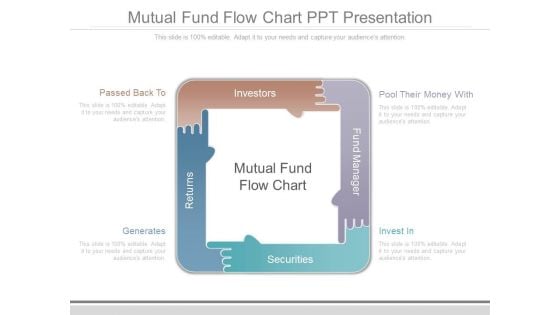
Mutual Fund Flow Chart Ppt Presentation
This is a mutual fund flow chart ppt presentation. This is a four stage process. The stages in this process are passed back to, generates, pool their money with, invest in, returns, securities, fund manager, investors.
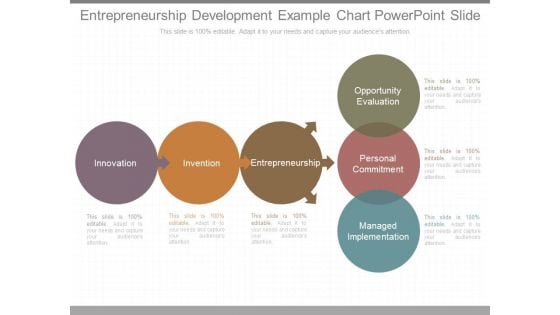
Entrepreneurship Development Example Chart Powerpoint Slide
This is a entrepreneurship development example chart powerpoint slide. This is a six stage process. The stages in this process are innovation, invention, entrepreneurship, opportunity evaluation, personal commitment, managed implementation.

Trade Cycle Chart Presentation Powerpoint Templates
This is a trade cycle chart presentation powerpoint templates. This is a four stage process. The stages in this process are order generation, execution, price discovery, decision support, performance attribution, pre trade compliance, order management.

Business Development Organizational Chart Example Of Ppt
This is a business development organizational chart example of ppt. This is a five stage process. The stages in this process are reward system, structure, business and lateral link, human resource management, strategy.
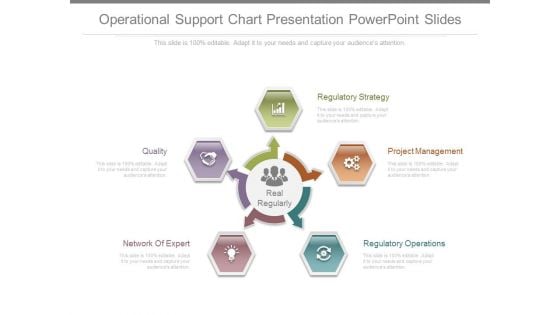
Operational Support Chart Presentation Powerpoint Slides
This is a operational support chart presentation powerpoint slides. This is a five stage process. The stages in this process are regulatory strategy, project management, regulatory operations, network of expert, quality, real regularly.
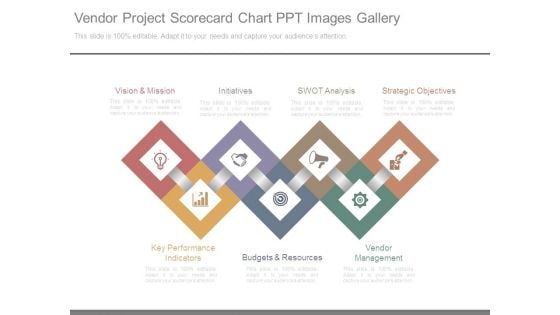
Vendor Project Scorecard Chart Ppt Images Gallery
This is a vendor project scorecard chart ppt images gallery. This is a seven stage process. The stages in this process are vision and mission, initiatives, swot analysis, strategic objectives, vendor management, budgets and resources, key performance indicators.
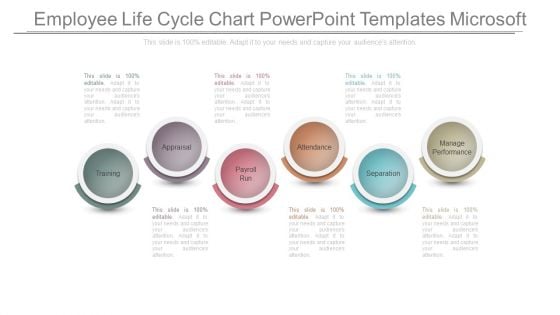
Employee Life Cycle Chart Powerpoint Templates Microsoft
This is a employee life cycle chart powerpoint templates microsoft. This is a six stage process. The stages in this process are training, appraisal, payroll run, attendance, separation, manage performance.
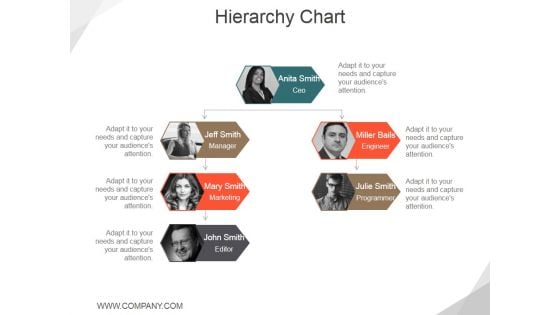
Hierarchy Chart Ppt PowerPoint Presentation Outline Ideas
This is a hierarchy chart ppt powerpoint presentation outline ideas. This is a two stage process. The stages in this process are anita smith ceo, jeff smith manager, miller bails engineer.
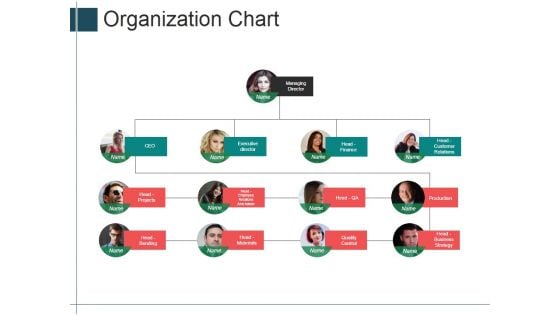
Organization Chart Ppt PowerPoint Presentation Portfolio Shapes
This is a organization chart ppt powerpoint presentation portfolio shapes. This is a four stage process. The stages in this process are managing director, executive director, head finance, head projects.
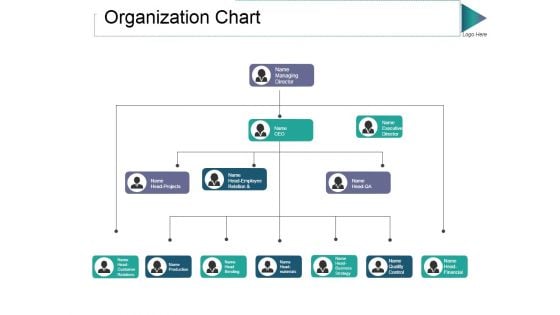
Organization Chart Ppt PowerPoint Presentation Gallery Ideas
This is a organization chart ppt powerpoint presentation gallery ideas. This is a four stage process. The stages in this process are managing director, ceo, head projects, head bending.
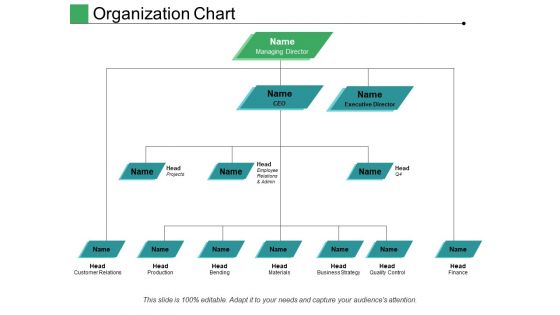
Organization Chart Ppt PowerPoint Presentation Pictures Structure
This is a organization chart ppt powerpoint presentation pictures structure. This is a three stage process. The stages in this process are managing director, executive director, head, ceo, finance.
Circular Chart With Business Icons Powerpoint Templates
This business slide displays circular chart with business icons. These icons may be used to display business options and strategies. Use this PowerPoint template to highlight the key issues of your presentation.
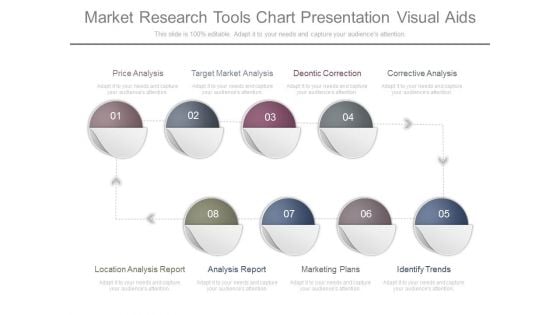
Market Research Tools Chart Presentation Visual Aids
This is a market research tools chart presentation visual aids. This is a eight stage process. The stages in this process are price analysis, target market analysis, deontic correction, corrective analysis, location analysis report, analysis report, marketing plans, identify trends.
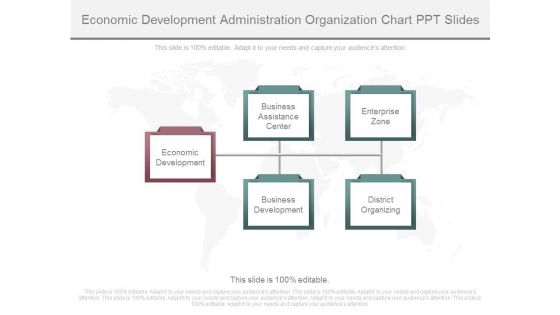
Economic Development Administration Organization Chart Ppt Slides
This is a economic development administration organization chart ppt slides. This is a five stage process. The stages in this process are economic development, business assistance center, business development, enterprise zone, district organizing.
Tracking Sales Performance Chart Ppt Example
This is a tracking sales performance chart ppt example. This is a eight stage process. The stages in this process are efficiency, effectiveness, profits, cost per sale, roi, profit sale, convert to sale, cost contact, conversion, contacts.
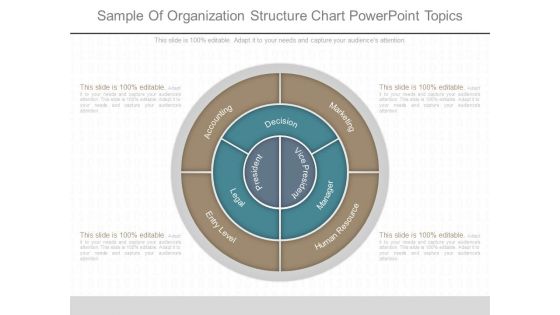
Sample Of Organization Structure Chart Powerpoint Topics
This is a sample of organization structure chart powerpoint topics. This is a four stage process. The stages in this process are president, vice president, decision, entry level, human resource, marketing, accounting.
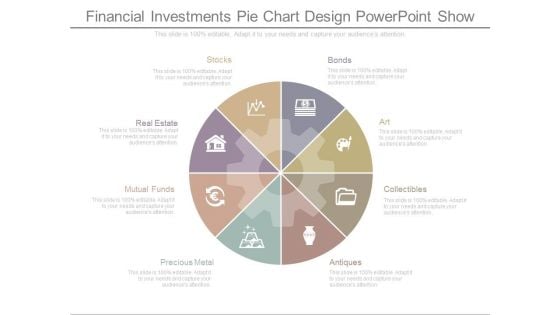
Financial Investments Pie Chart Design Powerpoint Show
This is a financial investments pie chart design powerpoint show. This is a eight stage process. The stages in this process are stocks, real estate, mutual funds, precious metal, bonds, art, collectibles, antiques.
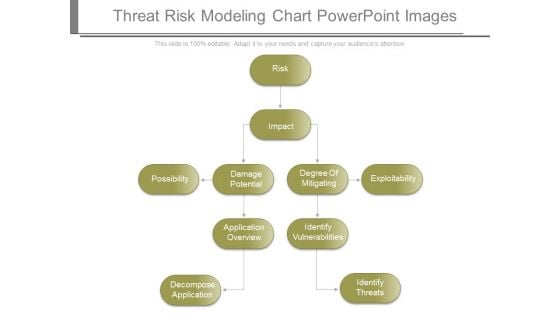
Threat Risk Modeling Chart Powerpoint Images
This is a threat risk modeling chart powerpoint images. This is a five stage process. The stages in this process are risk, impact, possibility, damage potential, degree of mitigating, exploitability, application overview, identify vulnerabilities, decompose application, identify threats.
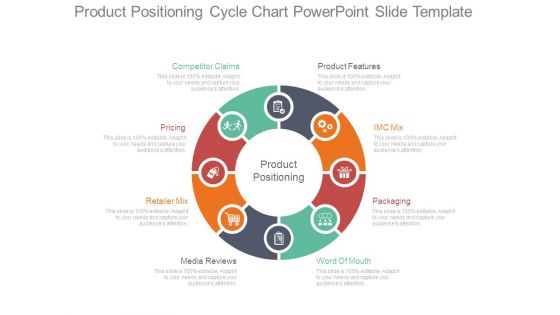
Product Positioning Cycle Chart Powerpoint Slide Template
This is a product positioning cycle chart powerpoint slide template. This is a eight stage process. The stages in this process are product features, imc mix, packaging, word of mouth, media reviews, retailer mix, pricing, competitor claims, product positioning.
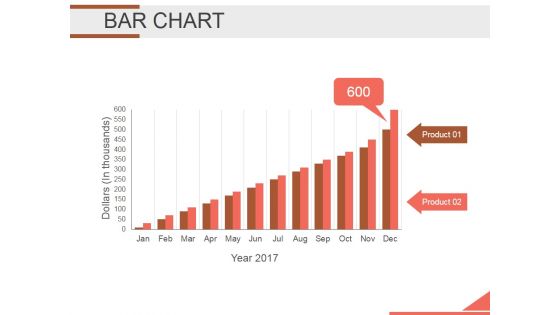
Bar Chart Ppt PowerPoint Presentation Background Designs
This is a bar chart ppt powerpoint presentation background designs. This is a twelve stage process. The stages in this process are bar graph, finance, marketing, strategy, analysis, investment.
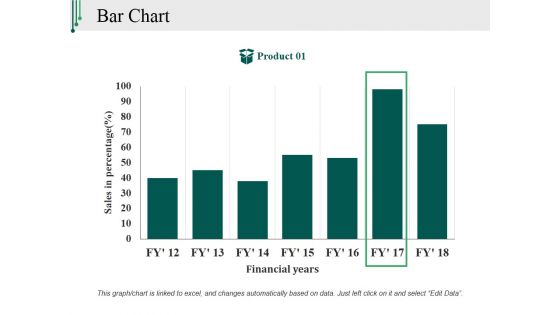
Bar Chart Ppt PowerPoint Presentation Outline Backgrounds
This is a bar chart ppt powerpoint presentation outline backgrounds. This is a one stage process. The stages in this process are sales in percentage, financial years, product, bar graph, finance.
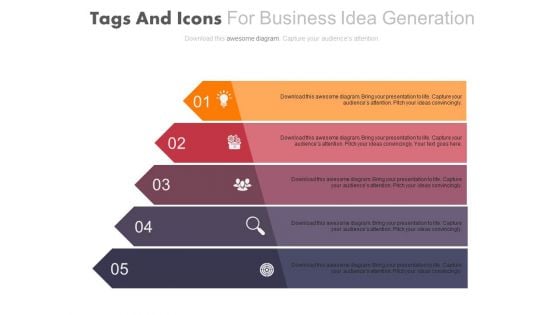
Five Progressive Arrows Infographic Chart Powerpoint Template
This business slide contains infographic chart of five progressive arrows. This diagram provides schematic representation of any information. Visual effect this slide helps in maintaining the flow of the discussion and provides more clarity to the subject.
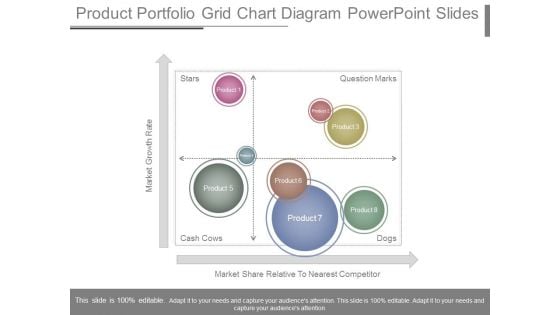
Product Portfolio Grid Chart Diagram Powerpoint Slides
This is a product portfolio grid chart diagram powerpoint slides. This is a four stage process. The stages in this process are market growth rate, market share relative to nearest competitor, stars, cash cows, dogs, question marks, product.
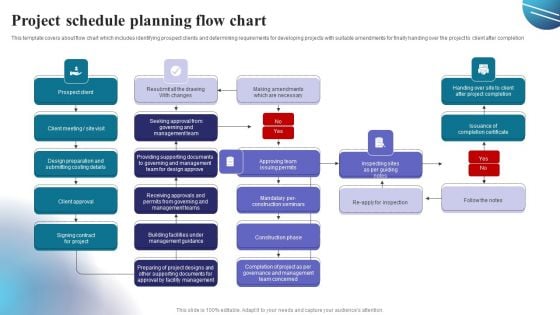
Project Schedule Planning Flow Chart Themes PDF
This template covers about flow chart which includes identifying prospect clients and determining requirements for developing projects with suitable amendments for finally handing over the project to client after completion. Showcasing this set of slides titled Project Schedule Planning Flow Chart Themes PDF. The topics addressed in these templates are Design, Management, Team. All the content presented in this PPT design is completely editable. Download it and make adjustments in color, background, font etc. as per your unique business setting.
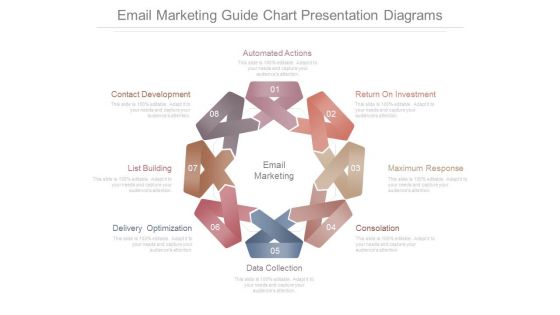
Email Marketing Guide Chart Presentation Diagrams
This is a email marketing guide chart presentation diagrams. This is a eight stage process. The stages in this process are automated actions, return on investment, maximum response, consolation, data collection, delivery optimization, list building, contact development, email marketing.
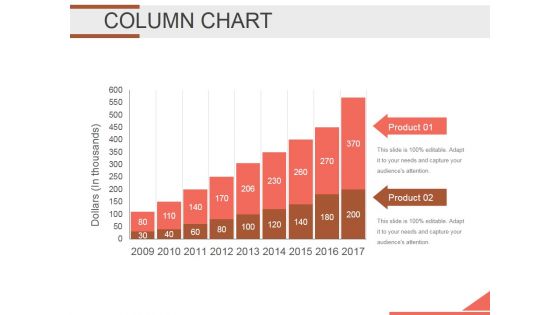
Column Chart Ppt PowerPoint Presentation Background Designs
This is a column chart ppt powerpoint presentation background designs. This is a two stage process. The stages in this process are bar graph, finance, marketing, strategy, analysis, business.
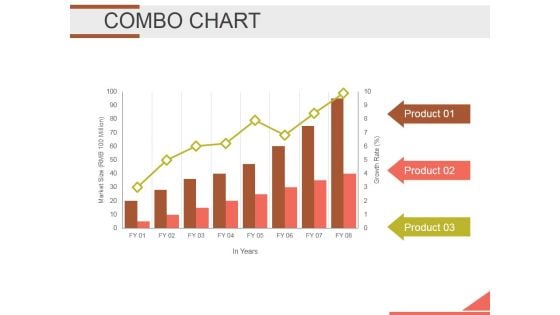
Combo Chart Ppt PowerPoint Presentation Infographics Infographics
This is a combo chart ppt powerpoint presentation infographics infographics. This is a three stage process. The stages in this process are bar graph, growth, finance, marketing, strategy, business.


 Continue with Email

 Home
Home


