Scoring Chart
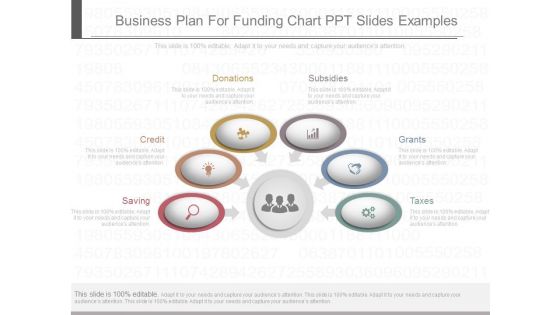
Business Plan For Funding Chart Ppt Slides Examples
This is a business plan for funding chart ppt slides examples. This is a five stage process. The stages in this process are saving, credit, donations, subsidies, grants, taxes.
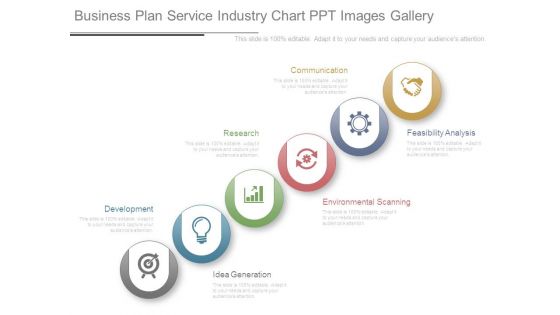
Business Plan Service Industry Chart Ppt Images Gallery
This is a business plan service industry chart ppt images gallery. This is a six stage process. The stages in this process are development, research, communication, idea generation, environmental scanning, feasibility analysis.
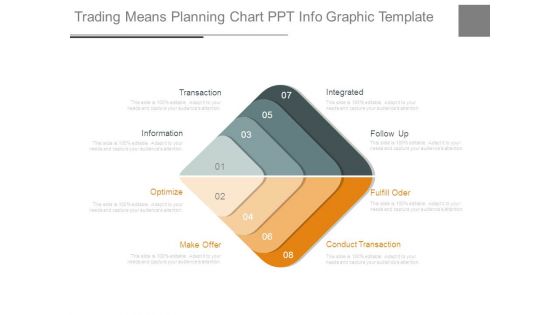
Trading Means Planning Chart Ppt Info Graphic Template
This is a trading means planning chart ppt info graphic template. This is a eight stage process. The stages in this process are transaction, information, optimize, make offer, integrated, follow up, fulfill order, conduct transaction.
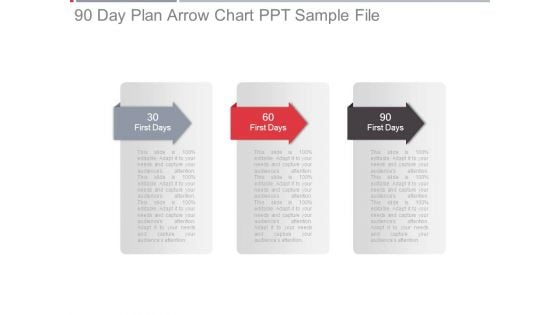
90 Day Plan Arrow Chart Ppt Sample File
This is a 90 day plan arrow chart ppt sample file. This is a three stage process. The stages in this process are 30 first days, 60 first days, 90 first days.
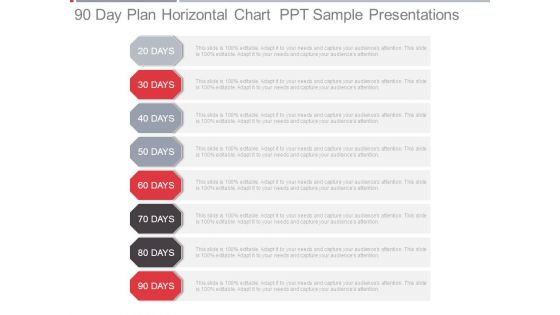
90 Day Plan Horizontal Chart Ppt Sample Presentations
This is a 90 day plan horizontal chart ppt sample presentations. This is a eight stage process. The stages in this process are 20 days, 30 days, 40 days, 50 days, 60 days, 70 days, 80 days, 90 days.
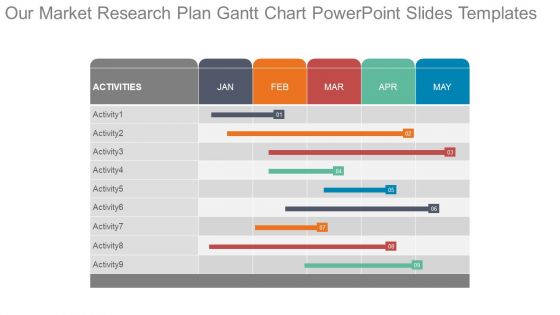
Our Market Research Plan Gantt Chart Powerpoint Slides Templates
This is a our market research plan gantt chart powerpoint slides templates. This is a nine stage process. The stages in this process are activities, jan, feb, mar, apr, may.
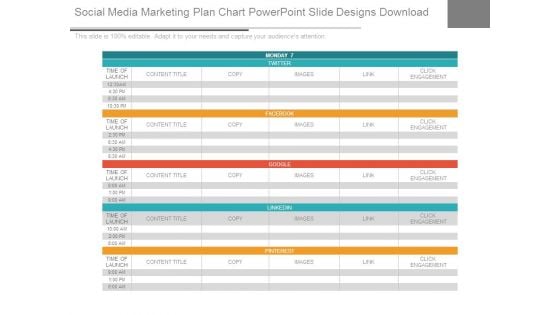
Social Media Marketing Plan Chart Powerpoint Slide Designs Download
This is a social media marketing plan chart powerpoint slide designs download. This is a five stage process. The stages in this process are content title, copy, images, link, click engagement.
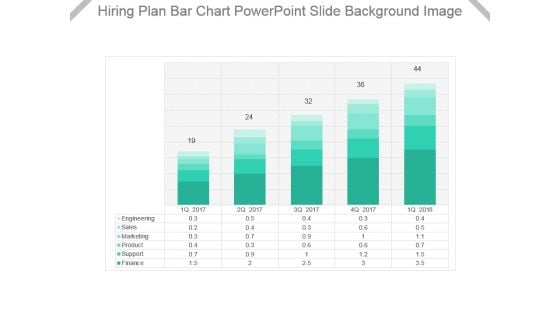
Hiring Plan Bar Chart Powerpoint Slide Background Image
This is a hiring plan bar chart powerpoint slide background image. This is a five stage process. The stages in this process are engineering, sales, marketing, product, support, finance.
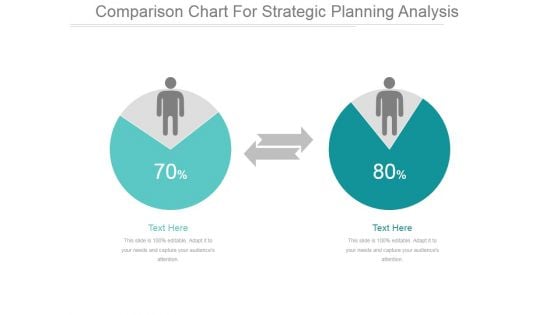
Comparison Chart For Strategic Planning Analysis Ppt PowerPoint Presentation Example
This is a comparison chart for strategic planning analysis ppt powerpoint presentation example. This is a two stage process. The stages in this process are business, finance, marketing, strategy, success.
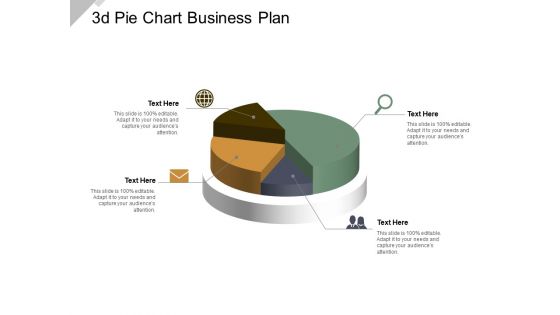
3D Pie Chart Business Plan Ppt PowerPoint Presentation Model Guidelines
This is a 3d pie chart business plan ppt powerpoint presentation model guidelines. This is a four stage process. The stages in this process are art, colouring, paint brush.
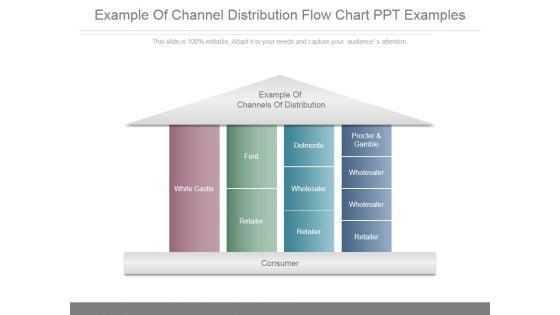
Example Of Channel Distribution Flow Chart Ppt Examples
This is a example of channel distribution flow chart ppt examples. This is a one stage process. The stages in this process are white castle, ford, retailer, delmont, wholesaler, retailer.
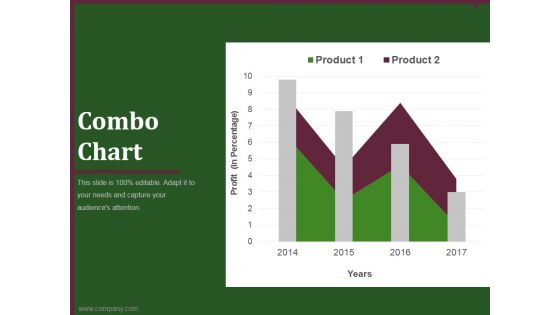
combo chart template 2 ppt powerpoint presentation background images
This is a combo chart template 2 ppt powerpoint presentation background images. This is a four stage process. The stages in this process are business, marketing, finance, timeline, product.
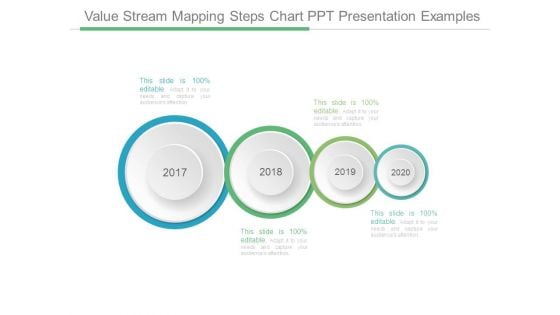
Value Stream Mapping Steps Chart Ppt Presentation Examples
This is a value stream mapping steps chart ppt presentation examples. This is a four stage process. The stages in this process are years, time planning, business, marketing, future.

High Low Close Chart Ppt PowerPoint Presentation Summary Ideas
This is a high low close chart ppt powerpoint presentation summary ideas. This is a five stage process. The stages in this process are business, strategy, marketing, analysis, growth.
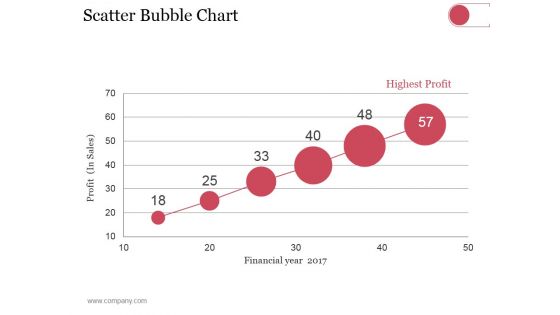
Scatter Bubble Chart Ppt PowerPoint Presentation Summary Pictures
This is a scatter bubble chart ppt powerpoint presentation summary pictures. This is a six stage process. The stages in this process are highest profit, financial year, profit in sales.
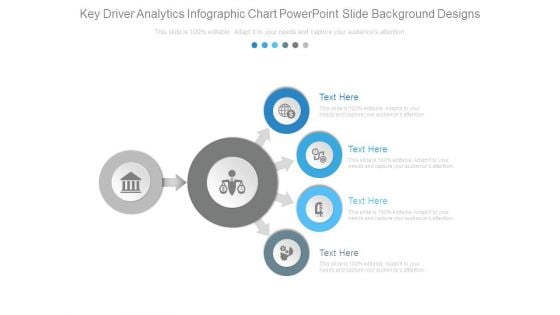
Key Driver Analytics Infographic Chart Powerpoint Slide Background Designs
This is a key driver analytics infographic chart powerpoint slide background designs. This is a four stage process. The stages in this process are business, marketing, arrows, icons, strategy.
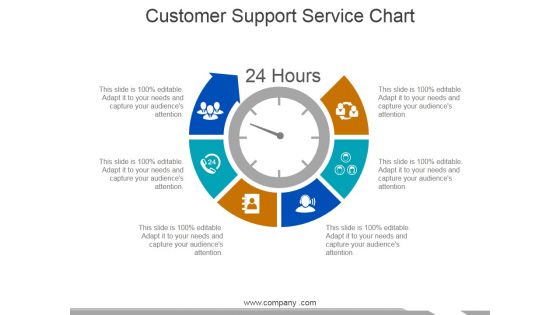
Customer Support Service Chart Ppt PowerPoint Presentation Infographic Template Graphics
This is a customer support service chart ppt powerpoint presentation infographic template graphics. This is a six stage process. The stages in this process are business, icons, strategy, marketing.
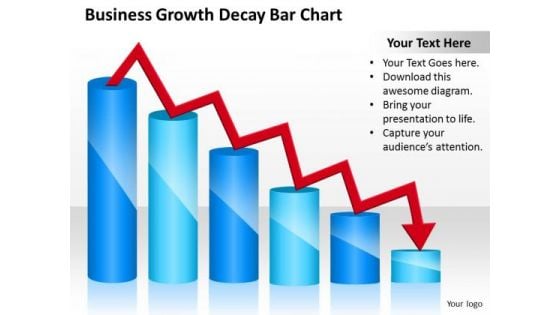
Consulting PowerPoint Template Bar Chart Ppt Templates Backgrounds For Slides
Our consulting PowerPoint template bar chart ppt templates backgrounds for slides heighten concentration. Your audience will be on the edge. Get an edge with our Marketing PowerPoint Templates. They give you advantage plus. Edit your work with our Arrows PowerPoint Templates. They will help you give the final form. Our Consulting PowerPoint Template Bar Chart Ppt Templates Backgrounds For Slides give you more than a fair chance. Add to your ability to succeed.
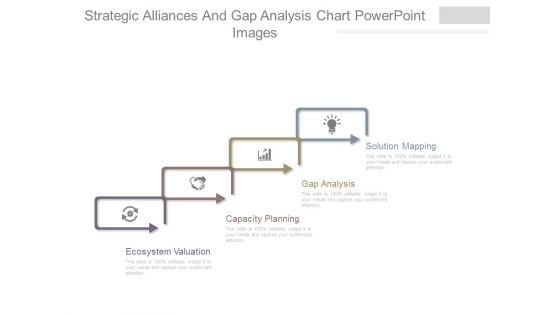
Strategic Alliances And Gap Analysis Chart Powerpoint Images
This is a strategic alliances and gap analysis chart powerpoint images. This is a four stage process. The stages in this process are solution mapping, gap analysis, capacity planning, ecosystem valuation.
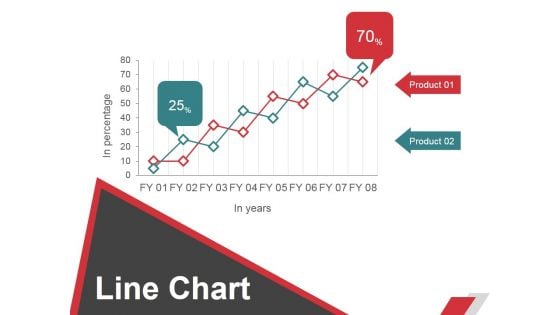
Line Chart Ppt PowerPoint Presentation File Graphic Images
This is a line chart ppt powerpoint presentation file graphic images. This is a two stage process. The stages in this process are business, strategy, marketing, planning, growth strategy, finance.

Donut Pie Chart Ppt PowerPoint Presentation Infographics Outfit
This is a donut pie chart ppt powerpoint presentation infographics outfit. This is a three stage process. The stages in this process are business, strategy, analysis, planning, dashboard, finance.
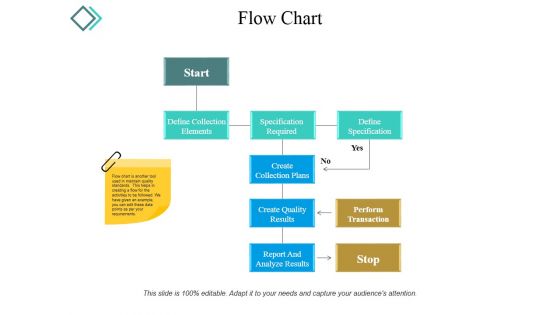
Flow Chart Ppt PowerPoint Presentation Styles Example Topics
This is a flow chart ppt powerpoint presentation styles example topics. This is a nine stage process. The stages in this process are start, create collection plans, define specification, specification required.

Donut Pie Chart Ppt PowerPoint Presentation File Example Introduction
This is a donut pie chart ppt powerpoint presentation file example introduction. This is a three stage process. The stages in this process are business, marketing, finance, planning, analysis.
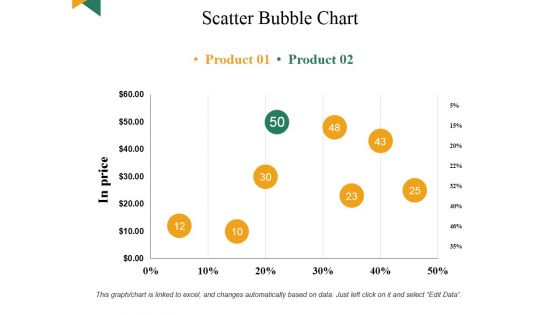
Scatter Bubble Chart Ppt PowerPoint Presentation Summary Visual Aids
This is a scatter bubble chart ppt powerpoint presentation summary visual aids. This is a eight stage process. The stages in this process are business, marketing, finance, analysis, planning.

Quality Cost Report Trend Chart Ppt PowerPoint Presentation Portfolio Maker
This is a quality cost report trend chart ppt powerpoint presentation portfolio maker. This is a two stage process. The stages in this process are compare, marketing, business, strategy, planning.
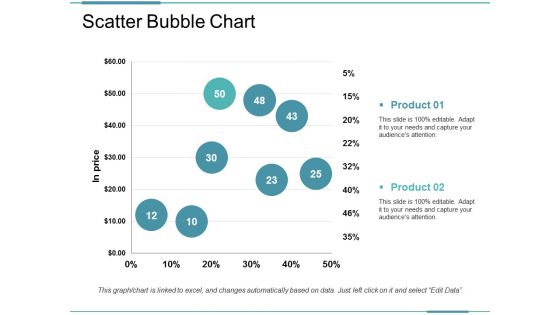
Scatter Bubble Chart Template Ppt PowerPoint Presentation Professional Background
This is a scatter bubble chart template ppt powerpoint presentation professional background. This is a six stage process. The stages in this process are business, marketing, strategy, planning, finance.
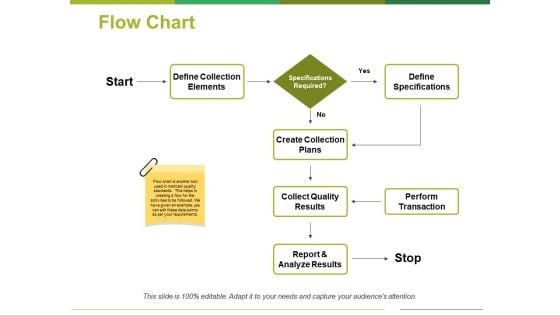
Flow Chart Ppt PowerPoint Presentation File Infographic Template
This is a flow chart ppt powerpoint presentation file infographic template. This is a seven stage process. The stages in this process are start, define specifications, perform transaction, create collection plans, report and analyze results.
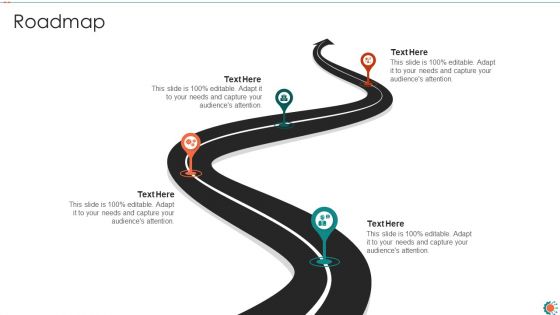
PMP Procedure Chart IT Roadmap Ppt Outline Gallery PDF
This is a pmp procedure chart it poste it notes ppt portfolio guidelines pdf template with various stages. Focus and dispense information on four stages using this creative set, that comes with editable features. It contains large content boxes to add your information on topics like roadmap. You can also showcase facts, figures, and other relevant content using this PPT layout. Grab it now.
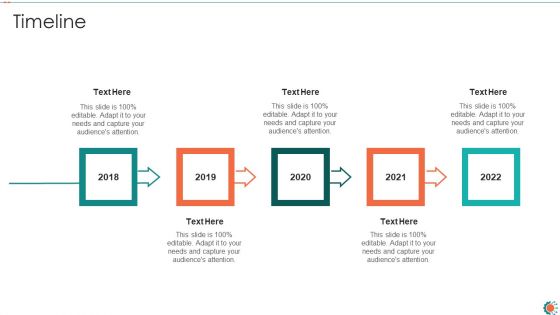
PMP Procedure Chart IT Timeline Ppt Portfolio Outline PDF
Presenting pmp procedure chart it poste it notes ppt portfolio guidelines pdf to provide visual cues and insights. Share and navigate important information on five stages that need your due attention. This template can be used to pitch topics like timeline, 2018 to 2021. In addtion, this PPT design contains high resolution images, graphics, etc, that are easily editable and available for immediate download.
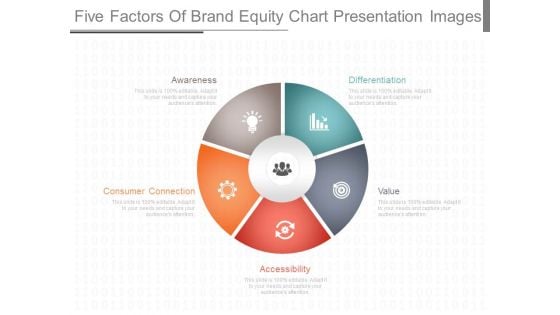
Five Factors Of Brand Equity Chart Presentation Images
This is a five factors of brand equity chart presentation images. This is a five stage process. The stages in this process are awareness, differentiation, consumer connection, accessibility, value. \n \n \n \n \n \n \n \n \n \n
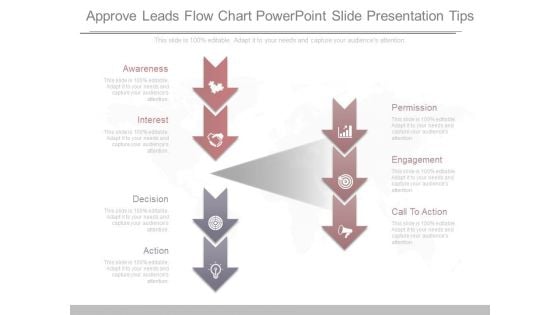
Approve Leads Flow Chart Powerpoint Slide Presentation Tips
This is a approve leads flow chart powerpoint slide presentation tips. This is a seven stage process. The stages in this process are awareness, interest, decision, action, permission, engagement, call to action.
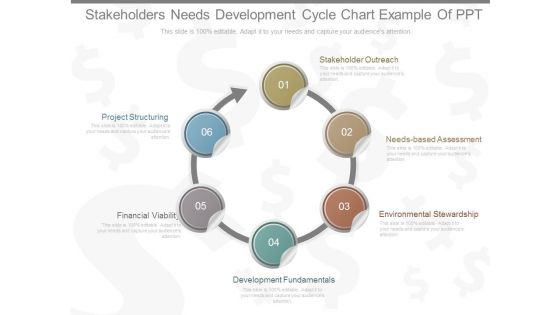
Stakeholders Needs Development Cycle Chart Example Of Ppt
This is a stakeholders needs development cycle chart example of ppt. This is a six stage process. The stages in this process are stakeholder outreach, needs based assessment, environmental stewardship,, development fundamentals, financial viability, project structuring.
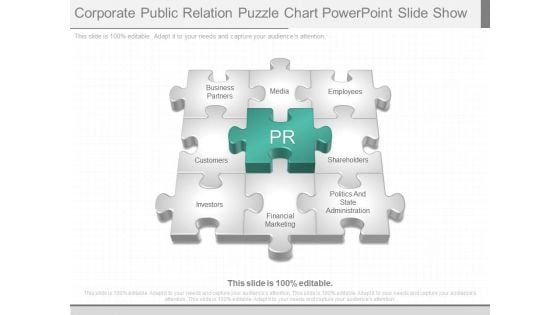
Corporate Public Relation Puzzle Chart Powerpoint Slide Show
This is a corporate public relation puzzle chart powerpoint slide show. This is a nine stage process. The stages in this process are business partners, media, employees, customers, shareholders, investors, financial marketing, politics and state administration, pr.
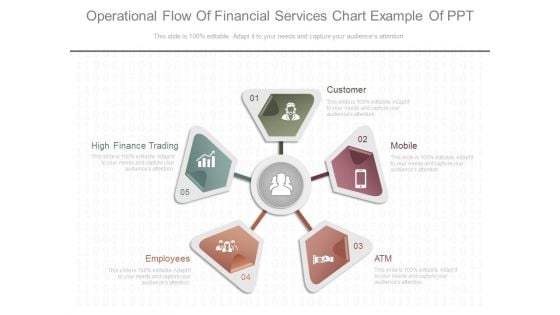
Operational Flow Of Financial Services Chart Example Of Ppt
This is a operational flow of financial services chart example of ppt. This is a five stage process. The stages in this process are customer, mobile, atm, employees, high finance trading.
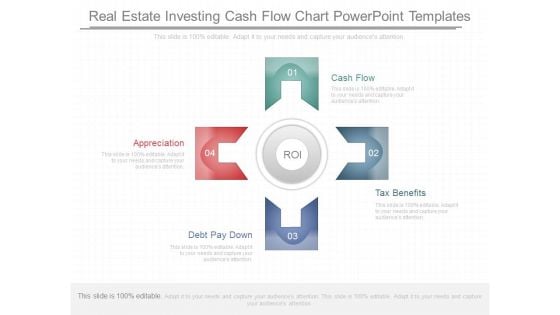
Real Estate Investing Cash Flow Chart Powerpoint Templates
This is a real estate investing cash flow chart powerpoint templates. This is a four stage process. The stages in this process are cash flow, tax benefits, debt pay down, appreciation.
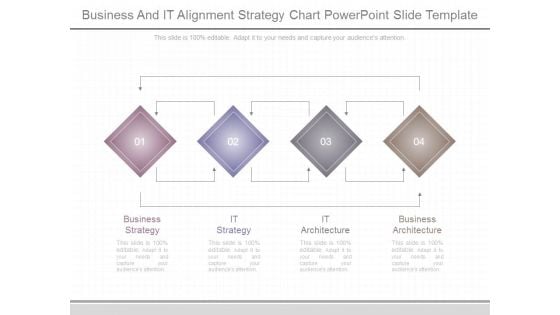
Business And It Alignment Strategy Chart Powerpoint Slide Template
This is a business and it alignment strategy chart powerpoint slide template. This is a four stage process. The stages in this process are business strategy, it strategy, it architecture, business architecture.
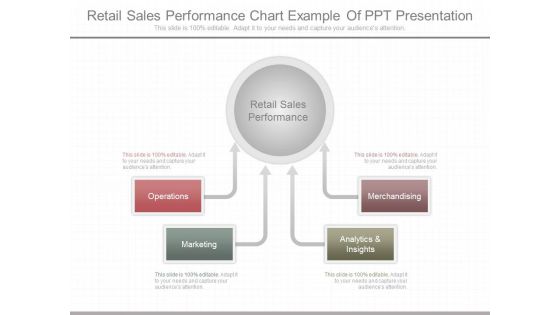
Retail Sales Performance Chart Example Of Ppt Presentation
This is a retail sales performance chart example of ppt presentation. This is a four stage process. The stages in this process are operations, marketing, analytics and insights, merchandising, retail sales performance.
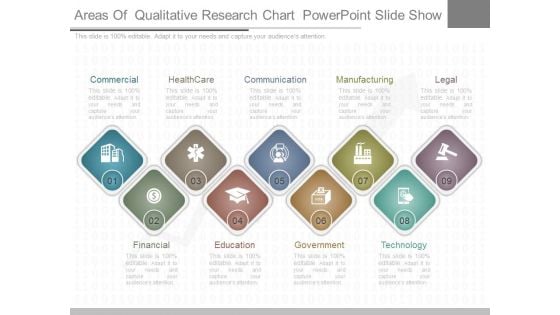
Areas Of Qualitative Research Chart Powerpoint Slide Show
This is a areas of qualitative research chart powerpoint slide show. This is a nine stage process. The stages in this process are commercial, healthcare, communication, manufacturing, legal, financial,, education, government, technology.
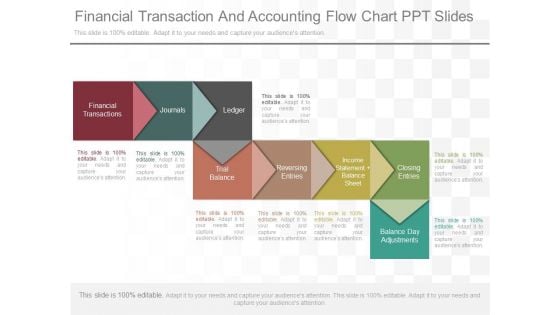
Financial Transaction And Accounting Flow Chart Ppt Slides
This is a financial transaction and accounting flow chart ppt slides. This is a eight stage process. The stages in this process are financial transactions, journals, ledger, trial balance, reversing entries, income statement balance sheet, closing entries, balance day adjustments.
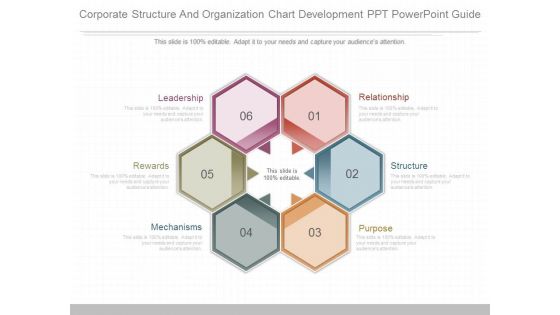
Corporate Structure And Organization Chart Development Ppt Powerpoint Guide
This is a corporate structure and organization chart development ppt powerpoint guide. This is a six stage process. The stages in this process are relationship, structure, purpose, mechanisms, rewards, leadership.
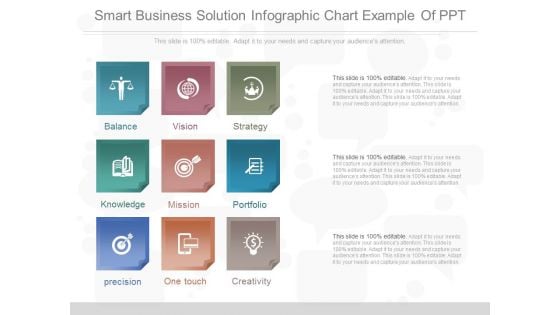
Smart Business Solution Infographic Chart Example Of Ppt
This is a smart business solution infographic chart example of ppt. This is a nine stage process. The stages in this process are balance, vision, strategy, knowledge, mission, portfolio, precision, one touch, creativity.
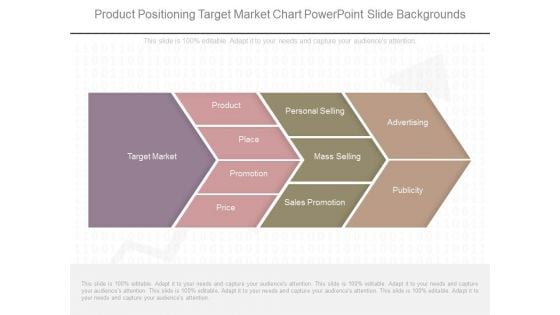
Product Positioning Target Market Chart Powerpoint Slide Backgrounds
This is a product positioning target market chart powerpoint slide backgrounds. This is a four stage process. The stages in this process are target market, product, place, promotion, price, personal selling, mass selling, sales promotion, advertising, publicity.
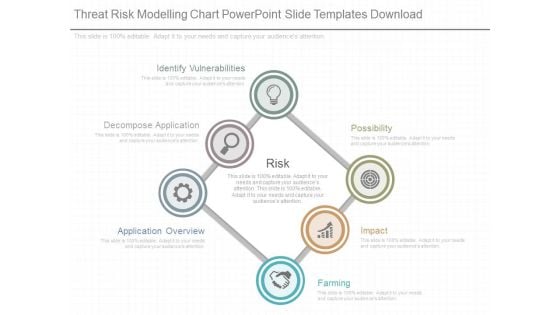
Threat Risk Modelling Chart Powerpoint Slide Templates Download
This is a threat risk modelling chart powerpoint slide templates download. This is a six stage process. The stages in this process are identify vulnerabilities, decompose application, application overview, possibility, impact, farming, risk.
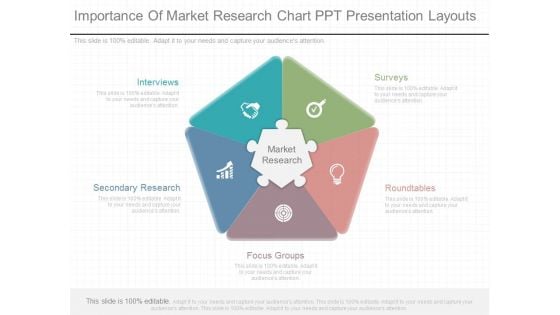
Importance Of Market Research Chart Ppt Presentation Layouts
This is a importance of market research chart ppt presentation layouts. This is a five stage process. The stages in this process are interviews, secondary research, market research, focus groups, surveys, roundtables.
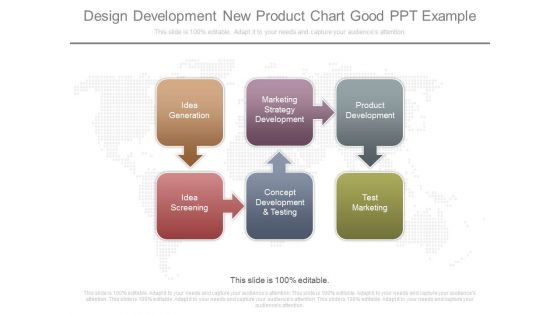
Design Development New Product Chart Good Ppt Example
This is a design development new product chart good ppt example. This is a six stage process. The stages in this process are idea generation, marketing strategy development, product development, idea screening, concept development and testing, test marketing.
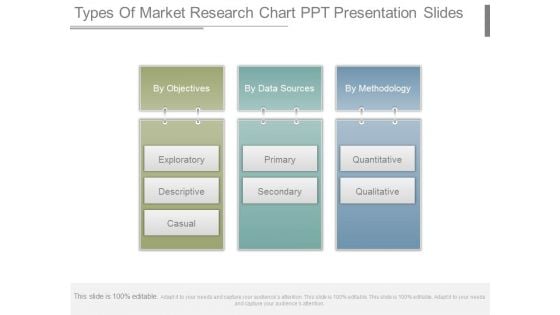
Types Of Market Research Chart Ppt Presentation Slides
This is a types of market research chart ppt presentation slides. This is a three stage process. The stages in this process are by objectives, exploratory, descriptive, causal, by data sources, primary, secondary, by methodology, quantitative, qualitative.
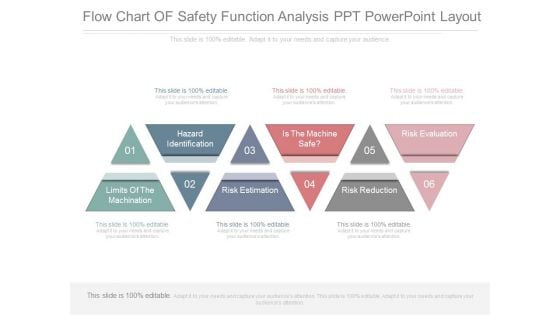
Flow Chart Of Safety Function Analysis Ppt Powerpoint Layout
This is a flow chart of safety function analysis ppt powerpoint layout. This is a six stage process. The stages in this process are hazard identification, limits of the machination, risk estimation, is the machine safe, risk reduction, risk evaluation.
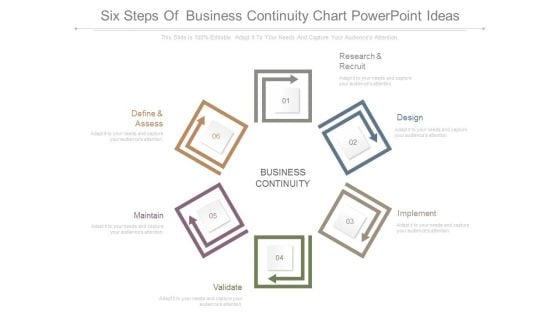
Six Steps Of Business Continuity Chart Powerpoint Ideas
This is a six steps of business continuity chart powerpoint ideas. This is a six stage process. The stages in this process are define and assess, research and recruit, design, implement, validate, maintain, business continuity.
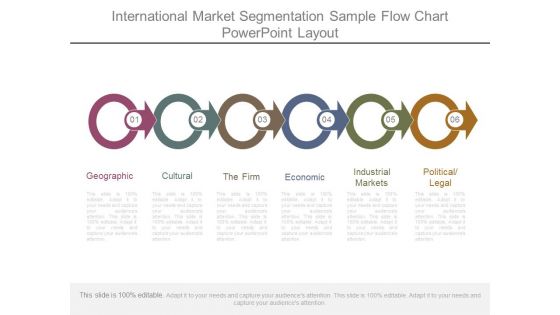
International Market Segmentation Sample Flow Chart Powerpoint Layout
This is a international market segmentation sample flow chart powerpoint layout. This is a six stage process. The stages in this process are geographic, cultural, the firm, economic, industrial markets, political legal.
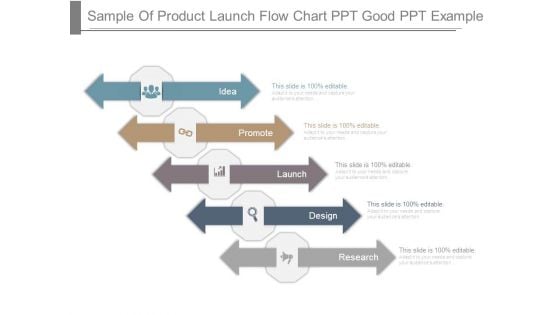
Sample Of Product Launch Flow Chart Ppt Good Ppt Example
This is a sample of product launch flow chart ppt good ppt example. This is a five stage process. The stages in this process are idea, promote, launch, design, research.
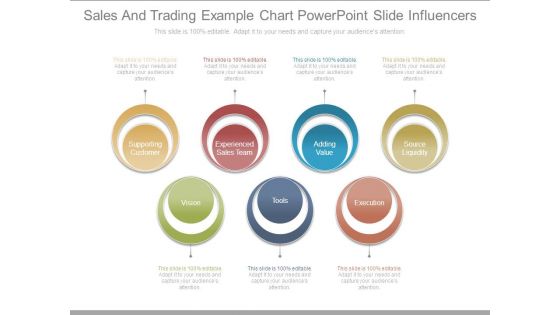
Sales And Trading Example Chart Powerpoint Slide Influencers
This is a sales and trading example chart powerpoint slide influencers. This is a seven stage process. The stages in this process are supporting customer, experienced sales team, adding value, source liquidity, vision, tools, execution.
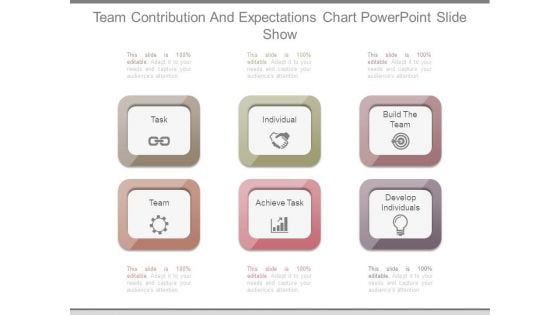
Team Contribution And Expectations Chart Powerpoint Slide Show
This is a team contribution and expectations chart powerpoint slide show. This is a six stage process. The stages in this process are task, individual, build the team, team, achieve task, develop individuals.
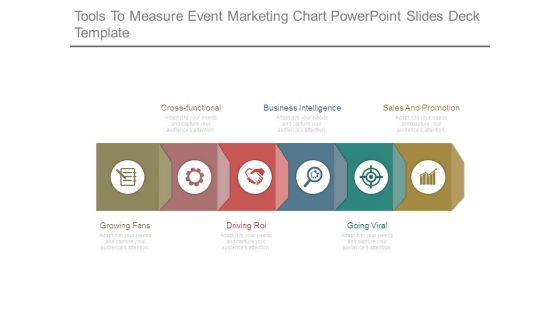
Tools To Measure Event Marketing Chart Powerpoint Slides Deck Template
This is a tools to measure event marketing chart powerpoint slides deck template. This is a six stage process. The stages in this process are cross functional, business intelligence, sales and promotion, going viral, driving roi, growing fans.
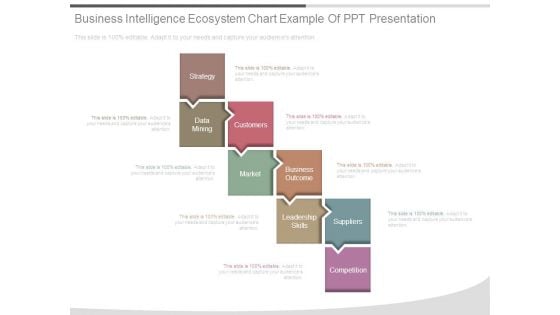
Business Intelligence Ecosystem Chart Example Of Ppt Presentation
This is a business intelligence ecosystem chart example of ppt presentation. This is a eight stage process. The stages in this process are strategy, data mining, customers, market, business outcome, leadership skills, suppliers, competition.

Enterprise Value Timing Factors Chart Ppt Examples Professional
This is a enterprise value timing factors chart ppt examples professional. This is a four stage process. The stages in this process are industry dynamics, company performance, organic growth, strategic acquisitions.
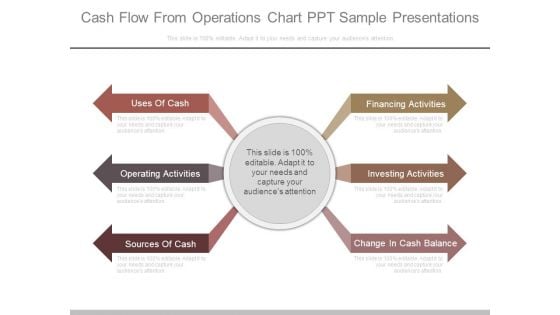
Cash Flow From Operations Chart Ppt Sample Presentations
This is a cash flow from operations chart ppt sample presentations. This is a six stage process. The stages in this process are uses of cash, operating activities, sources of cash, financing activities, investing activities, change in cash balance.
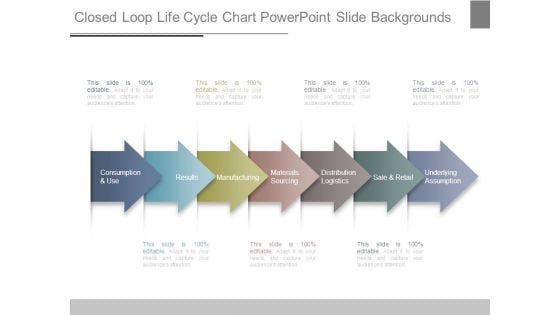
Closed Loop Life Cycle Chart Powerpoint Slide Backgrounds
This is a closed loop life cycle chart powerpoint slide backgrounds. This is a seven stage process. The stages in this process are consumption and use, results, manufacturing, materials sourcing, distribution logistics, sale and retail, underlying assumption.
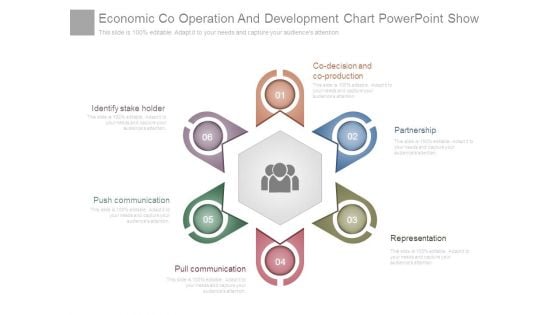
Economic Co Operation And Development Chart Powerpoint Show
This is a economic co operation and development chart powerpoint show. This is a six stage process. The stages in this process are co decision and co production, partnership, representation, pull communication, push communication, identify stake holder.
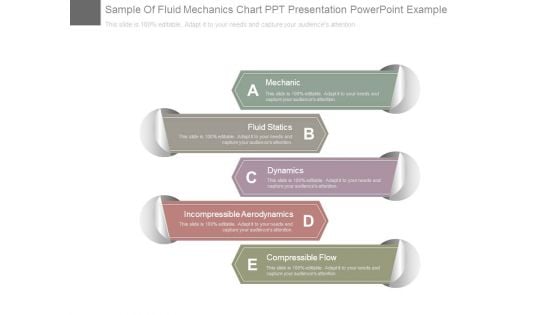
Sample Of Fluid Mechanics Chart Ppt Presentation Powerpoint Example
This is a sample of fluid mechanics chart ppt presentation powerpoint example. This is a five stage process. The stages in this process are mechanic, fluid statics, dynamics, incompressible aerodynamics, compressible flow.
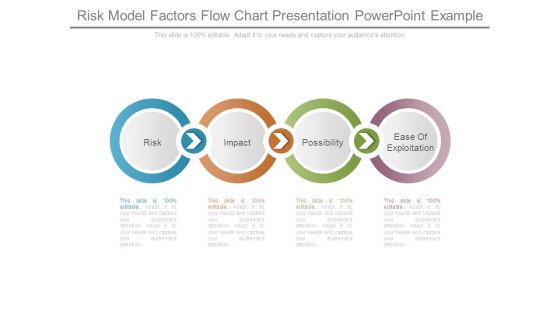
Risk Model Factors Flow Chart Presentation Powerpoint Example
This is a risk model factors flow chart presentation powerpoint example. This is a four stage process. The stages in this process are risk, impact, possibility, ease of exploitation.


 Continue with Email

 Home
Home


