Scoring Chart
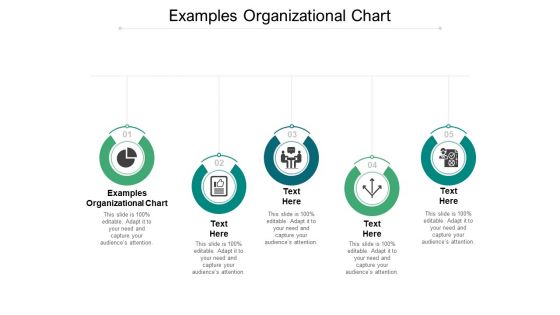
Examples Organizational Chart Ppt PowerPoint Presentation Infographic Template Themes Cpb
Presenting this set of slides with name examples organizational chart ppt powerpoint presentation infographic template themes cpb. This is an editable Powerpoint five stages graphic that deals with topics like examples organizational chart to help convey your message better graphically. This product is a premium product available for immediate download and is 100 percent editable in Powerpoint. Download this now and use it in your presentations to impress your audience.
Maintain Matrix Chart For Business Results Plan Sample PowerPoint Slides
Blend your views with our maintain matrix chart for business results plan sample PowerPoint Slides. They are made for each other. Our Boxes Powerpoint templates are duly appointed. They have all the facets you require. There is no subject too dull for our Process and Flows Powerpoint templates. They will always generate keenness. Create failsafe designs with our Maintain Matrix Chart For Business Results Plan Sample PowerPoint Slides. Examine likely defects in detail.

Business Information Application Protection Testing Flow Chart Themes PDF
This slide covers business application security testing flow chart which includes secure application model, security standard recognition and privacy testing.Pitch your topic with ease and precision using this Business Information Application Protection Testing Flow Chart Themes PDF. This layout presents information on Security Consistency, Target Weighting, Target Recognition. It is also available for immediate download and adjustment. So, changes can be made in the color, design, graphics or any other component to create a unique layout.
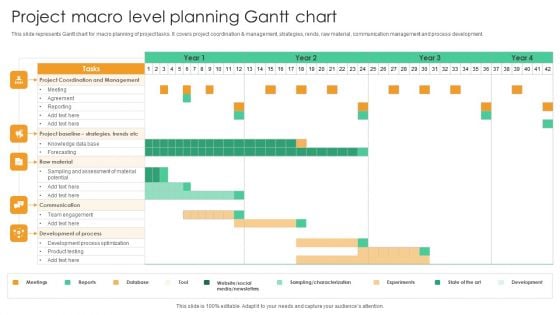
Project Macro Level Planning Gantt Chart Guidelines PDF
This slide represents Gantt chart for macro planning of project tasks. It covers project coordination and management, strategies, rends, raw material, communication management and process development. Pitch your topic with ease and precision using this Project Macro Level Planning Gantt Chart Guidelines PDF. This layout presents information on Project Coordination Management, Raw Material. It is also available for immediate download and adjustment. So, changes can be made in the color, design, graphics or any other component to create a unique layout.
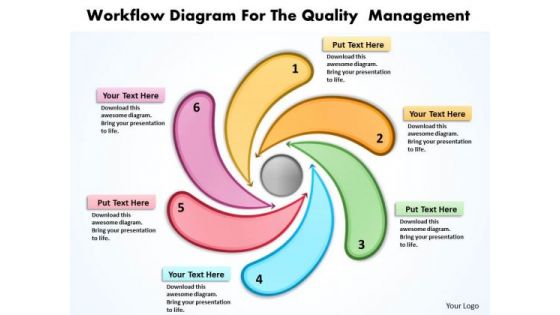
Workflow Diagram For The Quality Management Radial Chart PowerPoint Templates
We present our workflow diagram for the quality management Radial Chart PowerPoint templates.Present our Marketing PowerPoint Templates because Our PowerPoint Templates and Slides will let Your superior ideas hit the target always and everytime. Download and present our Business PowerPoint Templates because infrastructure growth is an obvious requirement of today.inform your group on how exactly this potential is tailor made for you. Download our Shapes PowerPoint Templates because you should Demonstrate how you think out of the box. Use our Finance PowerPoint Templates because you can see clearly through to the bigger bowl ahead. Time your jump to perfection and hit the nail on the head. Use our Symbol PowerPoint Templates because you can see In any endeavour people matter most.Use these PowerPoint slides for presentations relating to Arrow, Art, Business, Chart, Design, Development, Diagram, Flow, Flowchart, Graphic, Gray, Idea, Info, Management, Method, Model, Process, Quality, Rainbow, Research, Sign, Software, Strategy, Success, System, Template, Text, Vector, Work. The prominent colors used in the PowerPoint template are Red, Blue, Yellow. We assure you our workflow diagram for the quality management Radial Chart PowerPoint templates are incredible easy to use. Customers tell us our Flow PowerPoint templates and PPT Slides will make the presenter successul in his career/life. The feedback we get is that our workflow diagram for the quality management Radial Chart PowerPoint templates effectively help you save your valuable time. We assure you our Chart PowerPoint templates and PPT Slides are Splendid. People tell us our workflow diagram for the quality management Radial Chart PowerPoint templates are Classic. We assure you our Diagram PowerPoint templates and PPT Slides are Fabulous. Build their faith with our Workflow Diagram For The Quality Management Radial Chart PowerPoint Templates. They will ally with your cause.
Emotional Investing Chart Ppt PowerPoint Presentation Portfolio Model Cpb Pdf
Presenting this set of slides with name emotional investing chart ppt powerpoint presentation portfolio model cpb pdf. This is an editable Powerpoint one stages graphic that deals with topics like emotional investing chart to help convey your message better graphically. This product is a premium product available for immediate download and is 100 percent editable in Powerpoint. Download this now and use it in your presentations to impress your audience.
Companies Comparison Chart Vector Icon Ppt PowerPoint Presentation Files PDF
Persuade your audience using this companies comparison chart vector icon ppt powerpoint presentation files pdf. This PPT design covers one stages, thus making it a great tool to use. It also caters to a variety of topics including companies comparison chart vector icon. Download this PPT design now to present a convincing pitch that not only emphasizes the topic but also showcases your presentation skills.
Hierarchy Chart Organizational Structure Ppt PowerPoint Presentation Icon Guide Cpb
Presenting this set of slides with name hierarchy chart organizational structure ppt powerpoint presentation icon guide cpb. This is an editable Powerpoint four stages graphic that deals with topics like hierarchy chart organizational structure to help convey your message better graphically. This product is a premium product available for immediate download and is 100 percent editable in Powerpoint. Download this now and use it in your presentations to impress your audience.
Donut Pie Chart Ppt PowerPoint Presentation Icon Background Images
This is a donut pie chart ppt powerpoint presentation icon background images. This is a four stage process. The stages in this process are donut, process, planning, percentage, finance.
High Low Close Chart Ppt PowerPoint Presentation Icon Background Images
This is a high low close chart ppt powerpoint presentation icon background images. This is a ten stage process. The stages in this process are finance, analysis, planning, business, process.
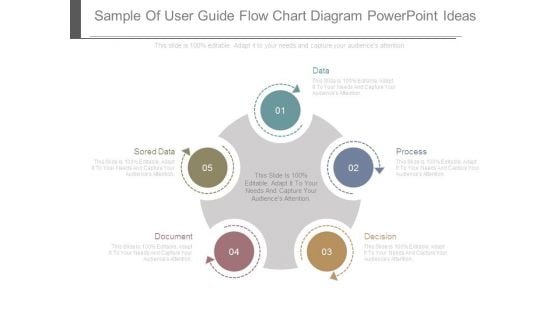
Sample Of User Guide Flow Chart Diagram Powerpoint Ideas
This is a sample of user guide flow chart diagram powerpoint ideas. This is a five stage process. The stages in this process are data, process, decision, document, sored data.
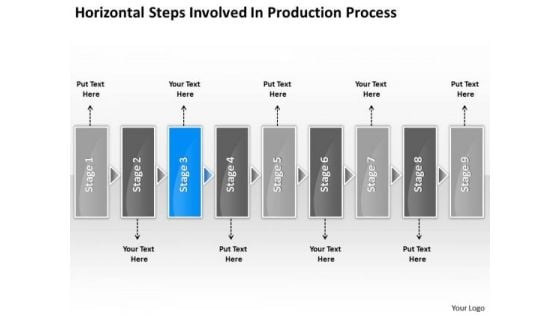
Steps Involved Production Processs Chart Electrical Design PowerPoint Slides
We present our steps involved production processs chart electrical design PowerPoint Slides.Download and present our Advertising PowerPoint Templates because you require care and diligence to function well. Download and present our Business PowerPoint Templates because you can see clearly through to the bigger bowl ahead. Time your jump to perfection and hit the nail on the head. Download and present our Shapes PowerPoint Templates because you have the people in place, selected the team leaders and all are raring to go. Download our Process and Flow PowerPoint Templates because there is a very good saying that prevention is better than cure, either way you have a store of knowledge for sure. Present our Arrows PowerPoint Templates because excite your audience with the brilliance of your thoughts.Use these PowerPoint slides for presentations relating to Abstract, Action, Attach, Box, Business, Center, Chain, Chart, Color, Communication, Concept, Connection, Cube, Cycle, Data, Diagram, Flow, Globe, Horizontal, Idea, Illustration, Information, Interaction, Jigsaw, Join, Link, Pieces, Process, Puzzle, Relation, Relationship, Shape, Success. The prominent colors used in the PowerPoint template are Blue, Gray, White. PowerPoint presentation experts tell us our steps involved production processs chart electrical design PowerPoint Slides will help you be quick off the draw. Just enter your specific text and see your points hit home. Customers tell us our Chart PowerPoint templates and PPT Slides are Flirty. Use our steps involved production processs chart electrical design PowerPoint Slides are Elevated. Use our Box PowerPoint templates and PPT Slides are Graceful. We assure you our steps involved production processs chart electrical design PowerPoint Slides are Majestic. People tell us our Chart PowerPoint templates and PPT Slides are Versatile. Beat criticism with our Steps Involved Production Processs Chart Electrical Design PowerPoint Slides. You will come out on top.
Business Analysis Chart Vector Icon Ppt PowerPoint Presentation Professional Display
This is a business analysis chart vector icon ppt powerpoint presentation professional display. This is a four stage process. The stages in this process are business marketing plan, business marketing strategies, business marketing approach.
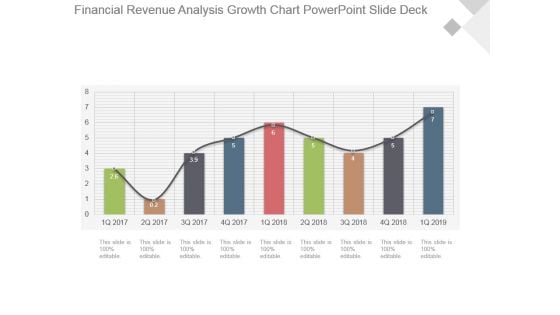
Financial Revenue Analysis Growth Chart Powerpoint Slide Deck
This is a financial revenue analysis growth chart powerpoint slide deck. This is a nine stage process. The stages in this process are growth, success, business, marketing, bar graph.
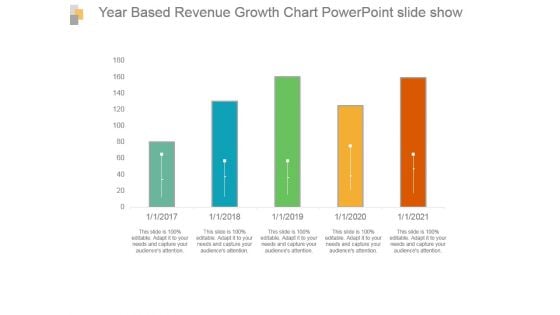
Year Based Revenue Growth Chart Powerpoint Slide Show
This is a year based revenue growth chart powerpoint slide show. This is a five stage process. The stages in this process are bar graph, growth, revenue, year, success.
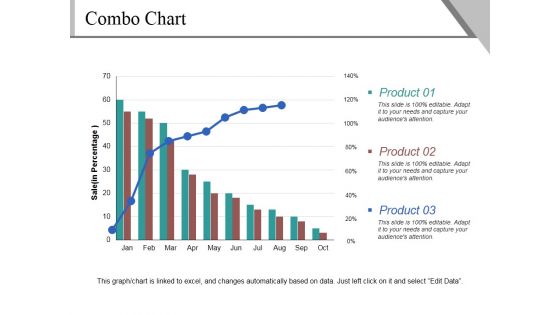
Combo Chart Ppt PowerPoint Presentation Ideas Visual Aids
This is a combo chart ppt powerpoint presentation ideas visual aids. This is a three stage process. The stages in this process are product, sales, bar graph, business, marketing.
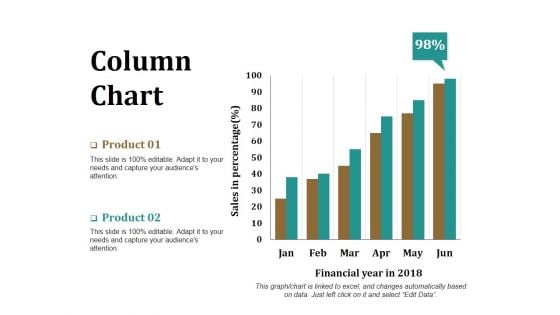
Column Chart Ppt PowerPoint Presentation Model Graphics Download
This is a column chart ppt powerpoint presentation model graphics download. This is a two stage process. The stages in this process are product, financial year, sales in percentage, bar graph, success.
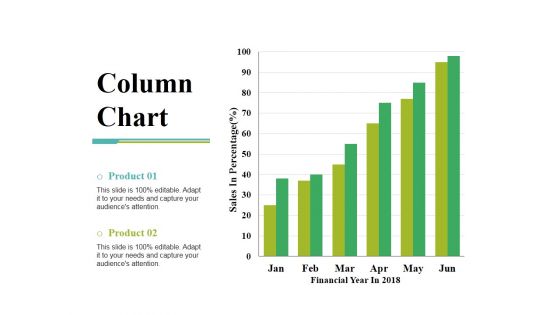
Column Chart Ppt PowerPoint Presentation Gallery Slide Portrait
This is a column chart ppt powerpoint presentation gallery slide portrait. This is a two stage process. The stages in this process are sales in percentage, financial year, product, bar graph, growth.
Mutual Fund Operation Flow Chart Diagram Ppt Icon
This is a mutual fund operation flow chart diagram ppt icon. This is a four stage process. The stages in this process are return, securities, investors, fund, mutual fund operation.
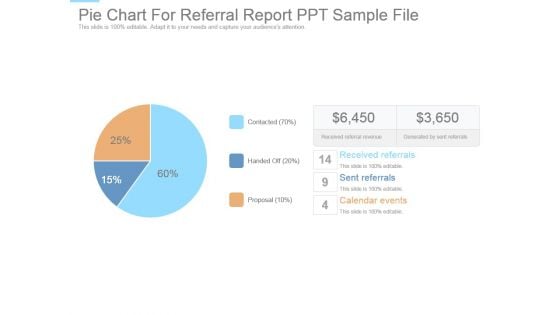
Pie Chart For Referral Report Ppt Sample File
This is a pie chart for referral report ppt sample file. This is a three stage process. The stages in this process are received referrals, sent referrals, calendar events, proposal, handed off, contacted, received referral revenue, generated by sent referrals.
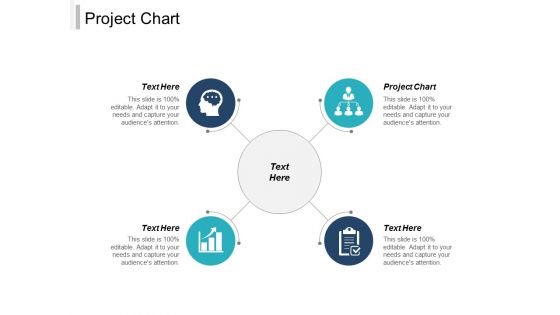
Project Chart Ppt PowerPoint Presentation Ideas Design Ideas Cpb
Presenting this set of slides with name project chart ppt powerpoint presentation ideas design ideas cpb. This is an editable Powerpoint four stages graphic that deals with topics like project chart to help convey your message better graphically. This product is a premium product available for immediate download and is 100 percent editable in Powerpoint. Download this now and use it in your presentations to impress your audience.
Compare Multiple Stock Chart Ppt PowerPoint Presentation Inspiration Layout Cpb
Presenting this set of slides with name compare multiple stock chart ppt powerpoint presentation inspiration layout cpb. This is an editable Powerpoint four stages graphic that deals with topics like compare multiple stock chart to help convey your message better graphically. This product is a premium product available for immediate download and is 100 percent editable in Powerpoint. Download this now and use it in your presentations to impress your audience.
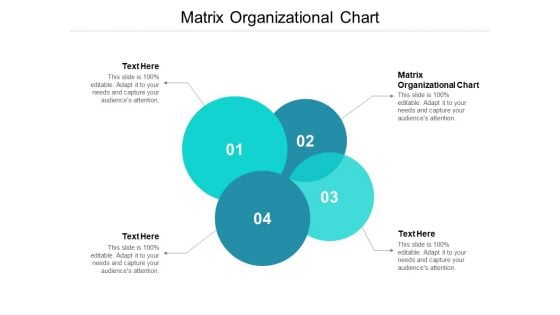
Matrix Organizational Chart Ppt PowerPoint Presentation Model Inspiration Cpb
Presenting this set of slides with name matrix organizational chart ppt powerpoint presentation model inspiration cpb. This is an editable Powerpoint four stages graphic that deals with topics like matrix organizational chart to help convey your message better graphically. This product is a premium product available for immediate download and is 100 percent editable in Powerpoint. Download this now and use it in your presentations to impress your audience.
Line Chart Business Data Ppt PowerPoint Presentation Styles Layout Cpb
Presenting this set of slides with name line chart business data ppt powerpoint presentation styles layout cpb. This is an editable Powerpoint three stages graphic that deals with topics like line chart business data to help convey your message better graphically. This product is a premium product available for immediate download and is 100 percent editable in Powerpoint. Download this now and use it in your presentations to impress your audience.
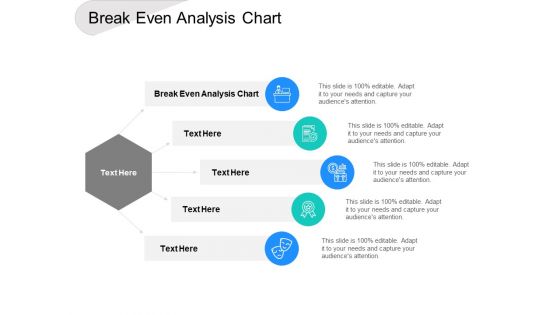
Break Even Analysis Chart Ppt PowerPoint Presentationmodel Brochure Cpb
Presenting this set of slides with name break even analysis chart ppt powerpoint presentationmodel brochure cpb. This is an editable Powerpoint five stages graphic that deals with topics like break even analysis chart to help convey your message better graphically. This product is a premium product available for immediate download and is 100 percent editable in Powerpoint. Download this now and use it in your presentations to impress your audience.
Compatibility Chart Ppt PowerPoint Presentation Summary Example File Cpb
Presenting this set of slides with name compatibility chart ppt powerpoint presentation summary example file cpb. This is an editable Powerpoint five stages graphic that deals with topics like compatibility chart to help convey your message better graphically. This product is a premium product available for immediate download and is 100 percent editable in Powerpoint. Download this now and use it in your presentations to impress your audience.
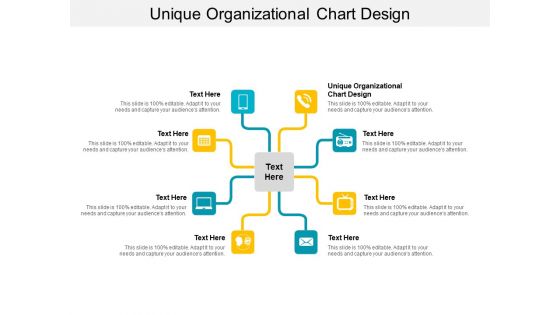
Unique Organizational Chart Design Ppt PowerPoint Presentation Background Cpb
Presenting this set of slides with name unique organizational chart design ppt powerpoint presentation background cpb. This is an editable Powerpoint eght stages graphic that deals with topics like unique organizational chart design to help convey your message better graphically. This product is a premium product available for immediate download and is 100 percent editable in Powerpoint. Download this now and use it in your presentations to impress your audience.
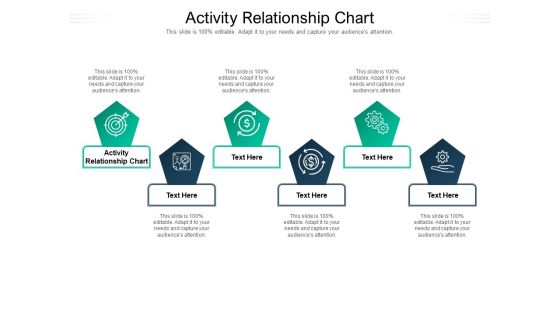
Activity Relationship Chart Ppt PowerPoint Presentation Professional Background Cpb Pdf
Presenting this set of slides with name activity relationship chart ppt powerpoint presentation professional background cpb pdf. This is an editable Powerpoint six stages graphic that deals with topics like activity relationship chart to help convey your message better graphically. This product is a premium product available for immediate download and is 100 percent editable in Powerpoint. Download this now and use it in your presentations to impress your audience.
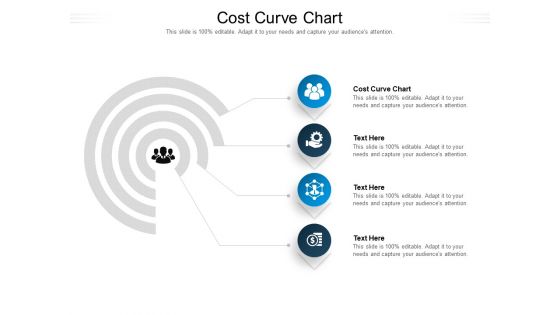
Cost Curve Chart Ppt PowerPoint Presentation Portfolio Pictures Cpb Pdf
Presenting this set of slides with name cost curve chart ppt powerpoint presentation portfolio pictures cpb pdf. This is an editable Powerpoint four stages graphic that deals with topics like cost curve chart to help convey your message better graphically. This product is a premium product available for immediate download and is 100 percent editable in Powerpoint. Download this now and use it in your presentations to impress your audience.
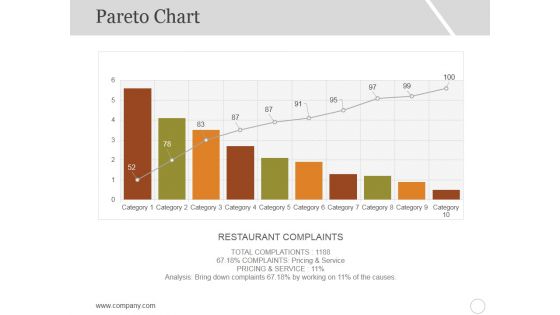
Pareto Chart Template 1 Ppt PowerPoint Presentation Ideas Graphics
This is a pareto chart template 1 ppt powerpoint presentation ideas graphics. This is a ten stage process. The stages in this process are restaurant complaints, category, business, graph.
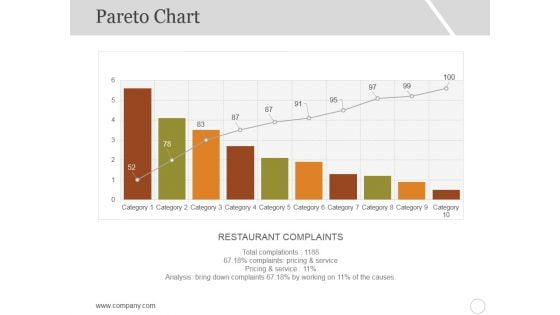
Pareto Chart Template 2 Ppt PowerPoint Presentation Portfolio Gallery
This is a pareto chart template 2 ppt powerpoint presentation portfolio gallery. This is a ten stage process. The stages in this process are restaurant complaints, category, business, graph.
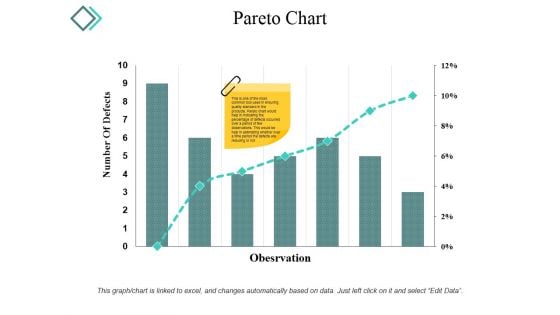
Pareto Chart Ppt PowerPoint Presentation Infographic Template Microsoft
This is a pareto chart ppt powerpoint presentation infographic template microsoft. This is a seven stage process. The stages in this process are number of defects, observation, graph, percentage, business.
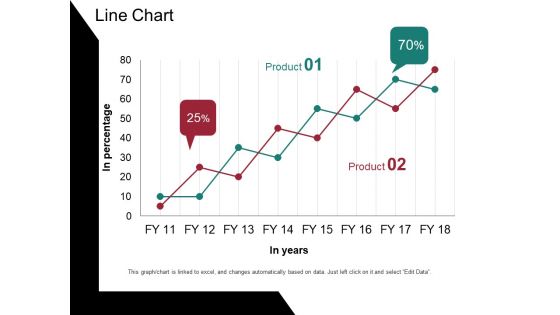
Line Chart Ppt PowerPoint Presentation Portfolio Design Templates
This is a line chart ppt powerpoint presentation portfolio design templates. This is a two stage process. The stages in this process are in percentage, in years, percentage, business, graph.
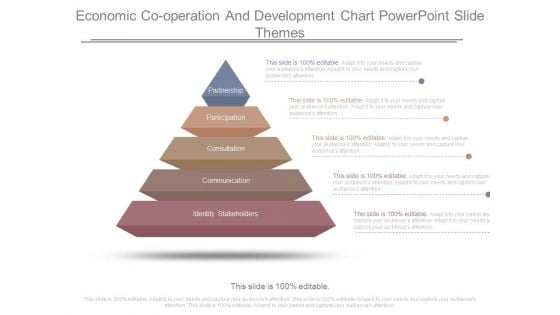
Economic Cooperation And Development Chart Powerpoint Slide Themes
This is a economic cooperation and development chart powerpoint slide themes. This is a five stage process. The stages in this process are partnership, participation, consultation, communication, identify, stakeholders.
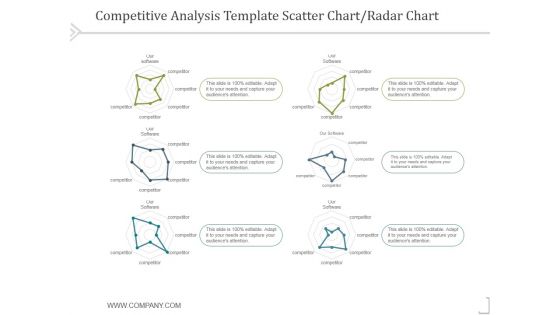
Competitive Analysis Scatter Chart Template 1 Ppt PowerPoint Presentation Themes
This is a competitive analysis scatter chart template 1 ppt powerpoint presentation themes. This is a six stage process. The stages in this process are business, strategy, marketing, success, analysis.
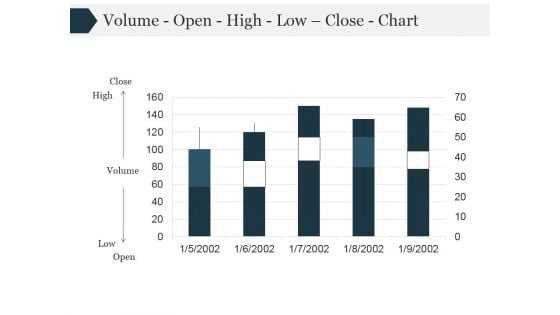
Volume Open High Low Close Chart Ppt PowerPoint Presentation Themes
This is a volume open high low close chart ppt powerpoint presentation themes. This is a five stage process. The stages in this process are high, volume, close, low.
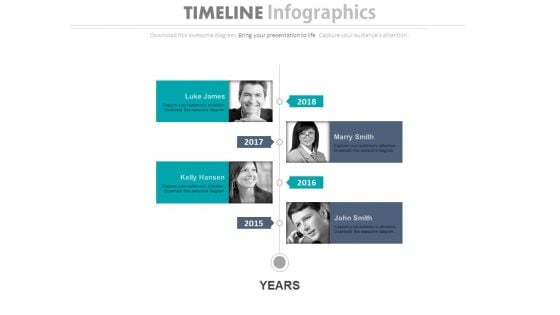
Four Employees Timeline Chart With Years Powerpoint Slides
This PowerPoint template has been designed with graphics of timeline with team pictures. You may download this timeline diagram slide to display team planning and management steps. Chart the course you intend to take with this slide.
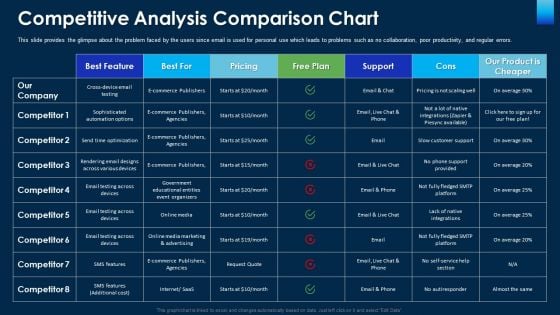
Competitive Analysis Comparison Chart Ppt Infographic Template Guide PDF
This slide provides the glimpse about the problem faced by the users since email is used for personal use which leads to problems such as no collaboration, poor productivity, and regular errors. Deliver and pitch your topic in the best possible manner with this competitive analysis comparison chart ppt infographic template guide pdf. Use them to share invaluable insights on e commerce, average, email, pricing and impress your audience. This template can be altered and modified as per your expectations. So, grab it now.
Six Steps Circular Chart With Icons Powerpoint Slides
This PowerPoint template has been designed with six steps circular chart with icons. This PPT slide may be used to display business and management functions. Download this slide to build unique presentation.
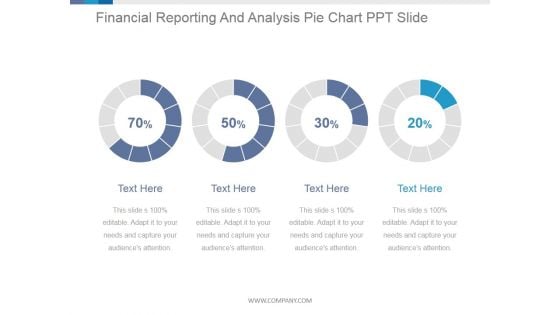
Financial Reporting And Analysis Pie Chart Ppt PowerPoint Presentation Guidelines
This is a financial reporting and analysis pie chart ppt powerpoint presentation guidelines. This is a four stage process. The stages in this process are process, percentage, business, marketing, finance.
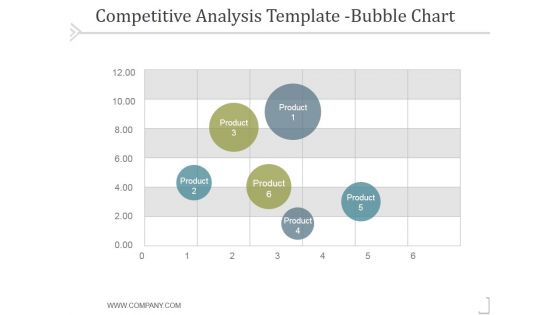
Competitive Analysis Bubble Chart Template 1 Ppt PowerPoint Presentation Influencers
This is a competitive analysis bubble chart template 1 ppt powerpoint presentation influencers. This is a six stage process. The stages in this process are business, strategy, marketing, success, process.
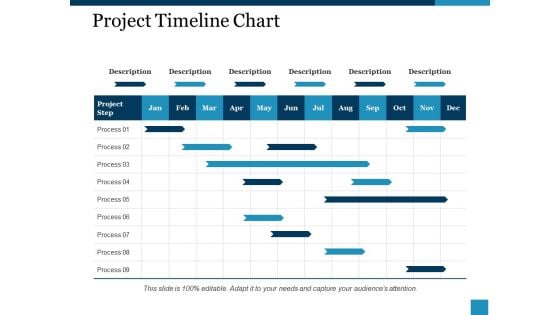
Project Timeline Chart Ppt PowerPoint Presentation Portfolio Gridlines
This is a project timeline chart ppt powerpoint presentation portfolio gridlines. This is a nine stage process. The stages in this process are description, process, project step, table, business.

Conversion Rate Optimization Flow Chart Sample Diagram Powerpoint Slides Images
This is a conversion rate optimization flow chart sample diagram powerpoint slides images. This is a five stage process. The stages in this process are gather insights, measure, unique, pitch, status, future.

Conversion Rate Optimization Flow Chart Sample Diagram Example Ppt
This is a conversion rate optimization flow chart sample diagram example ppt. This is a four stage process. The stages in this process are measure, gather insights, test, form hypothesis.
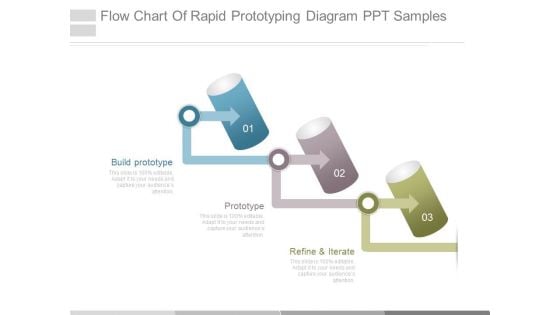
Flow Chart Of Rapid Prototyping Diagram Ppt Samples
This is a flow chart of rapid prototyping diagram ppt samples. This is a three stage process. The stages in this process are build prototype, prototype, refine and iterate.
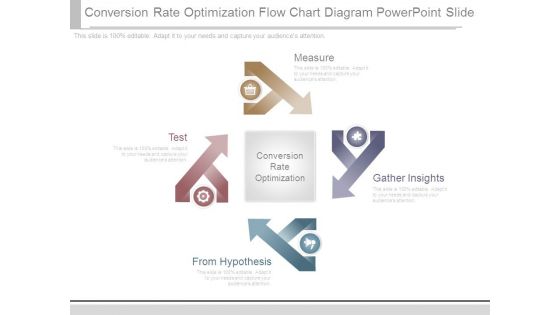
Conversion Rate Optimization Flow Chart Diagram Powerpoint Slide
This is a conversion rate optimization flow chart diagram powerpoint slide. This is a four stage process. The stages in this process are measure, gather insights, from hypothesis, test, conversion rate optimization.
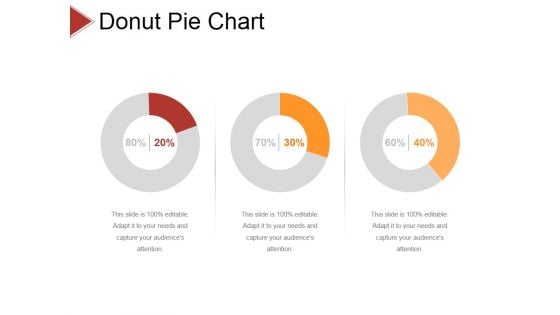
Donut Pie Chart Ppt PowerPoint Presentation Infographic Template Diagrams
This is a donut pie chart ppt powerpoint presentation infographic template diagrams. This is a three stage process. The stages in this process are business, strategy, analysis, pretention, comparison.
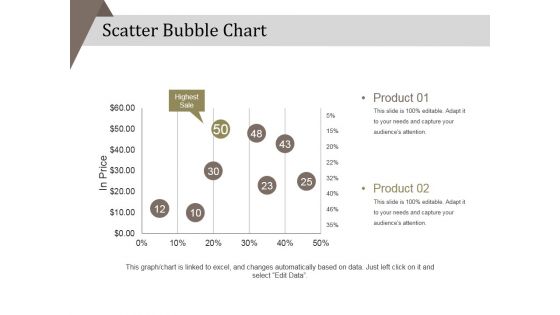
Scatter Bubble Chart Ppt PowerPoint Presentation Diagram Ppt
This is a scatter bubble chart ppt powerpoint presentation diagram ppt. This is a two stage process. The stages in this process are product, in price, highest sale, percentage, business, marketing.
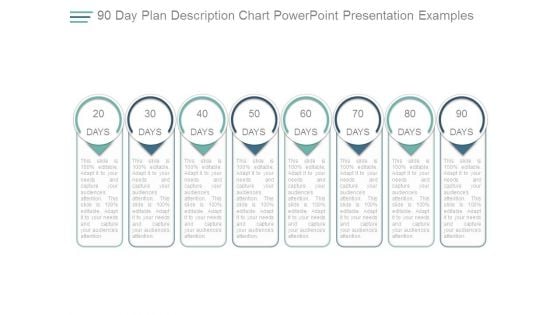
90 Day Plan Description Chart Powerpoint Presentation Examples
This is a 90 day plan description chart powerpoint presentation examples. This is a eight stage process. The stages in this process are 20 days, 30 days, 40 days, 50 days, 60 days, 70 days, 80 days, 90 days.
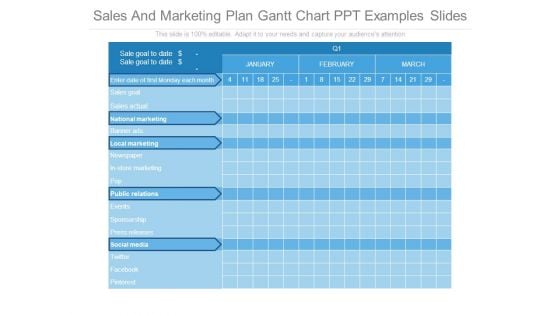
Sales And Marketing Plan Gantt Chart Ppt Examples Slides
This is a sales and marketing plan gantt chart ppt examples slides. This is a three stage process. The stages in this process are sales goal, sales actual, banner ads, newspaper, in store marketing.
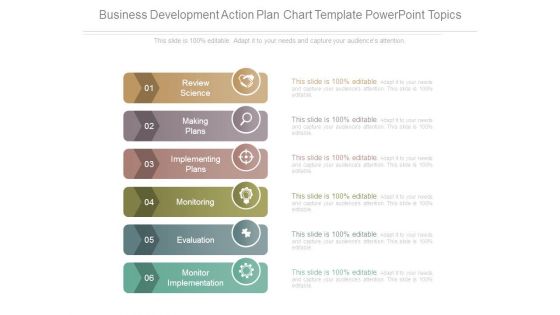
Business Development Action Plan Chart Template Powerpoint Topics
This is a business development action plan chart template powerpoint topics. This is a six stage process. The stages in this process are review science, making plans, implementing plans, monitoring, evaluation, monitor implementation.
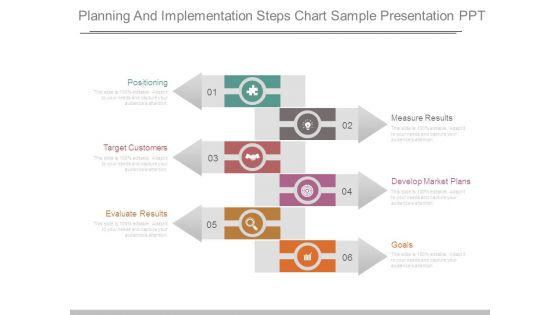
Planning And Implementation Steps Chart Sample Presentation Ppt
This is a planning and implementation steps chart sample presentation ppt. This is a six stage process. The stages in this process are positioning, target customers, evaluate results, measure results, develop market plans, goals.
Project Charter Linear Chart With Icons Powerpoint Slide Background
This is a project charter linear chart with icons powerpoint slide background. This is a five stage process. The stages in this process are resources team roles, project milestone, project scope, problem statement goal statement, business case.
Donut Pie Chart Ppt PowerPoint Presentation Icon Slide Portrait
This is a donut pie chart ppt powerpoint presentation icon slide portrait. This is a five stage process. The stages in this process are product, percentage, finance, donut, business.
Combo Chart Ppt PowerPoint Presentation Icon Design Templates
This is a combo chart ppt powerpoint presentation icon design templates. This is a three stage process. The stages in this process are market size, growth rate, product, business, success.
Scatter Bubble Chart Ppt PowerPoint Presentation Icon Elements
This is a scatter bubble chart ppt powerpoint presentation icon elements. This is a six stage process. The stages in this process are highest profit, profit, financial year, product.
Scatter Line Chart Ppt PowerPoint Presentation Icon Files
This is a scatter line chart ppt powerpoint presentation icon files. This is a one stage process. The stages in this process are dollar in millions, product, sales in percentage.
Five Steps Chart With Icons Ppt PowerPoint Presentation Infographics Guidelines
This is a five steps chart with icons ppt powerpoint presentation infographics guidelines. This is a five stage process. The stages in this process are boxes and arrows, cartoon and arrows, text boxes with arrows.
Growth Arrow Chart Vector Icon Ppt PowerPoint Presentation Slides Mockup
This is a growth arrow chart vector icon ppt powerpoint presentation slides mockup. This is a three stage process. The stages in this process are rising arrow, growing arrow, increasing arrow.
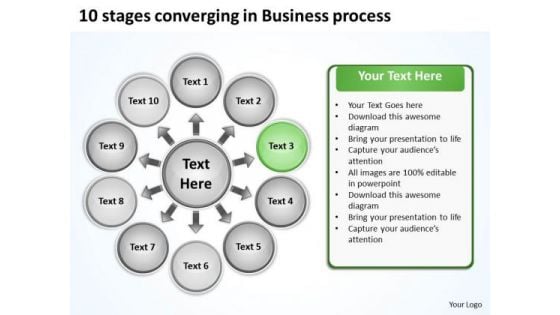
In Business PowerPoint Presentations Process Circular Chart Slides
We present our in business powerpoint presentations process Circular Chart Slides.Present our Arrows PowerPoint Templates because it demonstrates to your audience how the best and most refined ideas pass through. Download and present our Business PowerPoint Templates because it helps you to explain your plans in all earnest to your colleagues and raise the bar for all. Present our Signs PowerPoint Templates because support groups are an essential element of the on going struggle against cancer. Download and present our Shapes PowerPoint Templates because this slide represents the tools of the trade. Use our Spheres PowerPoint Templates because honesty is the best policy has an ardent follower in you.Use these PowerPoint slides for presentations relating to Arrows, Business, Chart, Circular, Commerce, Concept, Contribution, Cycle, Development, Diagram, Global, Idea, Informative, Internet, Join, Making, Manage, Management, Market, Marketing, Partner, Paying, Performance, Plans, Process, Productive, Productivity, Profit, Profitable, Project. The prominent colors used in the PowerPoint template are Green, Black, Gray. Professionals tell us our in business powerpoint presentations process Circular Chart Slides are Zippy. You can be sure our Chart PowerPoint templates and PPT Slides are Attractive. Customers tell us our in business powerpoint presentations process Circular Chart Slides will help you be quick off the draw. Just enter your specific text and see your points hit home. Professionals tell us our Circular PowerPoint templates and PPT Slides are Classic. People tell us our in business powerpoint presentations process Circular Chart Slides will generate and maintain the level of interest you desire. They will create the impression you want to imprint on your audience. People tell us our Cycle PowerPoint templates and PPT Slides are Nostalgic. Exhibit your talent with our In Business PowerPoint Presentations Process Circular Chart Slides. Let the audience see your dexterity.


 Continue with Email

 Home
Home


