Snapshot
HR Process Analysis Vector Icon Ppt PowerPoint Presentation Styles Professional PDF
Presenting HR process analysis vector icon ppt powerpoint presentation styles professional pdf to dispense important information. This template comprises three stages. It also presents valuable insights into the topics including hr process analysis vector icon. This is a completely customizable PowerPoint theme that can be put to use immediately. So, download it and address the topic impactfully.

Data Analytics Management Big Data Architecture Layers Introduction PDF
This slide describes the layers of big data architecture that include the big data source layer, management storage layer, analysis layer, and consumption layer.This is a Data Analytics Management Big Data Architecture Layers Introduction PDF template with various stages. Focus and dispense information on four stages using this creative set, that comes with editable features. It contains large content boxes to add your information on topics like Data Sources, Analysis Layer, Management Storage. You can also showcase facts, figures, and other relevant content using this PPT layout. Grab it now.
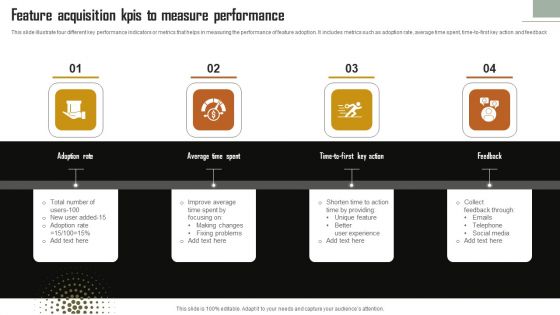
Feature Acquisition Kpis To Measure Performance Themes PDF
This slide illustrate four different key performance indicators or metrics that helps in measuring the performance of feature adoption. It includes metrics such as adoption rate, average time spent, time-to-first key action and feedback. Persuade your audience using this Feature Acquisition Kpis To Measure Performance Themes PDF. This PPT design covers four stages, thus making it a great tool to use. It also caters to a variety of topics including Adoption Rate, Average Time Spent, Feedback. Download this PPT design now to present a convincing pitch that not only emphasizes the topic but also showcases your presentation skills.

Incident Management Dashboard Ppt PowerPoint Presentation Complete Deck With Slides
Boost your confidence and team morale with this well structured Incident Management Dashboard Ppt PowerPoint Presentation Complete Deck With Slides. This prefabricated set gives a voice to your presentation because of its well researched content and graphics. Our experts have added all the components very carefully, thus helping you deliver great presentations with a single click. Not only that, it contains a set of Twenty slides that are designed using the right visuals, graphics, etc. Various topics can be discussed, and effective brainstorming sessions can be conducted using the wide variety of slides added in this complete deck. Apart from this, our PPT design contains clear instructions to help you restructure your presentations and create multiple variations. The color, format, design anything can be modified as deemed fit by the user. Not only this, it is available for immediate download. So, grab it now.
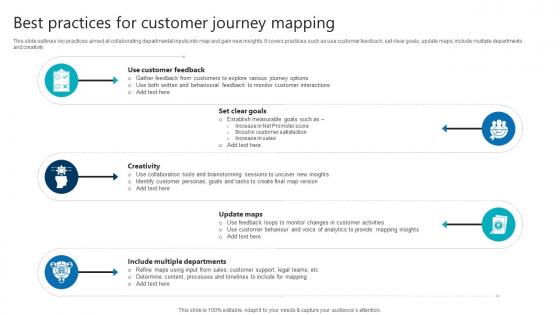
Best Practices For Customer Journey Mapping Product Analytics Implementation Data Analytics V
This slide outlines key practices aimed at collaborating departmental inputs into map and gain new insights. It covers practices such as use customer feedback, set clear goals, update maps, include multiple departments and creativity.Want to ace your presentation in front of a live audience Our Best Practices For Customer Journey Mapping Product Analytics Implementation Data Analytics V can help you do that by engaging all the users towards you. Slidegeeks experts have put their efforts and expertise into creating these impeccable powerpoint presentations so that you can communicate your ideas clearly. Moreover, all the templates are customizable, and easy-to-edit and downloadable. Use these for both personal and commercial use. This slide outlines key practices aimed at collaborating departmental inputs into map and gain new insights. It covers practices such as use customer feedback, set clear goals, update maps, include multiple departments and creativity.
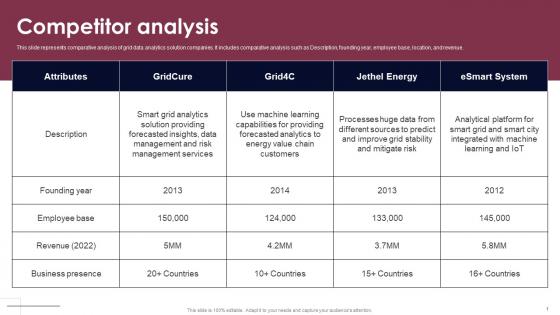
Competitor Analysis Smart Grid Analytics Investor Fund Raising Inspiration PDF
This slide represents comparative analysis of grid data analytics solution companies. It includes comparative analysis such as Description, founding year, employee base, location, and revenue. Want to ace your presentation in front of a live audience Our Competitor Analysis Smart Grid Analytics Investor Fund Raising Inspiration PDF can help you do that by engaging all the users towards you. Slidegeeks experts have put their efforts and expertise into creating these impeccable powerpoint presentations so that you can communicate your ideas clearly. Moreover, all the templates are customizable, and easy-to-edit and downloadable. Use these for both personal and commercial use. This slide represents comparative analysis of grid data analytics solution companies. It includes comparative analysis such as Description, founding year, employee base, location, and revenue.
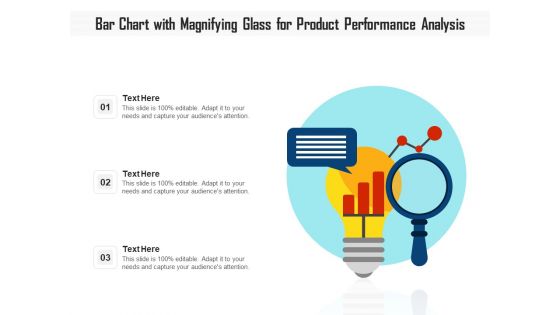
Bar Chart With Magnifying Glass For Product Performance Analysis Ppt PowerPoint Presentation Gallery Example File PDF
Presenting bar chart with magnifying glass for product performance analysis ppt powerpoint presentation gallery example file pdf to dispense important information. This template comprises three stages. It also presents valuable insights into the topics including bar chart with magnifying glass for product performance analysis. This is a completely customizable PowerPoint theme that can be put to use immediately. So, download it and address the topic impactfully.
Electric Circuit Issues Analysis Vector Icon Ppt PowerPoint Presentation Gallery Graphics Template PDF
Persuade your audience using this electric circuit issues analysis vector icon ppt powerpoint presentation gallery graphics template pdf. This PPT design covers three stages, thus making it a great tool to use. It also caters to a variety of topics including electric circuit issues analysis vector icon. Download this PPT design now to present a convincing pitch that not only emphasizes the topic but also showcases your presentation skills.
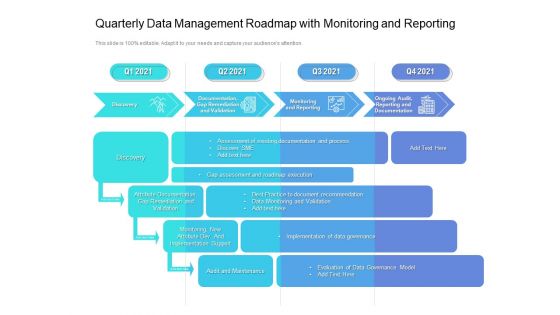
Quarterly Data Management Roadmap With Monitoring And Reporting Infographics
We present our quarterly data management roadmap with monitoring and reporting infographics. This PowerPoint layout is easy-to-edit so you can change the font size, font type, color, and shape conveniently. In addition to this, the PowerPoint layout is Google Slides compatible, so you can share it with your audience and give them access to edit it. Therefore, download and save this well-researched quarterly data management roadmap with monitoring and reporting infographics in different formats like PDF, PNG, and JPG to smoothly execute your business plan.
Performance Monitoring Dashboard Ppt PowerPoint Presentation Complete Deck With Slides
Share a great deal of information on the topic by deploying this Performance Monitoring Dashboard Ppt PowerPoint Presentation Complete Deck With Slides. Support your ideas and thought process with this prefabricated set. It includes a set of twelve slides, all fully modifiable and editable. Each slide can be restructured and induced with the information and content of your choice. You can add or remove large content boxes as well, to make this PPT slideshow more personalized. Its high-quality graphics and visuals help in presenting a well-coordinated pitch. This PPT template is also a resourceful tool to take visual cues from and implement the best ideas to help your business grow and expand. The main attraction of this well-formulated deck is that everything is editable, giving you the freedom to adjust it to your liking and choice. Changes can be made in the background and theme as well to deliver an outstanding pitch. Therefore, click on the download button now to gain full access to this multifunctional set.
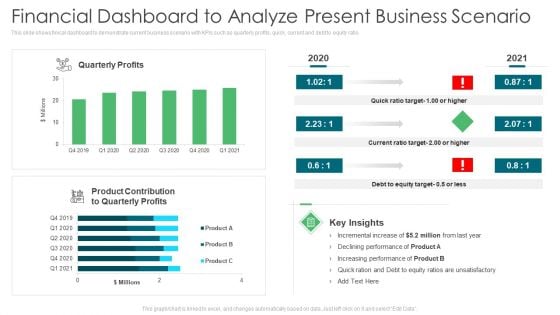
Environmental Assessment Financial Dashboard To Analyze Present Business Scenario Ppt Infographics Ideas PDF
This slide shows finical dashboard to demonstrate current business scenario with KPIs such as quarterly profits, quick, current and debt to equity ratio. Deliver an awe inspiring pitch with this creative environmental assessment financial dashboard to analyze present business scenario ppt infographics ideas pdf bundle. Topics like product contribution, increasing performance, equity target can be discussed with this completely editable template. It is available for immediate download depending on the needs and requirements of the user.
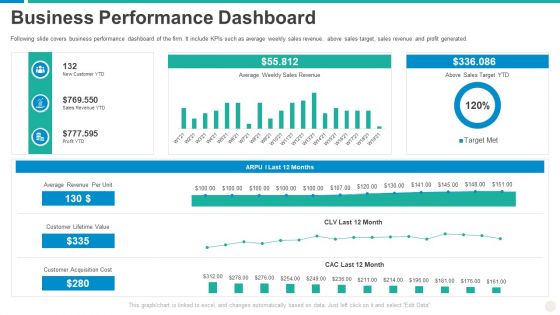
Establishing Successful Brand Strategy To Captivate Consumers Business Performance Dashboard Microsoft PDF
Following slide covers business performance dashboard of the firm. It include KPIs such as average weekly sales revenue, above sales target, sales revenue and profit generated. Deliver an awe inspiring pitch with this creative establishing successful brand strategy to captivate consumers business performance dashboard microsoft pdf bundle. Topics like customer acquisition cost, customer lifetime value, average revenue per unit can be discussed with this completely editable template. It is available for immediate download depending on the needs and requirements of the user.
Successful Brand Development Plan Business Performance Measuring KPI Dashboard Icons PDF
Following slide covers business performance dashboard of the firm. It include KPIs such as average weekly sales revenue, above sales target, sales revenue and profit generated.Deliver and pitch your topic in the best possible manner with this successful brand development plan business performance measuring kpi dashboard icons pdf Use them to share invaluable insights on average revenue, customer lifetime value, customer acquisition cost and impress your audience. This template can be altered and modified as per your expectations. So, grab it now.
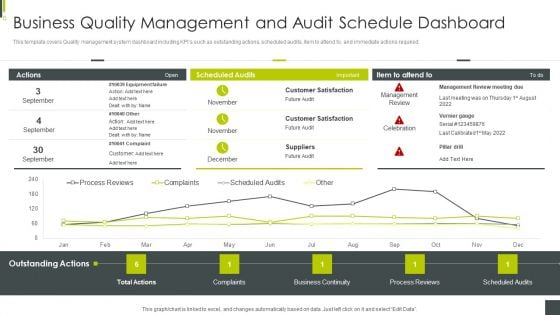
ISO 9001 Certification Procedure Business Quality Management And Audit Schedule Dashboard Inspiration PDF
This template covers Quality management system dashboard including KPIs such as outstanding actions, scheduled audits, item to attend to, and immediate actions required. Deliver and pitch your topic in the best possible manner with this ISO 9001 Certification Procedure Business Quality Management And Audit Schedule Dashboard Inspiration PDF. Use them to share invaluable insights on Suppliers, Customer Satisfaction, Business Quality Management and impress your audience. This template can be altered and modified as per your expectations. So, grab it now.

ISO 9001 Quality Assurance Software Accreditation Business Quality Management And Audit Schedule Dashboard Infographics PDF
This template covers Quality management system dashboard including KPIs such as outstanding actions, scheduled audits, item to attend to, and immediate actions required. Deliver an awe inspiring pitch with this creative ISO 9001 Quality Assurance Software Accreditation Business Quality Management And Audit Schedule Dashboard Infographics PDF bundle. Topics like Customer Satisfaction, Management Review Meeting, Business Continuity can be discussed with this completely editable template. It is available for immediate download depending on the needs and requirements of the user.
ISO 9001 Standard For Quality Control Business Quality Management And Audit Schedule Dashboard Icons PDF
This template covers quality management system dashboard including kpis such as outstanding actions, scheduled audits, item to attend to, and immediate actions required Deliver an awe inspiring pitch with this creative ISO 9001 Standard For Quality Control Business Quality Management And Audit Schedule Dashboard Icons PDF bundle. Topics like Customer Satisfaction, Management Review Meeting Due, Business Continuity can be discussed with this completely editable template. It is available for immediate download depending on the needs and requirements of the user.
Catering Business Advertisement Plan KPI Dashboard With Revenue Comparison Icons PDF
This slide shows the KPI dashboard of the catering industry to evaluate the actual and potential targets. It includes KPIs such as expenditure, sales revenue, beverage, etc. Showcasing this set of slides titled Catering Business Advertisement Plan KPI Dashboard With Revenue Comparison Icons PDF. The topics addressed in these templates are Expenditure, Revenue Comparison, Department. All the content presented in this PPT design is completely editable. Download it and make adjustments in color, background, font etc. as per your unique business setting.
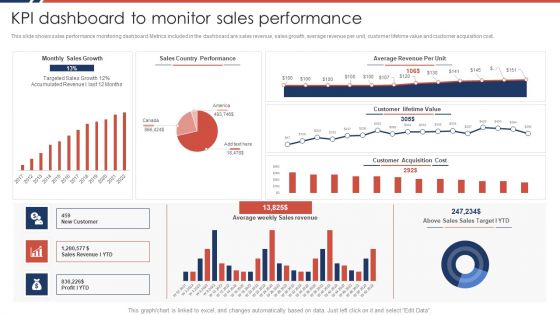
Effective Sales Plan For New Product Introduction In Market KPI Dashboard To Monitor Sales Performance Portrait PDF
This slide shows sales performance monitoring dashboard. Metrics included in the dashboard are sales revenue, sales growth, average revenue per unit, customer lifetime value and customer acquisition cost.Deliver an awe inspiring pitch with this creative Effective Sales Plan For New Product Introduction In Market KPI Dashboard To Monitor Sales Performance Portrait PDF bundle. Topics like Average Revenue, Country Performance, Customer Lifetime can be discussed with this completely editable template. It is available for immediate download depending on the needs and requirements of the user.
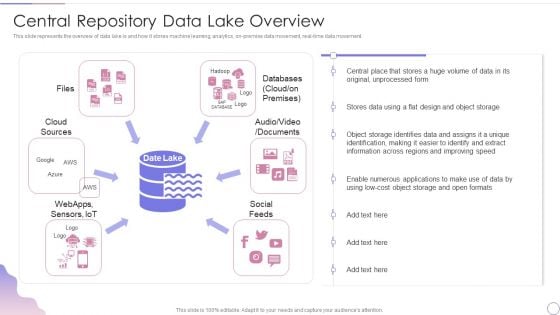
Data Lake Architecture Future Of Data Analysis Central Repository Data Lake Overview Pictures PDF
This slide represents the overview of data lake is and how it stores machine learning, analytics, on-premise data movement, real-time data movement.Deliver and pitch your topic in the best possible manner with this Data Lake Architecture Future Of Data Analysis Central Repository Data Lake Overview Pictures PDF. Use them to share invaluable insights on Cloud Sources, Storage Identifies, Information Across and impress your audience. This template can be altered and modified as per your expectations. So, grab it now.
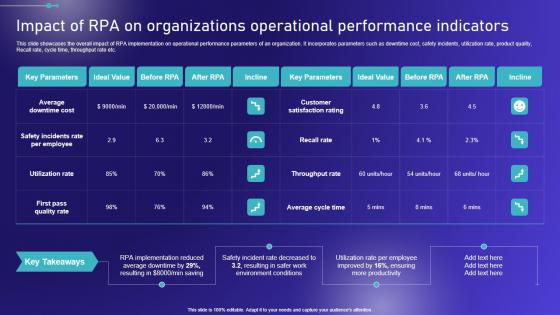
Impact Of On Organizations Operational Performance Embracing Robotic Process Diagrams PDF
This slide showcases the overall impact of RPA implementation on operational performance parameters of an organization. It incorporates parameters such as downtime cost, safety incidents, utilization rate, product quality, Recall rate, cycle time, throughput rate etc. Are you searching for a Impact Of On Organizations Operational Performance Embracing Robotic Process Diagrams PDF that is uncluttered, straightforward, and original Its easy to edit, and you can change the colors to suit your personal or business branding. For a presentation that expresses how much effort you have put in, this template is ideal With all of its features, including tables, diagrams, statistics, and lists, its perfect for a business plan presentation. Make your ideas more appealing with these professional slides. Download Impact Of On Organizations Operational Performance Embracing Robotic Process Diagrams PDF from Slidegeeks today. This slide showcases the overall impact of RPA implementation on operational performance parameters of an organization. It incorporates parameters such as downtime cost, safety incidents, utilization rate, product quality, Recall rate, cycle time, throughput rate etc.

Call Center Metrics Ppt PowerPoint Presentation Complete Deck With Slides
If designing a presentation takes a lot of your time and resources and you are looking for a better alternative, then this Call Center Metrics Ppt PowerPoint Presentation Complete Deck With Slides is the right fit for you. This is a prefabricated set that can help you deliver a great presentation on the topic. All the thirteen slides included in this sample template can be used to present a birds eye view of the topic. These slides are also fully editable, giving you enough freedom to add specific details to make this layout more suited to your business setting. Apart from the content, all other elements like color, design, theme are also replaceable and editable. This helps in designing a variety of presentations with a single layout. Not only this, you can use this PPT design in formats like PDF, PNG, and JPG once downloaded. Therefore, without any further ado, download and utilize this sample presentation as per your liking.

Call Center Business Plan Go To Market Strategy
You can survive and sail through cut-throat competition if you have the right skills and products at hand. If a business plan is on your upcoming agenda, then it will not be wise of you to proceed in absence of our well-designed Call Center Business Plan Go To Market Strategy document. Our business plan word document swears by in-depth detailing and thus answers every question that may hit you or your audience at any point of time. Whats more, are the multi-fold benefits that our word document offers. Made up of high-resolution graphics, this document does not hamper when projected on a wide screen. Being pre-designed and thoroughly editable this ready-made business plan saves a lot of the presenters time and efforts which otherwise get wasted in designing the business plan from scratch. We make our business plan word documents available to you keeping in mind the competitive edge. Join your hands with us now.
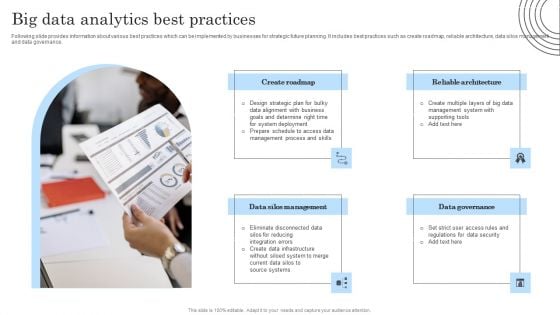
Big Data Analytics Best Practices Mockup PDF
Following slide provides information about various best practices which can be implemented by businesses for strategic future planning. It includes best practices such as create roadmap, reliable architecture, data silos management and data governance. Persuade your audience using this Big Data Analytics Best Practices Mockup PDF. This PPT design covers four stages, thus making it a great tool to use. It also caters to a variety of topics including Data Governance, Reliable Architecture, Data Silos Management. Download this PPT design now to present a convincing pitch that not only emphasizes the topic but also showcases your presentation skills.
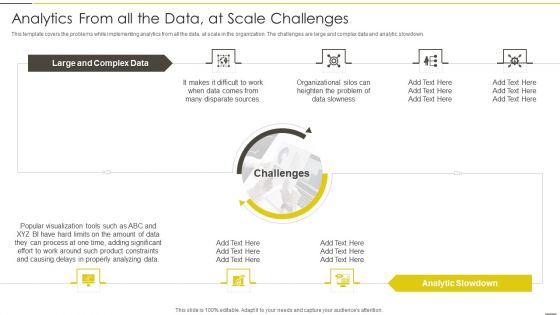
Administered Data And Analytic Quality Playbook Analytics From All The Data Information PDF
This template covers the problems while implementing analytics from all the data, at scale in the organization. The challenges are large and complex data and analytic slowdown.Deliver an awe inspiring pitch with this creative Administered Data And Analytic Quality Playbook Analytics From All The Data Information PDF bundle. Topics like Disparate Sources, Organizational Silos, Heighten Problem can be discussed with this completely editable template. It is available for immediate download depending on the needs and requirements of the user.
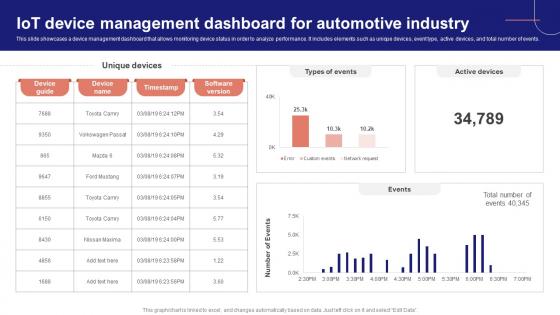
IoT Device Management Fundamentals IoT Device Management Dashboard For Automotive IoT Ss V
This slide showcases a device management dashboard that allows monitoring device status in order to analyze performance. It includes elements such as unique devices, event type, active devices, and total number of events. Create an editable IoT Device Management Fundamentals IoT Device Management Dashboard For Automotive IoT SS V that communicates your idea and engages your audience. Whether you are presenting a business or an educational presentation, pre-designed presentation templates help save time. IoT Device Management Fundamentals IoT Device Management Dashboard For Automotive IoT SS V is highly customizable and very easy to edit, covering many different styles from creative to business presentations. Slidegeeks has creative team members who have crafted amazing templates. So, go and get them without any delay. This slide showcases a device management dashboard that allows monitoring device status in order to analyze performance. It includes elements such as unique devices, event type, active devices, and total number of events.
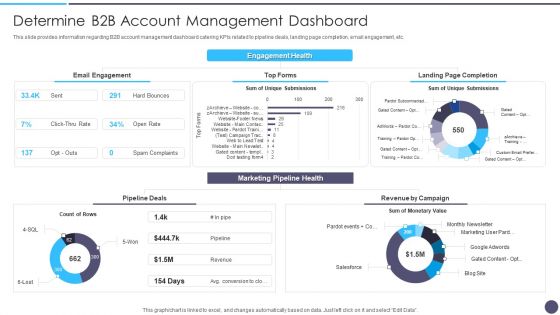
Defined Sales Assistance For Business Clients Determine B2B Account Management Dashboard Summary PDF
This slide provides information regarding B2B account management dashboard catering KPIs related to pipeline deals, landing page completion, email engagement, etc. Deliver an awe inspiring pitch with this creative Defined Sales Assistance For Business Clients Determine B2B Account Management Dashboard Summary PDF bundle. Topics like Marketing Pipeline Health, Engagement Health, Landing Page Completion can be discussed with this completely editable template. It is available for immediate download depending on the needs and requirements of the user.
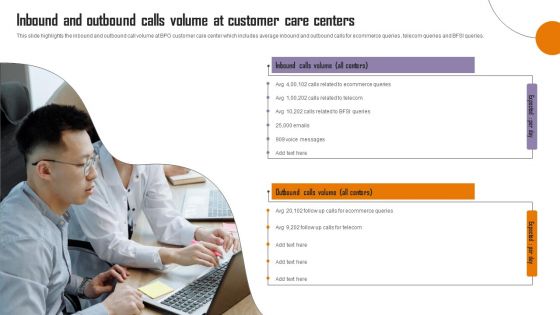
Strategies To Enhance Call Center Management Inbound And Outbound Calls Volume Demonstration PDF
This slide highlights the inbound and outbound call volume at BPO customer care center which includes average inbound and outbound calls for ecommerce queries , telecom queries and BFSI queries. There are so many reasons you need a Strategies To Enhance Call Center Management Inbound And Outbound Calls Volume Demonstration PDF. The first reason is you cant spend time making everything from scratch, Thus, Slidegeeks has made presentation templates for you too. You can easily download these templates from our website easily.
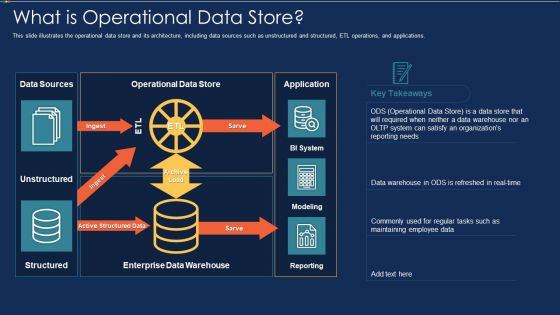
Data Warehousing IT What Is Operational Data Store Ppt Infographic Template Images PDF
This slide illustrates the operational data store and its architecture, including data sources such as unstructured and structured, ETL operations, and applications. Deliver and pitch your topic in the best possible manner with this data warehousing it what is operational data store ppt infographic template images pdf. Use them to share invaluable insights on modeling, reporting, bi system, application, data sources, operational data store, enterprise data warehouse and impress your audience. This template can be altered and modified as per your expectations. So, grab it now.
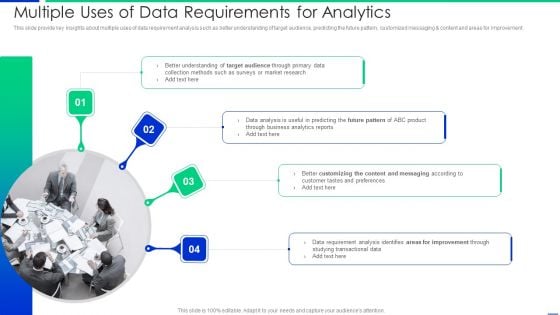
Multiple Uses Of Data Requirements For Analytics Pictures PDF
This slide provide key insights about multiple uses of data requirement analysis such as better understanding of target audience, predicting the future pattern, customized messaging and content and areas for improvement. Presenting multiple uses of data requirements for analytics pictures pdf to dispense important information. This template comprises four stages. It also presents valuable insights into the topics including analysis, customer, requirement. This is a completely customizable PowerPoint theme that can be put to use immediately. So, download it and address the topic impactfully.
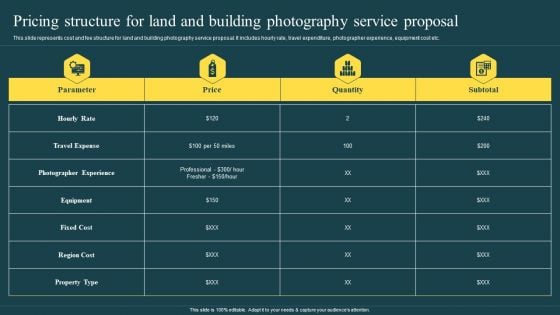
Pricing Structure For Land And Building Photography Service Proposal Ppt Pictures Sample PDF
This slide represents cost and fee structure for land and building photography service proposal. It includes hourly rate, travel expenditure, photographer experience, equipment cost etc. Presenting this PowerPoint presentation, titled Pricing Structure For Land And Building Photography Service Proposal Ppt Pictures Sample PDF, with topics curated by our researchers after extensive research. This editable presentation is available for immediate download and provides attractive features when used. Download now and captivate your audience. Presenting this Pricing Structure For Land And Building Photography Service Proposal Ppt Pictures Sample PDF. Our researchers have carefully researched and created these slides with all aspects taken into consideration. This is a completely customizable Pricing Structure For Land And Building Photography Service Proposal Ppt Pictures Sample PDF that is available for immediate downloading. Download now and make an impact on your audience. Highlight the attractive features available with our PPTs.
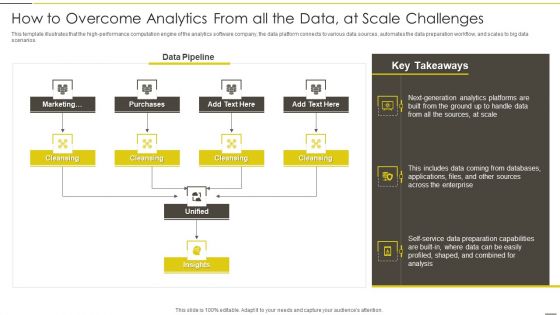
Administered Data And Analytic Quality Playbook How To Overcome Analytics From All The Data Guidelines PDF
This template illustrates that the high performance computation engine of the analytics software company, the data platform connects to various data sources, automates the data preparation workflow, and scales to big data scenarios.Deliver and pitch your topic in the best possible manner with this Administered Data And Analytic Quality Playbook How To Overcome Analytics From All The Data Guidelines PDF Use them to share invaluable insights on Generation Analytics, Across Enterprise, Preparation Capabilities and impress your audience. This template can be altered and modified as per your expectations. So, grab it now.
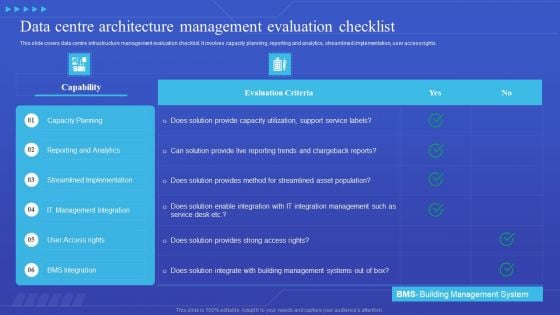
Data Centre Architecture Management Evaluation Checklist Designs PDF
This slide covers data centre infrastructure management evaluation checklist. It involves capacity planning, reporting and analytics, streamlined implementation, user access rights. Pitch your topic with ease and precision using this Data Centre Architecture Management Evaluation Checklist Designs PDF. This layout presents information on Capacity Planning, Reporting And Analytics, IT Management Integration. It is also available for immediate download and adjustment. So, changes can be made in the color, design, graphics or any other component to create a unique layout.
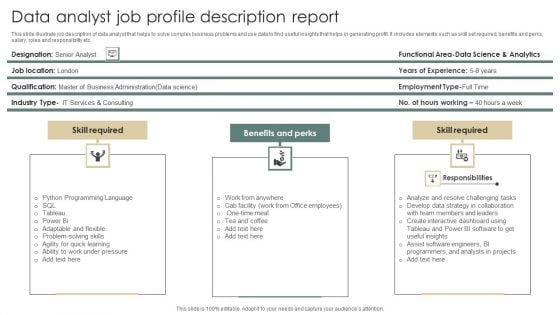
Data Analyst Job Profile Description Report Infographics PDF
This slide illustrate job description of data analyst that helps to solve complex business problems and use data to find useful insights that helps in generating profit. It includes elements such as skill set required, benefits and perks, salary, roles and responsibility etc. Presenting Data Analyst Job Profile Description Report Infographics PDF to dispense important information. This template comprises three stages. It also presents valuable insights into the topics including Skill Required, Benefits Perks, Skill Required. This is a completely customizable PowerPoint theme that can be put to use immediately. So, download it and address the topic impactfully.
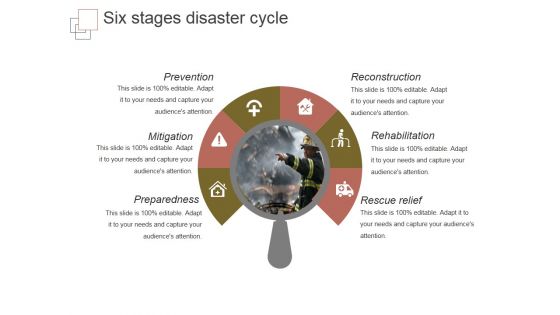
Six Stages Disaster Cycle Ppt PowerPoint Presentation Designs Download
This is a six stages disaster cycle ppt powerpoint presentation designs download. This is a six stage process. The stages in this process are prevention, mitigation, preparedness, reconstruction, rehabilitation.
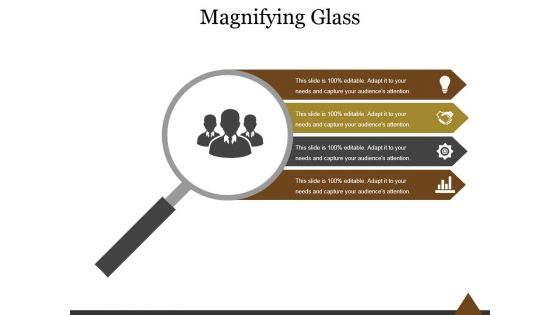
Magnifying Glass Ppt PowerPoint Presentation Files
This is a magnifying glass ppt powerpoint presentation files. This is a four stage process. The stages in this process are business, marketing, process, magnifying, glass.
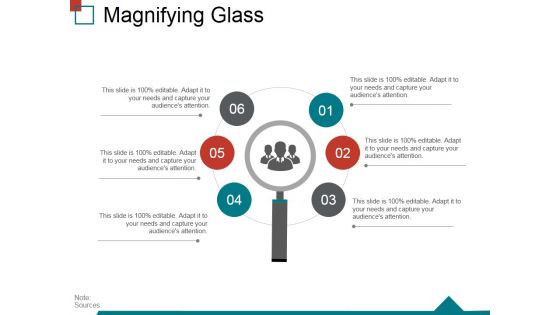
Magnifying Glass Ppt PowerPoint Presentation Inspiration Brochure
This is a magnifying glass ppt powerpoint presentation inspiration brochure. This is a six stage process. The stages in this process are magnifying glass, business, marketing, success.
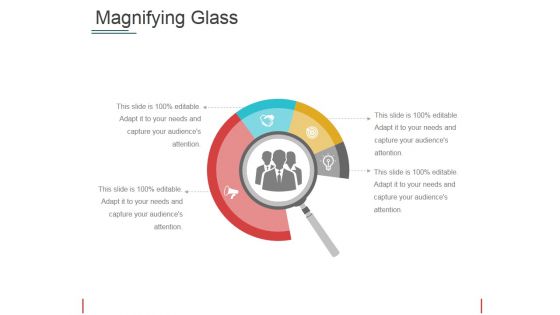
Magnifying Glass Ppt PowerPoint Presentation File Grid
This is a magnifying glass ppt powerpoint presentation file grid. This is a four stage process. The stages in this process are magnifying glass, icons, marketing, business, management.
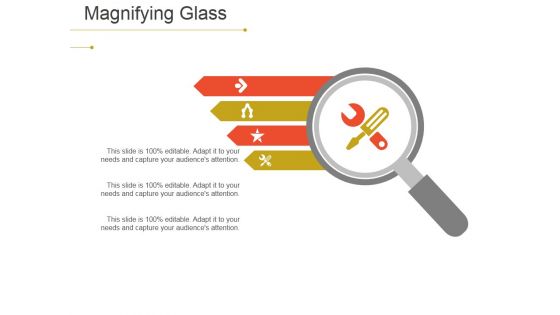
Magnifying Glass Ppt PowerPoint Presentation Infographic Template Inspiration
This is a magnifying glass ppt powerpoint presentation infographic template inspiration. This is a four stage process. The stages in this process are magnifying glass, business, technology, marketing, management.
Magnifying Glass Ppt PowerPoint Presentation Icon Good
This is a magnifying glass ppt powerpoint presentation icon good. This is a five stage process. The stages in this process are magnifying glass, process, icons, marketing, business.

Magnifying Glass Ppt PowerPoint Presentation Layouts Guide
This is a magnifying glass ppt powerpoint presentation layouts guide. This is a six stage process. The stages in this process are magnifying glass, process, business, marketing, technology.
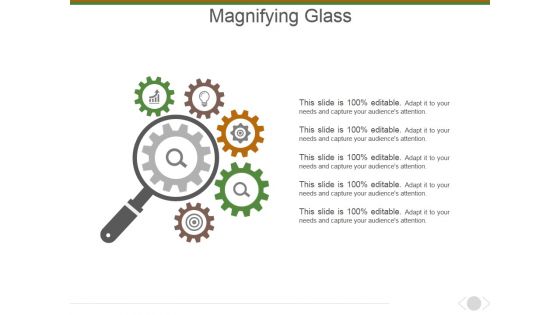
Magnifying Glass Ppt PowerPoint Presentation Infographic Template Example Topics
This is a magnifying glass ppt powerpoint presentation infographic template example topics. This is a five stage process. The stages in this process are magnifying glass, icons, business, marketing, management.
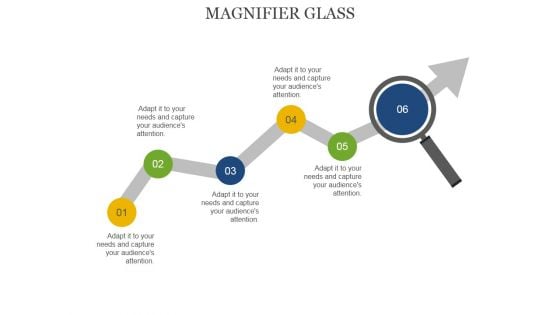
Magnifier Glass Ppt PowerPoint Presentation Summary Microsoft
This is a magnifier glass ppt powerpoint presentation summary microsoft. This is a five stage process. The stages in this process are magnifying glass, arrows, marketing, technology, business.
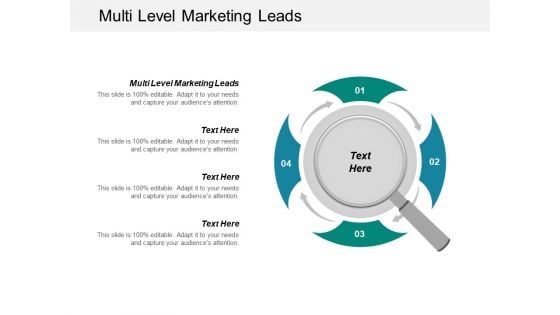
Multi Level Marketing Leads Ppt PowerPoint Presentation File Brochure Cpb
This is a multi level marketing leads ppt powerpoint presentation file brochure cpb. This is a four stage process. The stages in this process are multi level marketing leads.
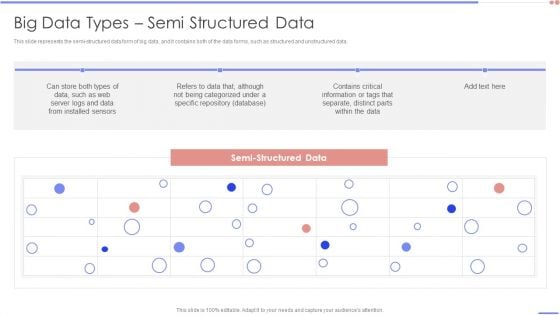
Data Analytics Management Big Data Types Semi Structured Data Formats PDF
This slide represents the semi-structured data form of big data, and it contains both of the data forms, such as structured and unstructured data.Deliver and pitch your topic in the best possible manner with this Data Analytics Management Big Data Types Semi Structured Data Formats PDF. Use them to share invaluable insights on Installed Sensors, Specific Repository, Information Or Tags and impress your audience. This template can be altered and modified as per your expectations. So, grab it now.
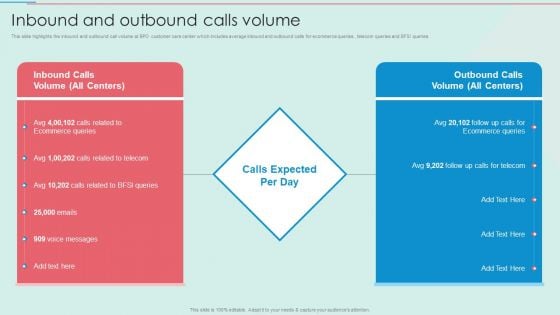
BPO Call Center Company Profile Inbound And Outbound Calls Volume Summary PDF
This slide highlights the inbound and outbound call volume at BPO customer care center which includes average inbound and outbound calls for ecommerce queries , telecom queries and BFSI queries.Deliver and pitch your topic in the best possible manner with this BPO Call Center Company Profile Inbound And Outbound Calls Volume Summary PDF. Use them to share invaluable insights on Ecommerce Queries, Voice Messages, Calls Related and impress your audience. This template can be altered and modified as per your expectations. So, grab it now.
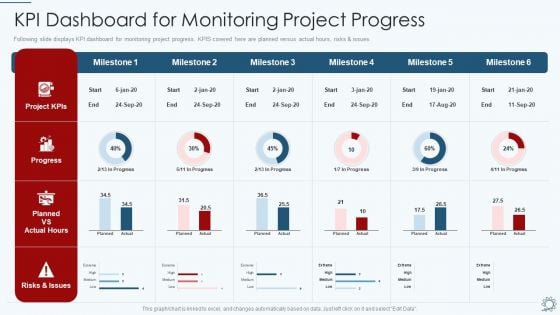
Development And Operations Pipeline IT KPI Dashboard For Monitoring Project Progress Ideas PDF
Following slide displays KPI dashboard for monitoring project progress. KPIS covered here are planned versus actual hours, risks and issues. Deliver and pitch your topic in the best possible manner with this development and operations pipeline it kpi dashboard for monitoring project progress ideas pdf. Use them to share invaluable insights on project kpis, progress, planned vs actual hours, risks and issues and impress your audience. This template can be altered and modified as per your expectations. So, grab it now.
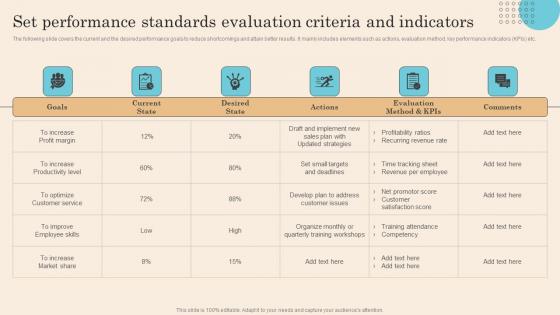
Set Performance Standards Evaluation Criteria Executing Successful Staff Performance Template Pdf
The following slide covers the current and the desired performance goals to reduce shortcomings and attain better results. It mainly includes elements such as actions, evaluation method, key performance indicators KPIs etc. Take your projects to the next level with our ultimate collection of Set Performance Standards Evaluation Criteria Executing Successful Staff Performance Template Pdf. Slidegeeks has designed a range of layouts that are perfect for representing task or activity duration, keeping track of all your deadlines at a glance. Tailor these designs to your exact needs and give them a truly corporate look with your own brand colors they will make your projects stand out from the rest. The following slide covers the current and the desired performance goals to reduce shortcomings and attain better results. It mainly includes elements such as actions, evaluation method, key performance indicators KPIs etc.
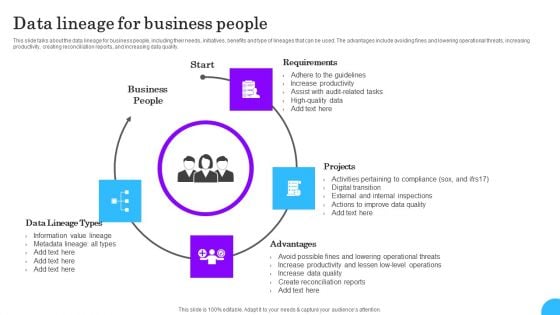
Comprehensive Analysis Of Different Data Lineage Classification Data Lineage For Business People Introduction PDF
This slide talks about the data lineage for business people, including their needs, initiatives, benefits and type of lineages that can be used. The advantages include avoiding fines and lowering operational threats, increasing productivity, creating reconciliation reports, and increasing data quality. If you are looking for a format to display your unique thoughts, then the professionally designed Comprehensive Analysis Of Different Data Lineage Classification Data Lineage For Business People Introduction PDF is the one for you. You can use it as a Google Slides template or a PowerPoint template. Incorporate impressive visuals, symbols, images, and other charts. Modify or reorganize the text boxes as you desire. Experiment with shade schemes and font pairings. Alter, share or cooperate with other people on your work. Download Comprehensive Analysis Of Different Data Lineage Classification Data Lineage For Business People Introduction PDF and find out how to give a successful presentation. Present a perfect display to your team and make your presentation unforgettable.
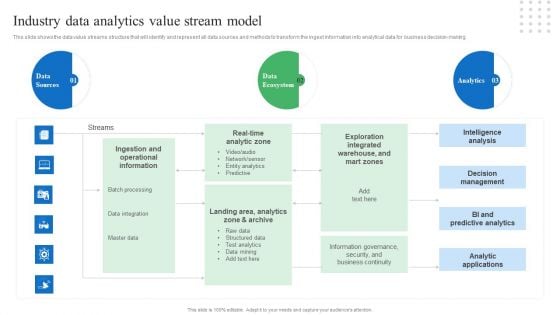
Toolkit For Data Science And Analytics Transition Industry Data Analytics Value Stream Model Brochure PDF
This slide shows the data value streams structure that will identify and represent all data sources and methods to transform the ingest information into analytical data for business decision-making. Whether you have daily or monthly meetings, a brilliant presentation is necessary. Toolkit For Data Science And Analytics Transition Industry Data Analytics Value Stream Model Brochure PDF can be your best option for delivering a presentation. Represent everything in detail using Toolkit For Data Science And Analytics Transition Industry Data Analytics Value Stream Model Brochure PDF and make yourself stand out in meetings. The template is versatile and follows a structure that will cater to your requirements. All the templates prepared by Slidegeeks are easy to download and edit. Our research experts have taken care of the corporate themes as well. So, give it a try and see the results.
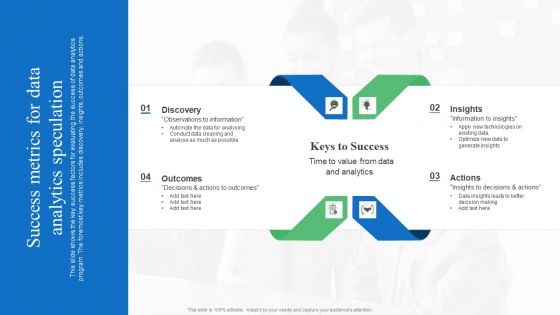
Toolkit For Data Science And Analytics Transition Success Metrics For Data Analytics Speculation Template PDF
Crafting an eye catching presentation has never been more straightforward. Let your presentation shine with this tasteful yet straightforward Toolkit For Data Science And Analytics Transition Success Metrics For Data Analytics Speculation Template PDF template. It offers a minimalistic and classy look that is great for making a statement. The colors have been employed intelligently to add a bit of playfulness while still remaining professional. Construct the ideal Toolkit For Data Science And Analytics Transition Success Metrics For Data Analytics Speculation Template PDF that effortlessly grabs the attention of your audience Begin now and be certain to wow your customers.
Magnifier For Research Analysis Vector Icon Ppt PowerPoint Presentation Styles Images
Presenting this set of slides with name magnifier for research analysis vector icon ppt powerpoint presentation styles images. This is a three stage process. The stages in this process are magnifier for research analysis vector icon. This is a completely editable PowerPoint presentation and is available for immediate download. Download now and impress your audience.
Strategic Plan Analysis Vector Icon Ppt PowerPoint Presentation Summary Elements PDF
Presenting this set of slides with name strategic plan analysis vector icon ppt powerpoint presentation summary elements pdf. This is a two stage process. The stages in this process are strategic plan analysis vector icon. This is a completely editable PowerPoint presentation and is available for immediate download. Download now and impress your audience.
Sales Analysis With Magnifying Glass Vector Icon Ppt PowerPoint Presentation File Inspiration PDF
Presenting this set of slides with name sales analysis with magnifying glass vector icon ppt powerpoint presentation file inspiration pdf. This is a three stage process. The stages in this process are sales analysis with magnifying glass vector icon. This is a completely editable PowerPoint presentation and is available for immediate download. Download now and impress your audience.
Financial Analysis Calculator With Dollar Symbol Vector Icon Ppt PowerPoint Presentation File Example Topics PDF
Presenting this set of slides with name financial analysis calculator with dollar symbol vector icon ppt powerpoint presentation file example topics pdf. This is a three stage process. The stages in this process are financial analysis calculator with dollar symbol vector icon. This is a completely editable PowerPoint presentation and is available for immediate download. Download now and impress your audience.
Consumer Research And Analysis Vector Icon Ppt PowerPoint Presentation File Graphics Download PDF
Presenting this set of slides with name consumer research and analysis vector icon ppt powerpoint presentation file graphics download pdf. This is a three stage process. The stages in this process are consumer research and analysis vector icon. This is a completely editable PowerPoint presentation and is available for immediate download. Download now and impress your audience.
Consumer Statistics Analysis Vector Icon Ppt PowerPoint Presentation File Guidelines PDF
Presenting this set of slides with name consumer statistics analysis vector icon ppt powerpoint presentation file guidelines pdf. This is a three stage process. The stages in this process are consumer statistics analysis vector icon. This is a completely editable PowerPoint presentation and is available for immediate download. Download now and impress your audience.
Magnifying Glass Bar Graph Showing Business Statistical Analysis Ppt PowerPoint Presentation File Sample PDF
Presenting this set of slides with name magnifying glass bar graph showing business statistical analysis ppt powerpoint presentation file sample pdf. This is a three stage process. The stages in this process are magnifying glass bar graph showing business statistical analysis. This is a completely editable PowerPoint presentation and is available for immediate download. Download now and impress your audience.
Cost Control And Analysis Ppt PowerPoint Presentation Summary Example Topics PDF
Presenting this set of slides with name cost control and analysis ppt powerpoint presentation summary example topics pdf. This is a four stage process. The stages in this process are cost control and analysis. This is a completely editable PowerPoint presentation and is available for immediate download. Download now and impress your audience.
Documenting Operations For Information Technology Simplification Analysis Icon Ppt PowerPoint Presentation File Influencers PDF
Presenting documenting operations for information technology simplification analysis icon ppt powerpoint presentation file influencers pdf to dispense important information. This template comprises two stages. It also presents valuable insights into the topics including documenting operations for information technology simplification analysis icon. This is a completely customizable PowerPoint theme that can be put to use immediately. So, download it and address the topic impactfully.
Information Analysis For Secondary Market Research Vector Icon Ppt PowerPoint Presentation Gallery Brochure PDF
Presenting information analysis for secondary market research vector icon ppt powerpoint presentation gallery brochure pdf to dispense important information. This template comprises three stages. It also presents valuable insights into the topics including information analysis for secondary market research vector icon. This is a completely customizable PowerPoint theme that can be put to use immediately. So, download it and address the topic impactfully.


 Continue with Email

 Home
Home


