Snapshot
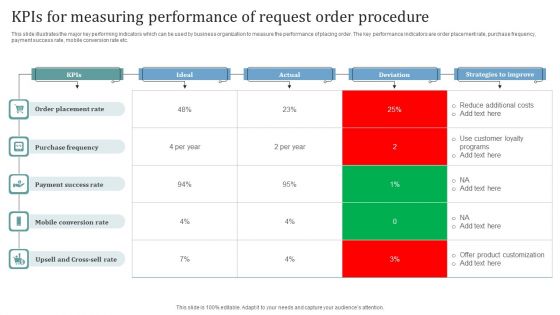
Kpis For Measuring Performance Of Request Order Procedure Slides PDF
This slide illustrates the major key performing indicators which can be used by business organization to measure the performance of placing order. The key performance indicators are order placement rate, purchase frequency, payment success rate, mobile conversion rate etc. Pitch your topic with ease and precision using this Kpis For Measuring Performance Of Request Order Procedure Slides PDF. This layout presents information on Kpis, Ideal, Actual. It is also available for immediate download and adjustment. So, changes can be made in the color, design, graphics or any other component to create a unique layout.
Business Dashboard Showing Total Revenue Ppt PowerPoint Presentation Visual Aids Icon PDF
Presenting this set of slides with name business dashboard showing total revenue ppt powerpoint presentation visual aids icon pdf. The topics discussed in these slides are total revenue, 22 product types share in total revenue, 6 product lines product types revenue share within product line, profit and quatity running total, product line color key. This is a completely editable PowerPoint presentation and is available for immediate download. Download now and impress your audience.
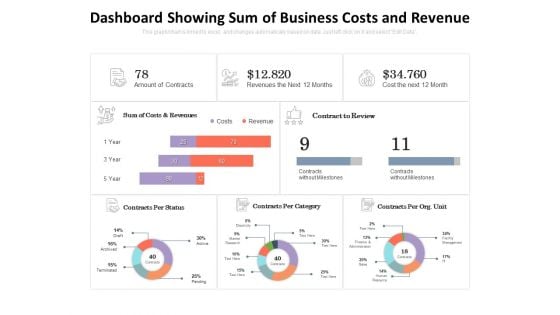
Dashboard Showing Sum Of Business Costs And Revenue Ppt PowerPoint Presentation Inspiration Gallery PDF
Presenting this set of slides with name dashboard showing sum of business costs and revenue ppt powerpoint presentation inspiration gallery pdf. The topics discussed in these slides are sum of costs and revenues, contract to review, contracts per org unit, contracts per category, contracts per status. This is a completely editable PowerPoint presentation and is available for immediate download. Download now and impress your audience.
business intelligence and analytics dashboard ppt powerpoint presentation icon example topics pdf
Presenting this set of slides with name business intelligence and analytics dashboard ppt powerpoint presentation icon example topics pdf. The topics discussed in these slides are geographic distribution of total revenue, top 5 product by total revenue, measuring running by total revenue, how close are we to tour planned total revenue. This is a completely editable PowerPoint presentation and is available for immediate download. Download now and impress your audience.
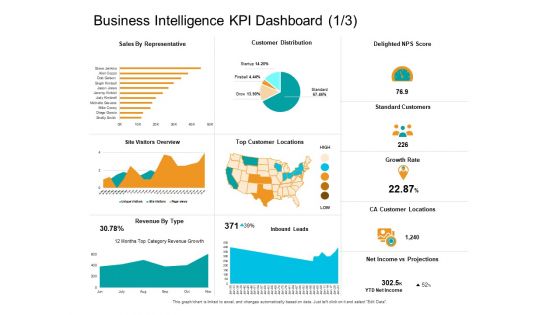
Facts Assessment Business Intelligence KPI Dashboard Expenses Ppt PowerPoint Presentation Layouts Background Images PDF
Presenting this set of slides with name facts assessment business intelligence kpi dashboard expenses ppt powerpoint presentation layouts background images pdf. The topics discussed in these slides are sales representative, delighted nps score, standard customers, growth rate, ca customer locations, net income vs projections, revenue type, top customer locations, customer distribution. This is a completely editable PowerPoint presentation and is available for immediate download. Download now and impress your audience.
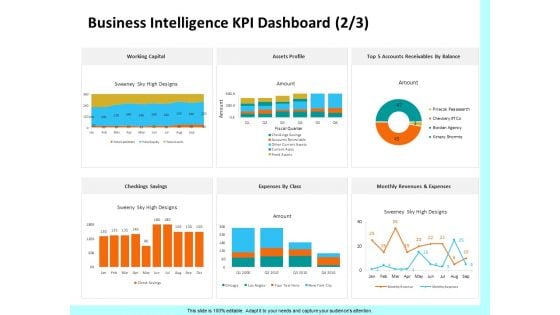
Firm Productivity Administration Business Intelligence KPI Dashboard Assets Ppt PowerPoint Presentation Slides Background Designs PDF
Presenting this set of slides with name firm productivity administration business intelligence kpi dashboard assets ppt powerpoint presentation slides background designs pdf. The topics discussed in these slides are expenses class, top 5 accounts receivables balance, assets profile, working capital, checking savings, monthly revenues and expenses. This is a completely editable PowerPoint presentation and is available for immediate download. Download now and impress your audience.
Firm Productivity Administration Business Intelligence KPI Dashboard Score Ppt PowerPoint Presentation Infographic Template Display PDF
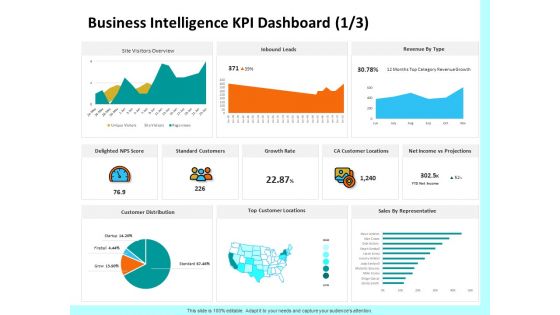
Presenting this set of slides with name firm productivity administration business intelligence kpi dashboard score ppt powerpoint presentation infographic template display pdf. The topics discussed in these slides are sales representative, delighted nps score, standard customers, growth rate, ca customer locations, net income vs projections, revenue type, top customer locations, customer distribution. This is a completely editable PowerPoint presentation and is available for immediate download. Download now and impress your audience.

Enterprise Problem Solving And Intellect Business Intelligence KPI Dashboard Growth Ppt PowerPoint Presentation Model Images PDF
Presenting this set of slides with name enterprise problem solving and intellect business intelligence kpi dashboard growth ppt powerpoint presentation model images pdf. The topics discussed in these slides are sales representative, delighted nps score, standard customers, growth rate, ca customer locations, net income vs projections, revenue type, top customer locations, customer distribution. This is a completely editable PowerPoint presentation and is available for immediate download. Download now and impress your audience.

Enterprise Problem Solving And Intellect Business Intelligence KPI Dashboard Profile Ppt PowerPoint Presentation Summary Structure PDF
Presenting this set of slides with name enterprise problem solving and intellect business intelligence kpi dashboard profile ppt powerpoint presentation summary structure pdf. The topics discussed in these slides are expenses class, top 5 accounts receivables balance, assets profile, working capital, checking savings, monthly revenues and expenses. This is a completely editable PowerPoint presentation and is available for immediate download. Download now and impress your audience.
Business Opportunity Assessment Dashboard With Various Ppt PowerPoint Presentation Professional Graphics Download PDF
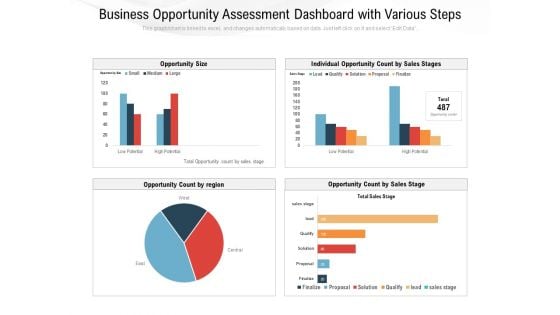
Pitch your topic with ease and precision using this business opportunity assessment dashboard with various ppt powerpoint presentation professional graphics download pdf. This layout presents information on opportunity size, individual opportunity count by sales stages, opportunity count by region, opportunity count by sales stage. It is also available for immediate download and adjustment. So, changes can be made in the color, design, graphics or any other component to create a unique layout.
Administrative Regulation Business Management Dashboards Sales Ppt PowerPoint Presentation Inspiration Layouts PDF
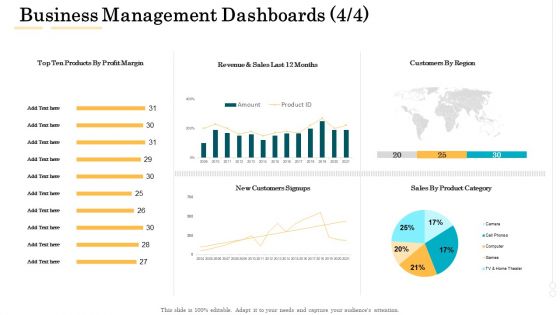
Deliver an awe-inspiring pitch with this creative administrative regulation business management dashboards sales ppt powerpoint presentation inspiration layouts pdf bundle. Topics like top ten products by profit margin, revenue and sales last 12 months, customers by regione, customers signups, sales by product category can be discussed with this completely editable template. It is available for immediate download depending on the needs and requirements of the user.
Unified Business To Consumer Marketing Strategy Online Multichannel Marketing Campaign Dashboard Template PDF
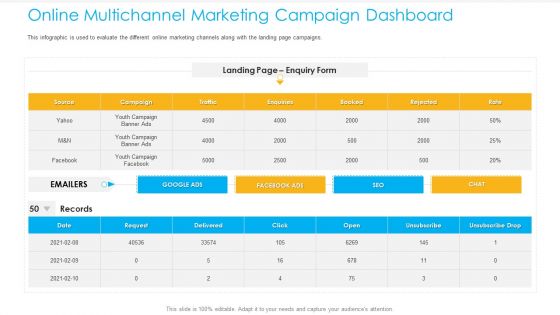
This infographic is used to evaluate the different online marketing channels along with the landing page campaigns. Deliver an awe inspiring pitch with this creative unified business to consumer marketing strategy online multichannel marketing campaign dashboard template pdf bundle. Topics like youth campaign banner ads, campaign, enquiries, unsubscribe, rejected can be discussed with this completely editable template. It is available for immediate download depending on the needs and requirements of the user.
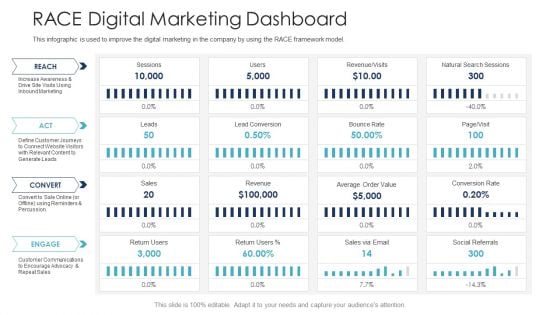
B2C Marketing Initiatives Strategies For Business RACE Digital Marketing Dashboard Ppt Infographic Template Objects PDF
This infographic is used to improve the digital marketing in the company by using the RACE framework model. Deliver an awe inspiring pitch with this creative B2C marketing initiatives strategies for business RACE digital marketing dashboard ppt infographic template objects pdf bundle. Topics like revenue, customer communications, inbound marketing, social referrals, conversion rate can be discussed with this completely editable template. It is available for immediate download depending on the needs and requirements of the user.
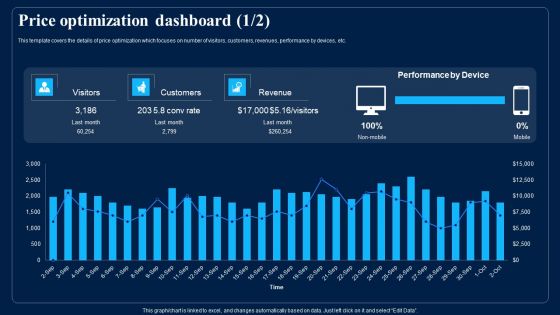
Identifying Optimum Pricing Methods For Business Price Optimization Dashboard Professional PDF
This template covers the details of price optimization which focuses on number of visitors, customers, revenues, performance by devices, etc. Deliver an awe inspiring pitch with this creative Identifying Optimum Pricing Methods For Business Price Optimization Dashboard Professional PDF bundle. Topics like Revenue, Customers, Performance By Device can be discussed with this completely editable template. It is available for immediate download depending on the needs and requirements of the user.
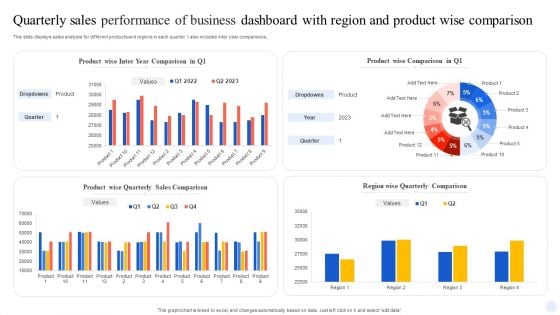
Quarterly Sales Performance Of Business Dashboard With Region And Product Wise Comparison Guidelines PDF
This slide displays sales analysis for different products and regions in each quarter. t also includes inter year comparisons. Pitch your topic with ease and precision using this Quarterly Sales Performance Of Business Dashboard With Region And Product Wise Comparison Guidelines PDF. This layout presents information on Product Wise Quarterly Sales, Comparison. It is also available for immediate download and adjustment. So, changes can be made in the color, design, graphics or any other component to create a unique layout.
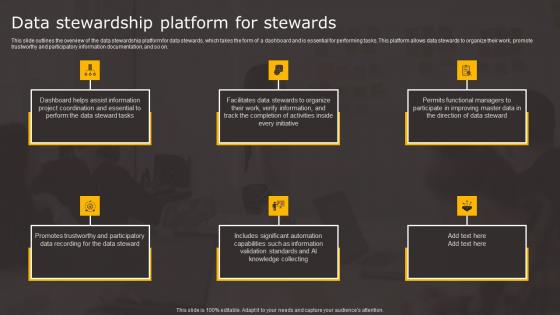
Data Stewardship Platform For Stewards Data Stewardship In Business Processes Professional Pdf
This slide outlines the overview of the data stewardship platform for data stewards, which takes the form of a dashboard and is essential for performing tasks. This platform allows data stewards to organize their work, promote trustworthy and participatory information documentation, and so on. Slidegeeks has constructed Data Stewardship Platform For Stewards Data Stewardship In Business Processes Professional Pdf after conducting extensive research and examination. These presentation templates are constantly being generated and modified based on user preferences and critiques from editors. Here, you will find the most attractive templates for a range of purposes while taking into account ratings and remarks from users regarding the content. This is an excellent jumping off point to explore our content and will give new users an insight into our top notch PowerPoint Templates. This slide outlines the overview of the data stewardship platform for data stewards, which takes the form of a dashboard and is essential for performing tasks. This platform allows data stewards to organize their work, promote trustworthy and participatory information documentation, and so on.
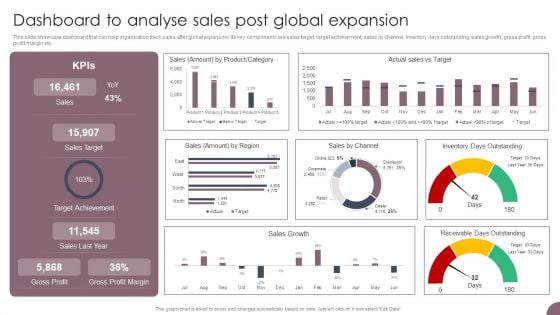
International Business Extension Dashboard To Analyse Sales Post Global Expansion Guidelines PDF
This slide showcase dashboard that can help organization track sales after global expansion. Its key components are sales target, target achievement, sales by channel, inventory days outstanding, sales growth, gross profit, gross profit margin etc. Are you in need of a template that can accommodate all of your creative concepts This one is crafted professionally and can be altered to fit any style. Use it with Google Slides or PowerPoint. Include striking photographs, symbols, depictions, and other visuals. Fill, move around, or remove text boxes as desired. Test out color palettes and font mixtures. Edit and save your work, or work with colleagues. Download International Business Extension Dashboard To Analyse Sales Post Global Expansion Guidelines PDF and observe how to make your presentation outstanding. Give an impeccable presentation to your group and make your presentation unforgettable.
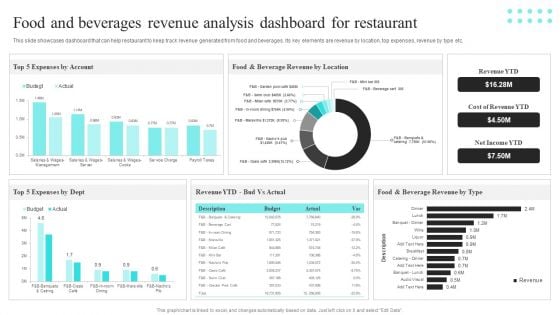
Strategic Promotional Guide For Restaurant Business Advertising Food And Beverages Revenue Analysis Dashboard Template PDF
This slide showcases dashboard that can help restaurant to keep track revenue generated from food and beverages. Its key elements are revenue by location, top expenses, revenue by type etc. This Strategic Promotional Guide For Restaurant Business Advertising Food And Beverages Revenue Analysis Dashboard Template PDF from Slidegeeks makes it easy to present information on your topic with precision. It provides customization options, so you can make changes to the colors, design, graphics, or any other component to create a unique layout. It is also available for immediate download, so you can begin using it right away. Slidegeeks has done good research to ensure that you have everything you need to make your presentation stand out. Make a name out there for a brilliant performance.
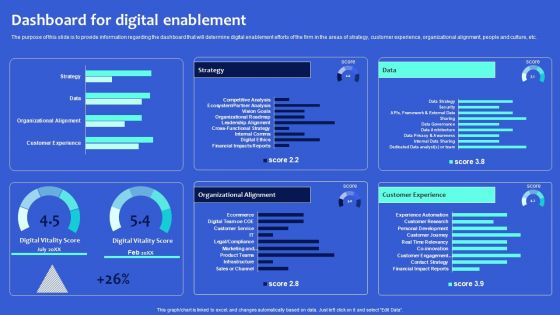
Digital Transformation Checklist To Accelerate Innovation In Business Dashboard For Digital Enablement Formats PDF
The purpose of this slide is to provide information regarding the dashboard that will determine digital enablement efforts of the firm in the areas of strategy, customer experience, organizational alignment, people and culture, etc. Coming up with a presentation necessitates that the majority of the effort goes into the content and the message you intend to convey. The visuals of a PowerPoint presentation can only be effective if it supplements and supports the story that is being told. Keeping this in mind our experts created Digital Transformation Checklist To Accelerate Innovation In Business Dashboard For Digital Enablement Formats PDF to reduce the time that goes into designing the presentation. This way, you can concentrate on the message while our designers take care of providing you with the right template for the situation.
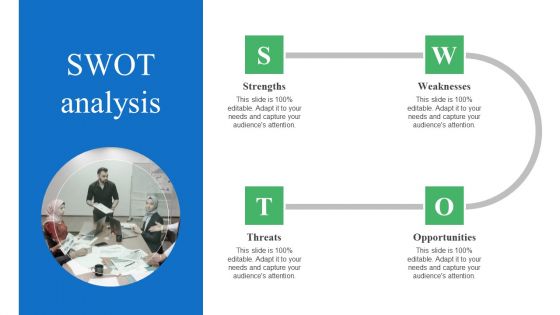
Toolkit For Data Science And Analytics Transition SWOT Analysis Download PDF
The Toolkit For Data Science And Analytics Transition SWOT Analysis Download PDF is a compilation of the most recent design trends as a series of slides. It is suitable for any subject or industry presentation, containing attractive visuals and photo spots for businesses to clearly express their messages. This template contains a variety of slides for the user to input data, such as structures to contrast two elements, bullet points, and slides for written information. Slidegeeks is prepared to create an impression.
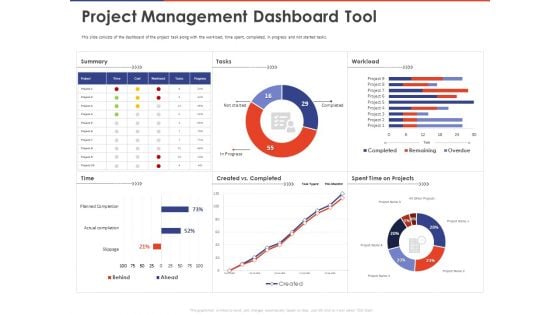
Key Prioritization Techniques For Project Team Management Project Management Dashboard Tool Ppt PowerPoint Presentation Professional Pictures PDF
Presenting this set of slides with name key prioritization techniques for project team management project management dashboard tool ppt powerpoint presentation professional pictures pdf. The topics discussed in these slides are project management dashboard tool. This is a completely editable PowerPoint presentation and is available for immediate download. Download now and impress your audience.

Case Competition Reduction In Existing Customer Of Telecommunication Company Telecom Company User Base Dashboard Ppt Professional Picture PDF
Deliver an awe inspiring pitch with this creative case competition reduction in existing customer of telecommunication company telecom company user base dashboard ppt professional picture pdf bundle. Topics like telecom company user base dashboard can be discussed with this completely editable template. It is available for immediate download depending on the needs and requirements of the user.
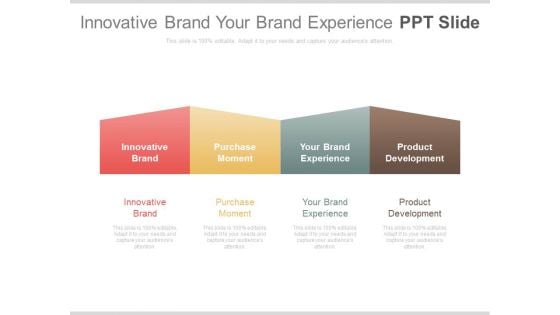
Innovative Brand Your Brand Experience Ppt Slide
This is a innovative brand your brand experience ppt slide. This is a four stage process. The stages in this process are marketing, business, success.
Setting Campaign Metrics Ppt Slides
This is a setting campaign metrics ppt slides. This is a five stage process. The stages in this process are business, marketing, success.
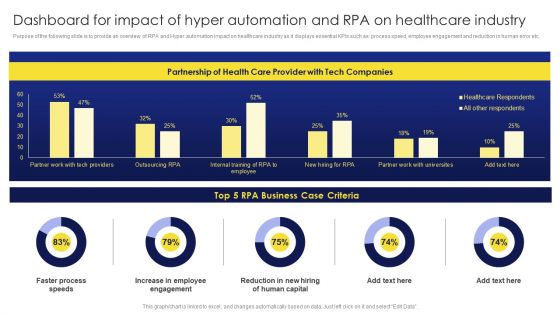
Dashboard For Impact Of Hyper Automation And RPA On Healthcare Industry Diagrams PDF
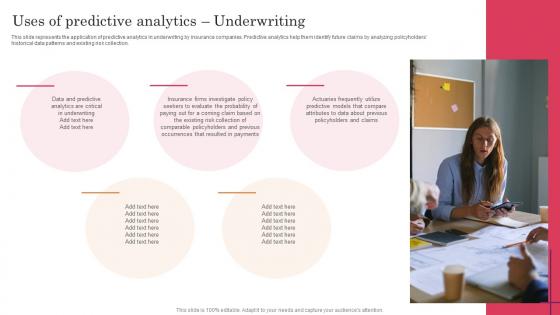
Uses Of Predictive Analytics Underwriting Predictive Analytics For Improved Slides Pdf
This slide represents the application of predictive analytics in underwriting by insurance companies. Predictive analytics help them identify future claims by analyzing policyholders historical data patterns and existing risk collection. Find highly impressive Uses Of Predictive Analytics Underwriting Predictive Analytics For Improved Slides Pdf on Slidegeeks to deliver a meaningful presentation. You can save an ample amount of time using these presentation templates. No need to worry to prepare everything from scratch because Slidegeeks experts have already done a huge research and work for you. You need to download Uses Of Predictive Analytics Underwriting Predictive Analytics For Improved Slides Pdf for your upcoming presentation. All the presentation templates are 100 percent editable and you can change the color and personalize the content accordingly. Download now. This slide represents the application of predictive analytics in underwriting by insurance companies. Predictive analytics help them identify future claims by analyzing policyholders historical data patterns and existing risk collection.
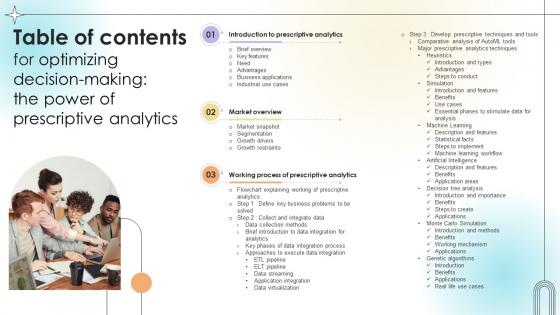
Table Of Contents For Optimizing Decision Making The Power Of Prescriptive Analytics Data Analytics SS V
Explore a selection of the finest Table Of Contents For Optimizing Decision Making The Power Of Prescriptive Analytics Data Analytics SS V here. With a plethora of professionally designed and pre-made slide templates, you can quickly and easily find the right one for your upcoming presentation. You can use our Table Of Contents For Optimizing Decision Making The Power Of Prescriptive Analytics Data Analytics SS V to effectively convey your message to a wider audience. Slidegeeks has done a lot of research before preparing these presentation templates. The content can be personalized and the slides are highly editable. Grab templates today from Slidegeeks. Our Table Of Contents For Optimizing Decision Making The Power Of Prescriptive Analytics Data Analytics SS V are topically designed to provide an attractive backdrop to any subject. Use them to look like a presentation pro.
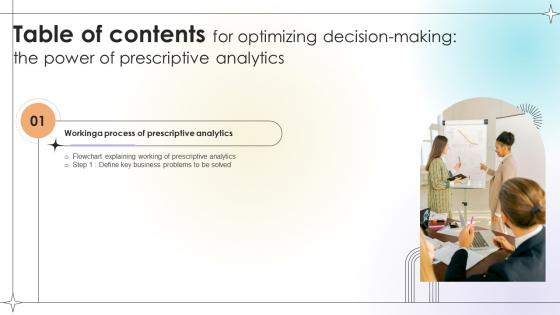
Table Of Contents Optimizing Decision Making The Power Of Prescriptive Analytics Data Analytics SS V
The best PPT templates are a great way to save time, energy, and resources. Slidegeeks have 100 percent editable powerpoint slides making them incredibly versatile. With these quality presentation templates, you can create a captivating and memorable presentation by combining visually appealing slides and effectively communicating your message. Download Table Of Contents Optimizing Decision Making The Power Of Prescriptive Analytics Data Analytics SS V from Slidegeeks and deliver a wonderful presentation. Our Table Of Contents Optimizing Decision Making The Power Of Prescriptive Analytics Data Analytics SS V are topically designed to provide an attractive backdrop to any subject. Use them to look like a presentation pro.
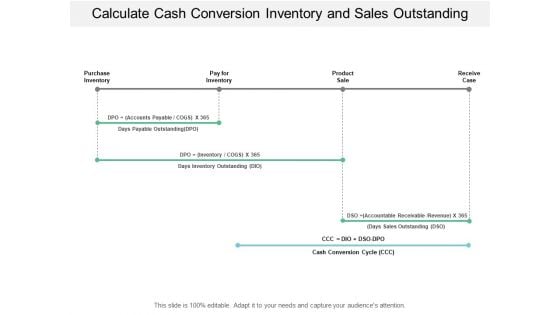
Calculate Cash Conversion Inventory And Sales Outstanding Ppt PowerPoint Presentation Portfolio Styles
Presenting this set of slides with name calculate cash conversion inventory and sales outstanding ppt powerpoint presentation portfolio styles. The topics discussed in these slides are cash flow, fund flow, trading cycle. This is a completely editable PowerPoint presentation and is available for immediate download. Download now and impress your audience.
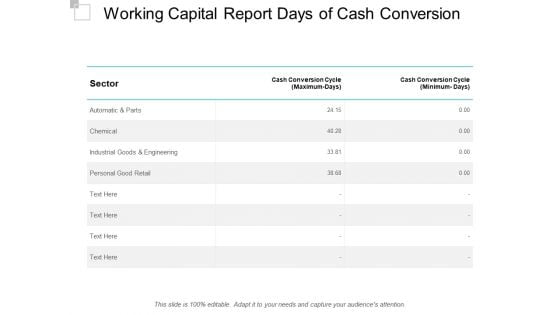
Working Capital Report Days Of Cash Conversion Ppt PowerPoint Presentation Ideas Graphics
Presenting this set of slides with name working capital report days of cash conversion ppt powerpoint presentation ideas graphics. The topics discussed in these slides are cash flow, fund flow, trading cycle. This is a completely editable PowerPoint presentation and is available for immediate download. Download now and impress your audience.
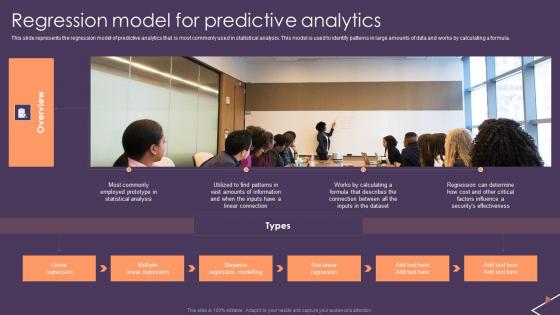
Predictive Analytics For Empowering Regression Model For Predictive Analytics Background Pdf
This slide represents the regression model of predictive analytics that is most commonly used in statistical analysis. This model is used to identify patterns in large amounts of data and works by calculating a formula. Take your projects to the next level with our ultimate collection of Predictive Analytics For Empowering Regression Model For Predictive Analytics Background Pdf Slidegeeks has designed a range of layouts that are perfect for representing task or activity duration, keeping track of all your deadlines at a glance. Tailor these designs to your exact needs and give them a truly corporate look with your own brand colors they well make your projects stand out from the rest. This slide represents the regression model of predictive analytics that is most commonly used in statistical analysis. This model is used to identify patterns in large amounts of data and works by calculating a formula.
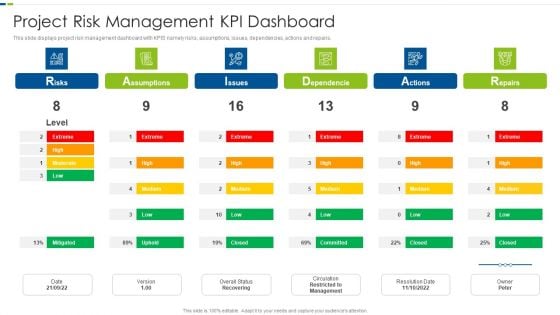
Utilizing Agile Methodology In Data Transformation Project IT Project Risk Management KPI Infographics PDF
This slide displays project risk management dashboard with KPIS namely risks, assumptions, issues, dependencies, actions and repairs. Deliver and pitch your topic in the best possible manner with this utilizing agile methodology in data transformation project it project risk management kpi infographics pdf. Use them to share invaluable insights on project risk management kpi dashboard and impress your audience. This template can be altered and modified as per your expectations. So, grab it now.
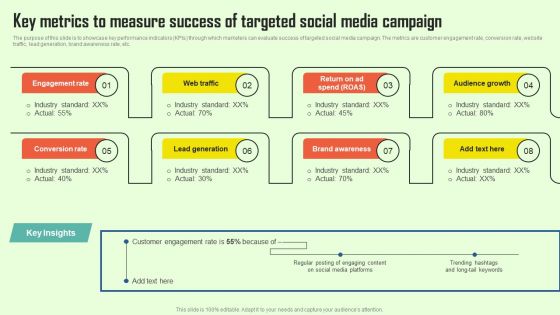
Increasing Consumer Engagement With Database Key Metrics To Measure Success Of Targeted Guidelines PDF
The purpose of this slide is to showcase key performance indicators KPIs through which marketers can evaluate success of targeted social media campaign. The metrics are customer engagement rate, conversion rate, website traffic, lead generation, brand awareness rate, etc. There are so many reasons you need a Increasing Consumer Engagement With Database Key Metrics To Measure Success Of Targeted Guidelines PDF. The first reason is you cannot spend time making everything from scratch, Thus, Slidegeeks has made presentation templates for you too. You can easily download these templates from our website easily.
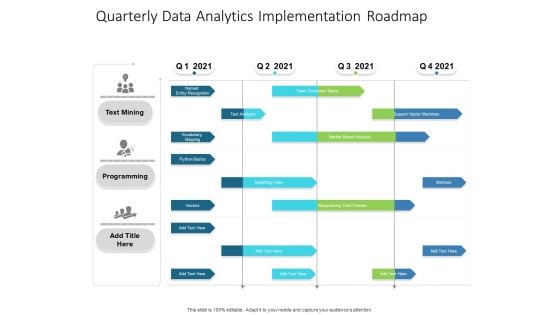
Quarterly Data Analytics Implementation Roadmap Pictures
Presenting our innovatively-structured quarterly data analytics implementation roadmap pictures Template. Showcase your roadmap process in different formats like PDF, PNG, and JPG by clicking the download button below. This PPT design is available in both Standard Screen and Widescreen aspect ratios. It can also be easily personalized and presented with modified font size, font type, color, and shapes to measure your progress in a clear way.
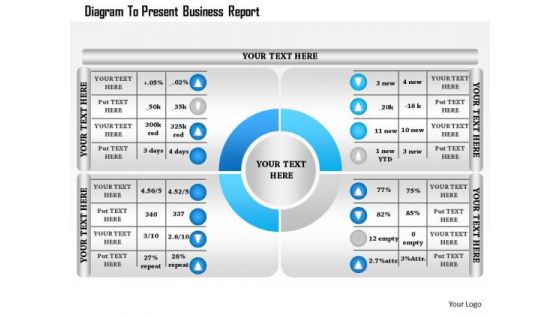
Business Diagram To Present Business Report Presentation Template
Four staged percentage personalized chart has been used to craft this power point template. This PPT contains the concept of data analysis and financial result analysis. This PPT can be used for your data and finance related topics in any business and marketing presentation.
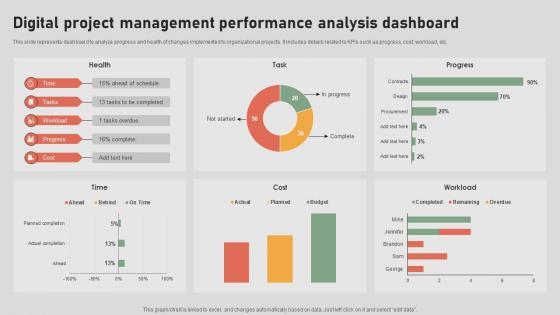
The Digital Project Managers Digital Project Management Performance Analysis Dashboard
This slide represents dashboard to analyze progress and health of changes implemented to organizational projects. It includes details related to KPIs such as progress, cost, workload, etc. Are you in need of a template that can accommodate all of your creative concepts This one is crafted professionally and can be altered to fit any style. Use it with Google Slides or PowerPoint. Include striking photographs, symbols, depictions, and other visuals. Fill, move around, or remove text boxes as desired. Test out color palettes and font mixtures. Edit and save your work, or work with colleagues. Download The Digital Project Managers Digital Project Management Performance Analysis Dashboard and observe how to make your presentation outstanding. Give an impeccable presentation to your group and make your presentation unforgettable. This slide represents dashboard to analyze progress and health of changes implemented to organizational projects. It includes details related to KPIs such as progress, cost, workload, etc.

The Digital Project Managers Project Change Management Kpi Dashboard
This slide represents KPI dashboard to effectively track and monitor effectiveness of changes implemented in organizational projects. It includes details related to KPIs such as changes investigated, submitted, approved, declined, etc. This The Digital Project Managers Project Change Management Kpi Dashboard from Slidegeeks makes it easy to present information on your topic with precision. It provides customization options, so you can make changes to the colors, design, graphics, or any other component to create a unique layout. It is also available for immediate download, so you can begin using it right away. Slidegeeks has done good research to ensure that you have everything you need to make your presentation stand out. Make a name out there for a brilliant performance. This slide represents KPI dashboard to effectively track and monitor effectiveness of changes implemented in organizational projects. It includes details related to KPIs such as changes investigated, submitted, approved, declined, etc.
Project Development Activity Monitoring Sheet Icons PDF
This slide illustrates project management monitoring chart for all activities. It includes activities, responsible, start date, end date, days, status, etc. Showcasing this set of slides titled Project Development Activity Monitoring Sheet Icons PDF. The topics addressed in these templates are Project Development, Activity Monitoring Sheet. All the content presented in this PPT design is completely editable. Download it and make adjustments in color, background, font etc. as per your unique business setting.
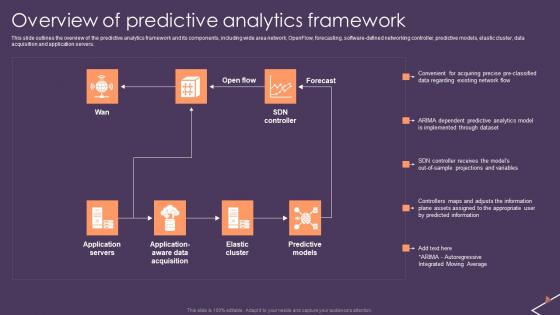
Predictive Analytics For Empowering Overview Of Predictive Analytics Framework Mockup Pdf
This slide outlines the overview of the predictive analytics framework and its components, including wide area network, OpenFlow, forecasting, software-defined networking controller, predictive models, elastic cluster, data acquisition and application servers. Find highly impressive Predictive Analytics For Empowering Overview Of Predictive Analytics Framework Mockup Pdf on Slidegeeks to deliver a meaningful presentation. You can save an ample amount of time using these presentation templates. No need to worry to prepare everything from scratch because Slidegeeks experts have already done a huge research and work for you. You need to download Predictive Analytics For Empowering Overview Of Predictive Analytics Framework Mockup Pdf for your upcoming presentation. All the presentation templates are 100 percent editable and you can change the color and personalize the content accordingly. Download now. This slide outlines the overview of the predictive analytics framework and its components, including wide area network, OpenFlow, forecasting, software-defined networking controller, predictive models, elastic cluster, data acquisition and application servers.

G206 Table Of Contents For Predictive Analytics For Empowering Data Driven Decision Demonstration Pdf
Explore a selection of the finest G206 Table Of Contents For Predictive Analytics For Empowering Data Driven Decision Demonstration Pdf here. With a plethora of professionally designed and pre-made slide templates, you can quickly and easily find the right one for your upcoming presentation. You can use our G206 Table Of Contents For Predictive Analytics For Empowering Data Driven Decision Demonstration Pdf to effectively convey your message to a wider audience. Slidegeeks has done a lot of research before preparing these presentation templates. The content can be personalized and the slides are highly editable. Grab templates today from Slidegeeks. Our G206 Table Of Contents For Predictive Analytics For Empowering Data Driven Decision Demonstration Pdf are topically designed to provide an attractive backdrop to any subject. Use them to look like a presentation pro.
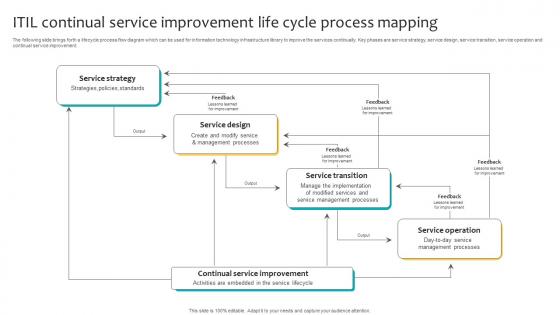
ITIL Continual Service Improvement Life Cycle Process Mapping Summary Pdf
The following slide brings forth a lifecycle process flow diagram which can be used for information technology infrastructure library to improve the services continually. Key phases are service strategy, service design, service transition, service operation and continual service improvement. Pitch your topic with ease and precision using this ITIL Continual Service Improvement Life Cycle Process Mapping Summary Pdf. This layout presents information on Service Design, Service Transition, Service Operation. It is also available for immediate download and adjustment. So, changes can be made in the color, design, graphics or any other component to create a unique layout. The following slide brings forth a lifecycle process flow diagram which can be used for information technology infrastructure library to improve the services continually. Key phases are service strategy, service design, service transition, service operation and continual service improvement.
Dashboard For Tracking And Measuring Business Sales And Revenue Ppt PowerPoint Presentation Slides Introduction PDF
Showcasing this set of slides titled dashboard for tracking and measuring business sales and revenue ppt powerpoint presentation slides introduction pdf. The topics addressed in these templates are revenue by pipeline jun 2020, new deals by month this year 2020, forecast june 2020, revenue goal attainment by owner jun 2020, revenue goal attainment jun 2020, pipeline coverage jul 2020. All the content presented in this PPT design is completely editable. Download it and make adjustments in color, background, font etc. as per your unique business setting.
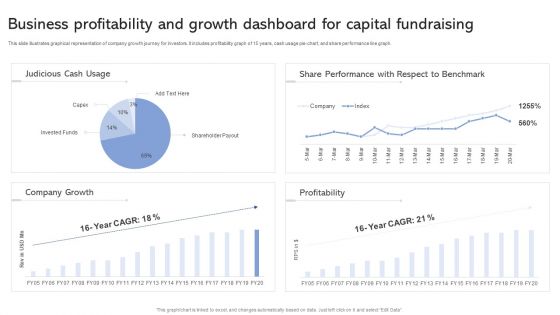
Business Profitability And Growth Dashboard For Capital Fundraising Ppt Slides Guide PDF
This slide illustrates graphical representation of company growth journey for investors. It includes profitability graph of 15 years, cash usage pie-chart, and share performance line graph. Showcasing this set of slides titled Business Profitability And Growth Dashboard For Capital Fundraising Ppt Slides Guide PDF. The topics addressed in these templates are Judicious Cash Usage, Share Performance, Respect To Benchmark. All the content presented in this PPT design is completely editable. Download it and make adjustments in color, background, font etc. as per your unique business setting.
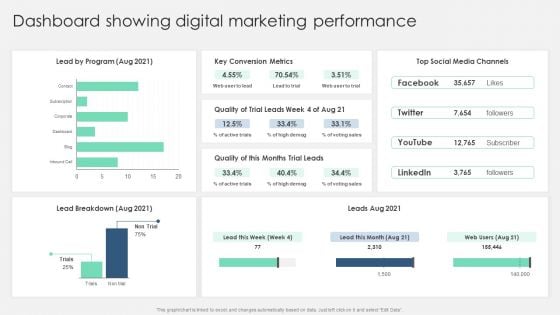
Product Marketing Management To Enforce Business Performance Dashboard Showing Digital Professional PDF
Do you know about Slidesgeeks Product Marketing Management To Enforce Business Performance Dashboard Showing Digital Professional PDF These are perfect for delivering any kind od presentation. Using it, create PowerPoint presentations that communicate your ideas and engage audiences. Save time and effort by using our pre designed presentation templates that are perfect for a wide range of topic. Our vast selection of designs covers a range of styles, from creative to business, and are all highly customizable and easy to edit. Download as a PowerPoint template or use them as Google Slides themes.
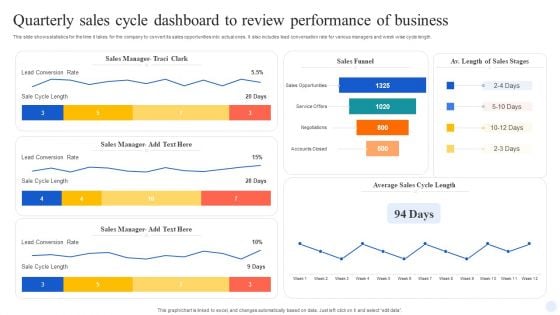
Quarterly Sales Cycle Dashboard To Review Performance Of Business Demonstration PDF
This slide shows statistics for the time it takes for the company to convert its sales opportunities into actual ones. It also includes lead conversation rate for various managers and week wise cycle length. Showcasing this set of slides titled Quarterly Sales Cycle Dashboard To Review Performance Of Business Demonstration PDF. The topics addressed in these templates are Sales Manager, Sales Funnel, Lead Conversion Rate. All the content presented in this PPT design is completely editable. Download it and make adjustments in color, background, font etc. as per your unique business setting.
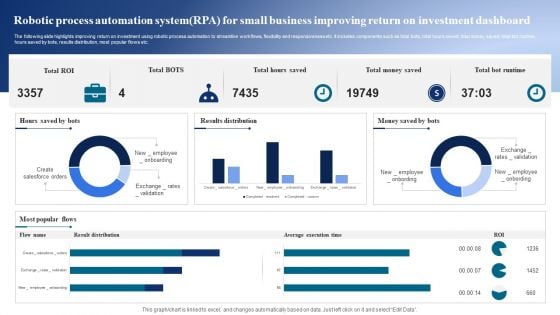
Robotic Process Automation Systemrpa For Small Business Improving Return On Investment Dashboard Ideas PDF
The following slide highlights improving return on investment using robotic process automation to streamline workflows, flexibility and responsiveness etc. It includes components such as total bots, total hours saved, total money saved, total bot runtime, hours saved by bots, results distribution, most popular flows etc. Showcasing this set of slides titled Robotic Process Automation Systemrpa For Small Business Improving Return On Investment Dashboard Ideas PDF. The topics addressed in these templates are Results Distribution, Popular Flows, Runtime. All the content presented in this PPT design is completely editable. Download it and make adjustments in color, background, font etc. as per your unique business setting.
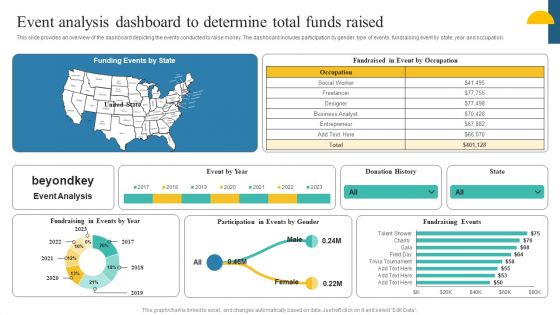
Charity Fundraising Marketing Plan Event Analysis Dashboard To Determine Total Guidelines PDF
This slide provides an overview of the dashboard depicting the events conducted to raise money. The dashboard includes participation by gender, type of events, fundraising event by state, year and occupation. This modern and well-arranged Charity Fundraising Marketing Plan Event Analysis Dashboard To Determine Total Guidelines PDF provides lots of creative possibilities. It is very simple to customize and edit with the Powerpoint Software. Just drag and drop your pictures into the shapes. All facets of this template can be edited with Powerpoint, no extra software is necessary. Add your own material, put your images in the places assigned for them, adjust the colors, and then you can show your slides to the world, with an animated slide included.
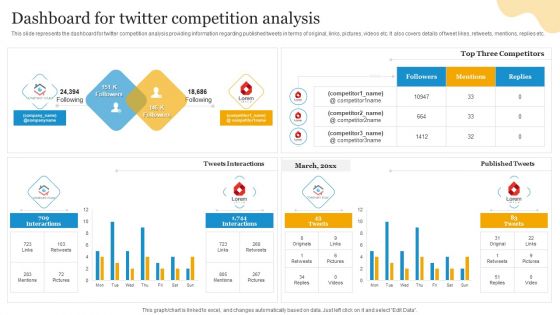
Social Media Advertising Through Twitter Dashboard For Twitter Competition Analysis Designs PDF
This slide represents the dashboard for twitter competition analysis providing information regarding published tweets in terms of original, links, pictures, videos etc. It also covers details of tweet likes, retweets, mentions, replies etc. Get a simple yet stunning designed Social Media Advertising Through Twitter Dashboard For Twitter Competition Analysis Designs PDF. It is the best one to establish the tone in your meetings. It is an excellent way to make your presentations highly effective. So, download this PPT today from Slidegeeks and see the positive impacts. Our easy to edit Social Media Advertising Through Twitter Dashboard For Twitter Competition Analysis Designs PDF can be your go to option for all upcoming conferences and meetings. So, what are you waiting for Grab this template today.
Effective NPO Promotional Strategies For Recruit Volunteers Event Analysis Dashboard Determine Total Funds Raised Icons PDF
This slide provides an overview of the dashboard depicting the events conducted to raise money. The dashboard includes participation by gender, type of events, fundraising event by state, year and occupation. This modern and well-arranged Effective NPO Promotional Strategies For Recruit Volunteers Event Analysis Dashboard Determine Total Funds Raised Icons PDF provides lots of creative possibilities. It is very simple to customize and edit with the Powerpoint Software. Just drag and drop your pictures into the shapes. All facets of this template can be edited with Powerpoint, no extra software is necessary. Add your own material, put your images in the places assigned for them, adjust the colors, and then you can show your slides to the world, with an animated slide included.
SAC Planning And Implementation Deployment Options For SAP Analytics Cloud Icons PDF
The purpose of this slide is to provide an information regarding the deployment methods for SAP Analytics Cloud implementation in the business organization. It also contains details of each deployment options key features. Presenting SAC Planning And Implementation Deployment Options For SAP Analytics Cloud Icons PDF to provide visual cues and insights. Share and navigate important information on two stages that need your due attention. This template can be used to pitch topics like Deployment Option Cloud, Most Suitable, Low implementation cost. In addtion, this PPT design contains high resolution images, graphics, etc, that are easily editable and available for immediate download.
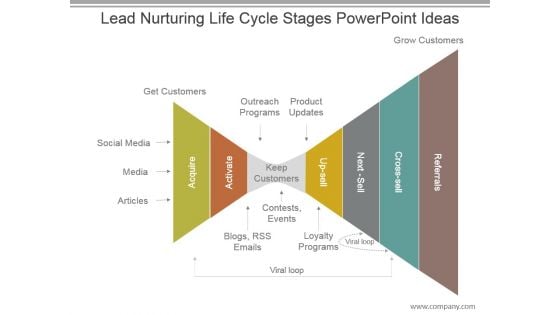
Lead Nurturing Life Cycle Stages Powerpoint Ideas
This is a lead nurturing life cycle stages powerpoint ideas. This is a seven stage process. The stages in this process are get customers, outreach programs, product updates, social media, media, articles, acquire, activate, keep customers, up sell, next sell, cross sell, referrals, grow customers, contests, events, blogs rss emails, loyalty programs, viral loop.
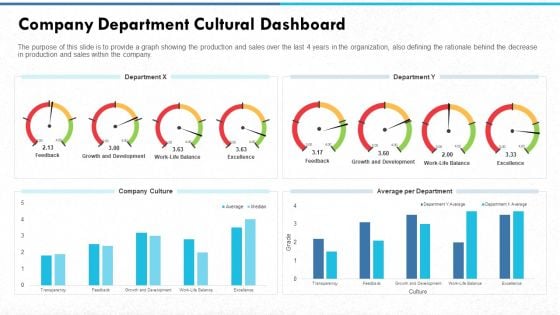
Managing Strong Company Culture In Business Company Department Cultural Dashboard Sample PDF
The purpose of this slide is to provide a graph showing the production and sales over the last 4 years in the organization, also defining the rationale behind the decrease in production and sales within the company. Deliver an awe-inspiring pitch with this creative managing strong company culture in business company department cultural dashboard sample pdf. bundle. Topics like company culture, average per department, department y, department x can be discussed with this completely editable template. It is available for immediate download depending on the needs and requirements of the user.
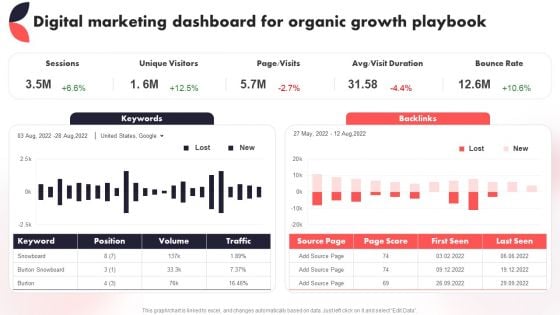
Digital Marketing Dashboard For Organic Growth Playbook Year Over Year Business Success Playbook Themes PDF
This Digital Marketing Dashboard For Organic Growth Playbook Year Over Year Business Success Playbook Themes PDF from Slidegeeks makes it easy to present information on your topic with precision. It provides customization options, so you can make changes to the colors, design, graphics, or any other component to create a unique layout. It is also available for immediate download, so you can begin using it right away. Slidegeeks has done good research to ensure that you have everything you need to make your presentation stand out. Make a name out there for a brilliant performance.
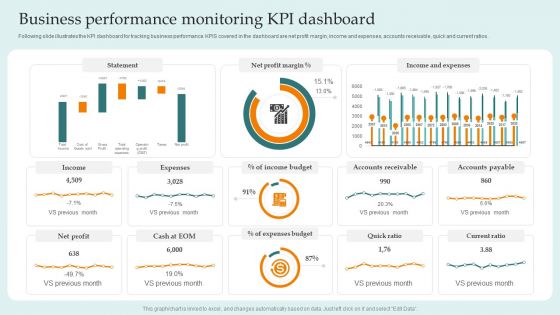
Business Performance Monitoring Kpi Dashboard Guide For Successful Merger And Acquisition Mockup PDF
Coming up with a presentation necessitates that the majority of the effort goes into the content and the message you intend to convey. The visuals of a PowerPoint presentation can only be effective if it supplements and supports the story that is being told. Keeping this in mind our experts created Business Performance Monitoring Kpi Dashboard Guide For Successful Merger And Acquisition Mockup PDF to reduce the time that goes into designing the presentation. This way, you can concentrate on the message while our designers take care of providing you with the right template for the situation.
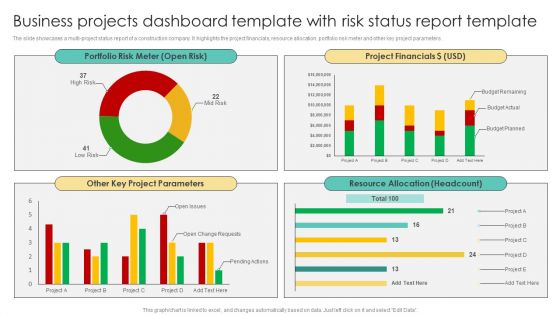
Business Projects Dashboard Template With Risk Status Report Template Topics PDF
The slide showcases a multi-project status report of a construction company. It highlights the project financials, resource allocation, portfolio risk meter and other key project parameters. Pitch your topic with ease and precision using this Business Projects Dashboard Template With Risk Status Report Template Topics PDF. This layout presents information on Portfolio Risk Meter, Project Financials, Project Parameters, Resource Allocation. It is also available for immediate download and adjustment. So, changes can be made in the color, design, graphics or any other component to create a unique layout.
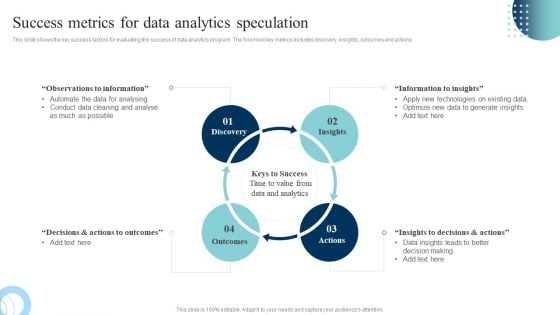
Data Evaluation And Processing Toolkit Success Metrics For Data Analytics Speculation Portrait PDF
This slide shows the key success factors for evaluating the success of data analytics program. The foremost key metrics includes discovery, insights, outcomes and actions. Crafting an eye-catching presentation has never been more straightforward. Let your presentation shine with this tasteful yet straightforward Data Evaluation And Processing Toolkit Success Metrics For Data Analytics Speculation Portrait PDF template. It offers a minimalistic and classy look that is great for making a statement. The colors have been employed intelligently to add a bit of playfulness while still remaining professional. Construct the ideal Data Evaluation And Processing Toolkit Success Metrics For Data Analytics Speculation Portrait PDF that effortlessly grabs the attention of your audience Begin now and be certain to wow your customers.
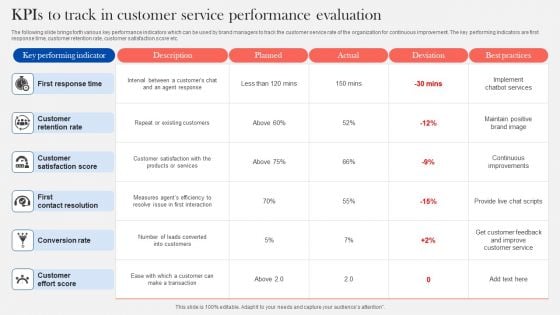
Kpis To Track In Customer Service Performance Evaluation Diagrams PDF
The following slide brings forth various key performance indicators which can be used by brand managers to track the customer service rate of the organization for continuous improvement. The key performing indicators are first response time, customer retention rate, customer satisfaction score etc. Showcasing this set of slides titled Kpis To Track In Customer Service Performance Evaluation Diagrams PDF. The topics addressed in these templates are First Response Time, Customer Retention Rate, Customer Satisfaction Score. All the content presented in this PPT design is completely editable. Download it and make adjustments in color, background, font etc. as per your unique business setting.
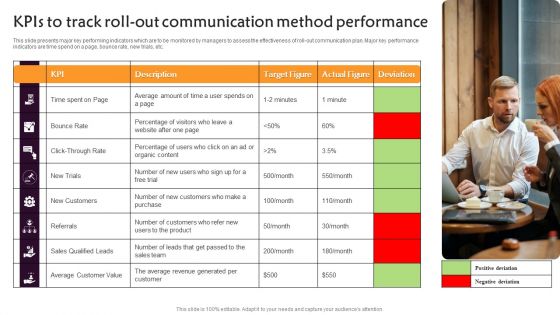
Kpis To Track Roll Out Communication Method Performance Demonstration PDF
This slide presents major key performing indicators which are to be monitored by managers to assess the effectiveness of roll-out communication plan. Major key performance indicators are time spend on a page, bounce rate, new trials, etc. Presenting Kpis To Track Roll Out Communication Method Performance Demonstration PDF to dispense important information. This template comprises one stages. It also presents valuable insights into the topics including Bounce Rate, New Trials, Referrals. This is a completely customizable PowerPoint theme that can be put to use immediately. So, download it and address the topic impactfully.
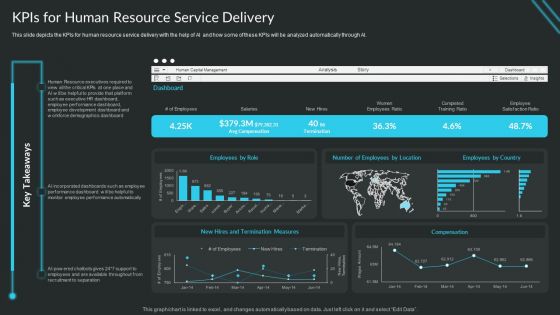
Proactive Consumer Solution And How To Perform It Kpis For Human Resource Service Delivery Clipart PDF
This slide depicts the KPIs for human resource service delivery with the help of AI and how some of these KPIs will be analyzed automatically through AI.Deliver and pitch your topic in the best possible manner with this Proactive Consumer Solution And How To Perform It Kpis For Human Resource Service Delivery Clipart PDF. Use them to share invaluable insights on Executive Dashboard, Performance Dashboard, Development Dashboard and impress your audience. This template can be altered and modified as per your expectations. So, grab it now.
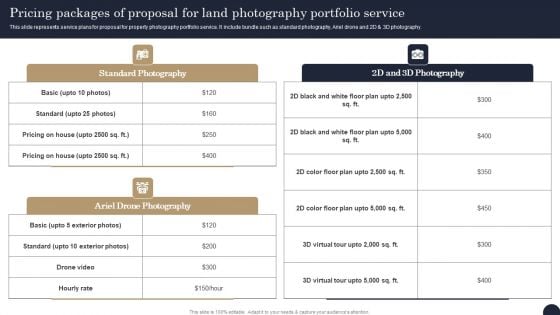
Pricing Packages Of Proposal For Land Photography Portfolio Service Mockup PDF
This slide represents service plans for proposal for property photography portfolio service. It include bundle such as standard photography, Ariel drone and 2D and 3D photography. Make a lasting impression with our Pricing Packages Of Proposal For Land Photography Portfolio Service Mockup PDF Our 100 percent editable Template is packed with visually-stunning designs that are sure to impress. With easy-to-use features and customizable elements, you can create unique proposals that meet your specific needs. Whether youre creating a corporate proposal or a business proposal, our Template is the perfect tool to help you succeed. Say goodbye to mundane proposals and hello to our Proposal PPT Template.


 Continue with Email

 Home
Home


