Snapshot
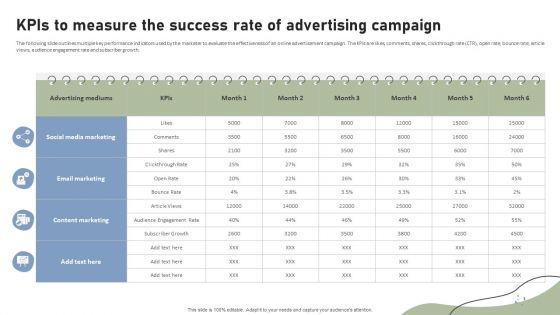
Brand Building Techniques Enhance Customer Engagement Loyalty Kpis To Measure The Success Rate Rules PDF
The following slide outlines multiple key performance indicators used by the marketer to evaluate the effectiveness of an online advertisement campaign. The KPIs are likes, comments, shares, clickthrough rate CTR, open rate, bounce rate, article views, audience engagement rate and subscriber growth. Get a simple yet stunning designed Brand Building Techniques Enhance Customer Engagement Loyalty Kpis To Measure The Success Rate Rules PDF. It is the best one to establish the tone in your meetings. It is an excellent way to make your presentations highly effective. So, download this PPT today from Slidegeeks and see the positive impacts. Our easy to edit Brand Building Techniques Enhance Customer Engagement Loyalty Kpis To Measure The Success Rate Rules PDF can be your go to option for all upcoming conferences and meetings. So, what are you waiting for Grab this template today.
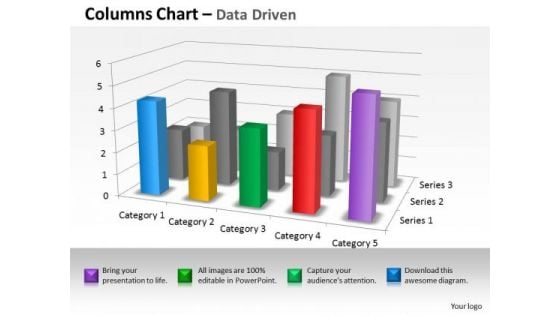
Quantitative Data Analysis 3d Interpretation Of Statistical Quality Control PowerPoint Templates
Land The Idea With Our quantitative data analysis 3d interpretation of statistical quality control Powerpoint Templates . Help It Grow With Your Thoughts.
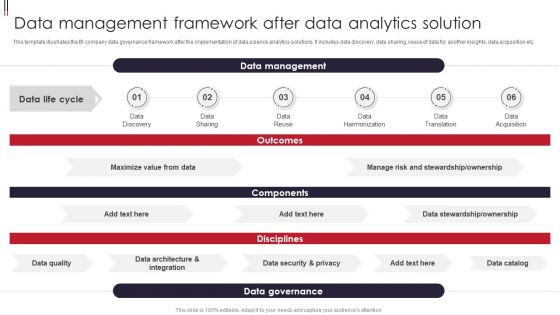
Information Visualizations Playbook Data Management Framework After Data Analytics Solution Formats PDF
Deliver an awe inspiring pitch with this creative Information Visualizations Playbook Data Management Framework After Data Analytics Solution Formats PDF bundle. Topics like Data Discovery, Data Sharing, Data Harmonization can be discussed with this completely editable template. It is available for immediate download depending on the needs and requirements of the user.
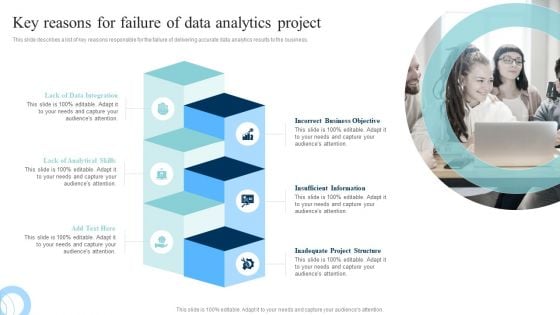
Data Evaluation And Processing Toolkit Key Reasons For Failure Of Data Analytics Project Brochure PDF
This slide describes a list of key reasons responsible for the failure of delivering accurate data analytics results to the business. Create an editable Data Evaluation And Processing Toolkit Key Reasons For Failure Of Data Analytics Project Brochure PDF that communicates your idea and engages your audience. Whether youre presenting a business or an educational presentation, pre-designed presentation templates help save time. Data Evaluation And Processing Toolkit Key Reasons For Failure Of Data Analytics Project Brochure PDF is highly customizable and very easy to edit, covering many different styles from creative to business presentations. Slidegeeks has creative team members who have crafted amazing templates. So, go and get them without any delay.
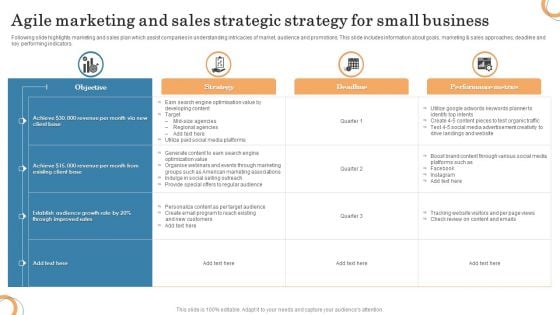
Agile Marketing And Sales Strategic Strategy For Small Business Pictures PDF
Following slide highlights marketing and sales plan which assist companies in understanding intricacies of market, audience and promotions. This slide includes information about goals, marketing and sales approaches, deadline and key performing indicators. Pitch your topic with ease and precision using this Agile Marketing And Sales Strategic Strategy For Small Business Pictures PDF. This layout presents information on Strategy, Performance Metrics, Marketing Associations. It is also available for immediate download and adjustment. So, changes can be made in the color, design, graphics or any other component to create a unique layout.
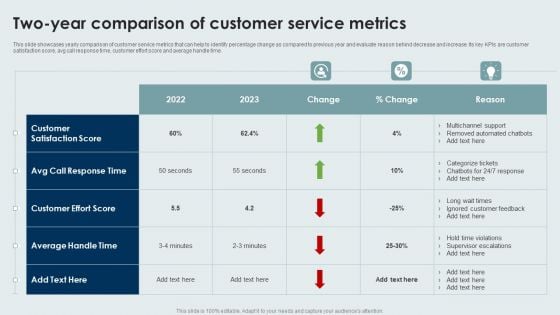
Two Year Comparison Of Customer Service Metrics Information PDF
This slide showcases yearly comparison of customer service metrics that can help to identify percentage change as compared to previous year and evaluate reason behind decrease and increase. Its key KPIs are customer satisfaction score, avg call response time, customer effort score and average handle time. Pitch your topic with ease and precision using this Two Year Comparison Of Customer Service Metrics Information PDF. This layout presents information on Customer Effort Score, Customer Satisfaction Score, Average Handle Time. It is also available for immediate download and adjustment. So, changes can be made in the color, design, graphics or any other component to create a unique layout.

Project Management Experts Required Reports Issues Faced By Company Due To Poorly Managed Project Documents Download PDF
This slide provides the glimpse about the issues faced by the company due to poorly managed project documents such as lack of visibility, weak security, data loss, and limited collaboration. Presenting project management experts required reports issues faced by company due to poorly managed project documents download pdf to provide visual cues and insights. Share and navigate important information on four stages that need your due attention. This template can be used to pitch topics like lack of visibility, weak security, loss of data, limited collaboration. In addtion, this PPT design contains high resolution images, graphics, etc, that are easily editable and available for immediate download.

Crm Sales Leads With Marketing Ppt PowerPoint Presentation Picture
This is a crm sales leads with marketing ppt powerpoint presentation picture. This is a five stage process. The stages in this process are inquiry, marketing qualified lead, sales accepted lead, sales qualified lead, close.

Company Background Ppt PowerPoint Presentation Pictures File Formats
This is a company background ppt powerpoint presentation pictures file formats. This is a three stage process. The stages in this process are we are creatives, we are professionals, we are talented.
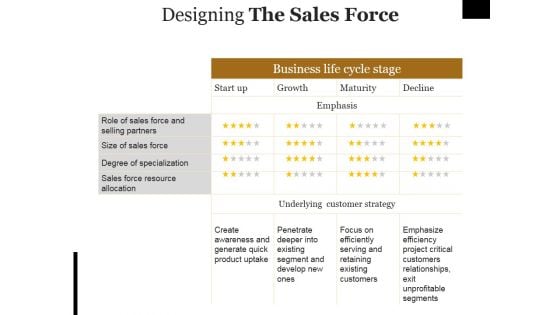
Designing The Sales Force Ppt PowerPoint Presentation Pictures Format
This is a designing the sales force ppt powerpoint presentation pictures format. This is a four stage process. The stages in this process are start up, growth, maturity, decline, emphasis.
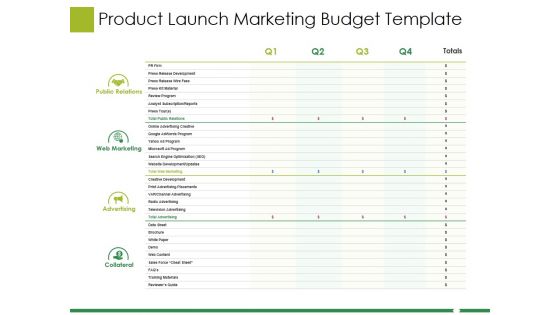
Product Launch Marketing Budget Template Ppt PowerPoint Presentation Pictures Objects
This is a product launch marketing budget template ppt powerpoint presentation pictures objects. This is a four stage process. The stages in this process are public relations, web marketing, advertising, collateral.
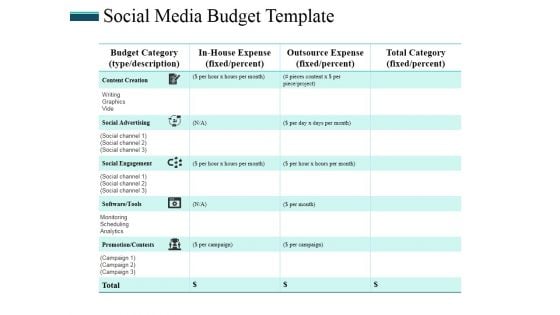
Social Media Budget Template Ppt PowerPoint Presentation Model Graphics Pictures
This is a social media budget template ppt powerpoint presentation model graphics pictures. This is a five stage process. The stages in this process are budget category, in house expense, outsource expense, total category.
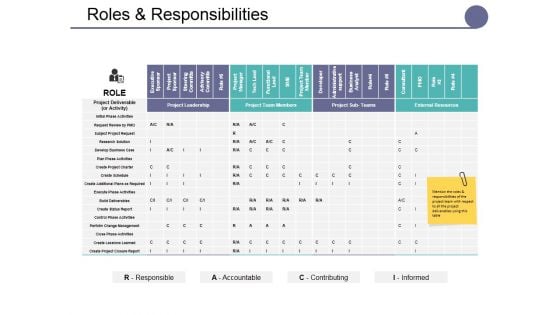
Roles And Responsibilities Ppt PowerPoint Presentation Pictures Sample
This is a roles and responsibilities ppt powerpoint presentation pictures sample. This is a four stage process. The stages in this process are project leadership, project team members, external resources, role.
Work Breakdown Structure Ppt PowerPoint Presentation Pictures Icon
This is a work breakdown structure ppt powerpoint presentation pictures icon. This is a five stage process. The stages in this process are define the problem, produce the project schedule, confirm project feasibility, staff the project, launch the project.
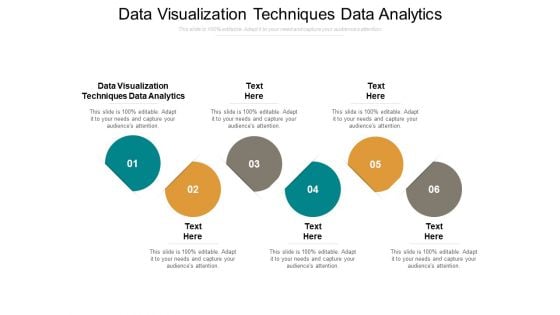
Data Visualization Techniques Data Analytics Ppt PowerPoint Presentation Outline Clipart Images Cpb
Presenting this set of slides with name data visualization techniques data analytics ppt powerpoint presentation outline clipart images cpb. This is an editable Powerpoint six stages graphic that deals with topics like data visualization techniques data analytics to help convey your message better graphically. This product is a premium product available for immediate download and is 100 percent editable in Powerpoint. Download this now and use it in your presentations to impress your audience.
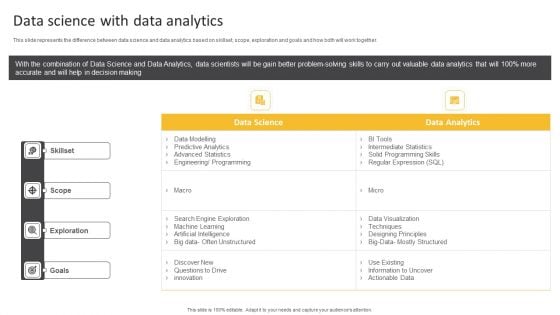
Information Science Data Science With Data Analytics Ppt PowerPoint Presentation Infographics Show PDF
This slide represents the difference between data science and data analytics based on skillset, scope, exploration and goals and how both will work together.Deliver and pitch your topic in the best possible manner with this Information Science Data Science With Data Analytics Ppt PowerPoint Presentation Infographics Show PDF. Use them to share invaluable insights on Engine Exploration, Machine Learning, Often Unstructured and impress your audience. This template can be altered and modified as per your expectations. So, grab it now.
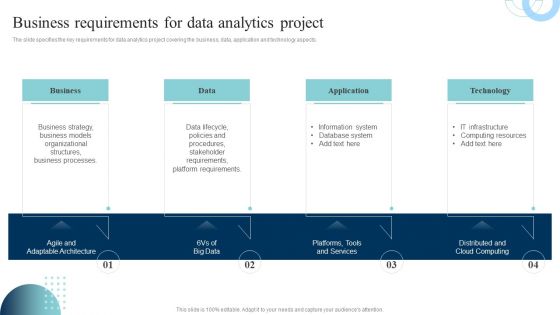
Data Evaluation And Processing Toolkit Business Requirements For Data Analytics Project Ideas PDF
The slide specifies the key requirements for data analytics project covering the business, data, application and technology aspects. There are so many reasons you need a Data Evaluation And Processing Toolkit Business Requirements For Data Analytics Project Ideas PDF. The first reason is you cant spend time making everything from scratch, Thus, Slidegeeks has made presentation templates for you too. You can easily download these templates from our website easily.
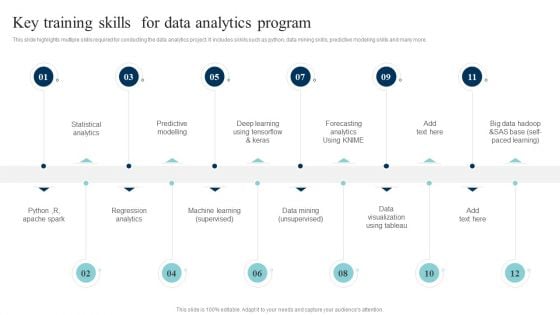
Data Evaluation And Processing Toolkit Key Training Skills For Data Analytics Program Themes PDF
This slide highlights multiple skills required for conducting the data analytics project. It includes skkils such as python, data mining skills, predictive modeling skills and many more. There are so many reasons you need a Data Evaluation And Processing Toolkit Key Training Skills For Data Analytics Program Themes PDF. The first reason is you cant spend time making everything from scratch, Thus, Slidegeeks has made presentation templates for you too. You can easily download these templates from our website easily.
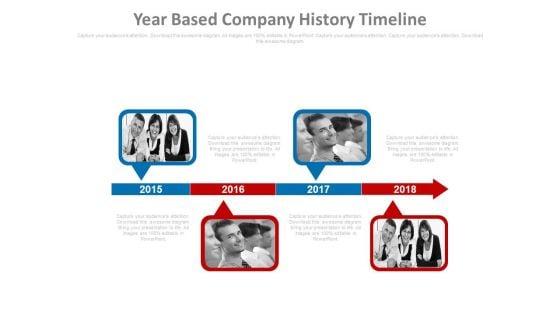
Linear Arrow Timeline With Photos Powerpoint Slides
This PowerPoint template has been designed with graphics of linear arrow timeline with team pictures. You may download this timeline diagram slide to show team progress or the aims of your organizations. Chart the course you intend to take with this slide.
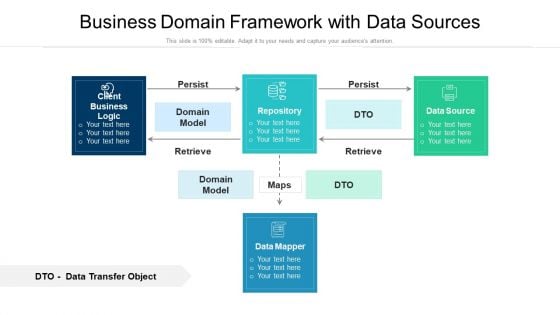
Business Domain Framework With Data Sources Ppt Pictures Slideshow PDF
Pitch your topic with ease and precision using this business domain framework with data sources ppt pictures slideshow pdf. This layout presents information on client business logic, repository, data source, data mapper. It is also available for immediate download and adjustment. So, changes can be made in the color, design, graphics or any other component to create a unique layout.
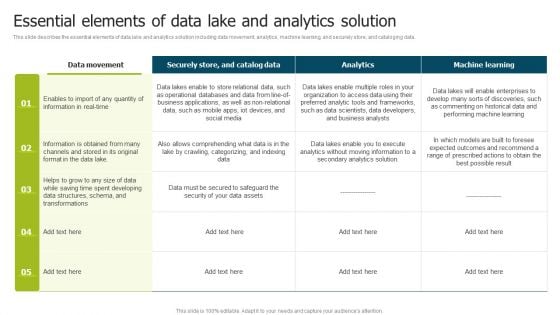
Data Lake Implementation Essential Elements Of Data Lake And Analytics Solution Brochure PDF
This slide describes the essential elements of data lake and analytics solution including data movement, analytics, machine learning, and securely store, and cataloging data. If you are looking for a format to display your unique thoughts, then the professionally designed Data Lake Implementation Essential Elements Of Data Lake And Analytics Solution Brochure PDF is the one for you. You can use it as a Google Slides template or a PowerPoint template. Incorporate impressive visuals, symbols, images, and other charts. Modify or reorganize the text boxes as you desire. Experiment with shade schemes and font pairings. Alter, share or cooperate with other people on your work. Download Data Lake Implementation Essential Elements Of Data Lake And Analytics Solution Brochure PDF and find out how to give a successful presentation. Present a perfect display to your team and make your presentation unforgettable.
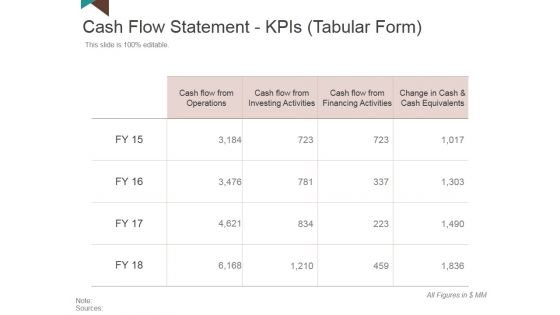
Cash Flow Statement Kpis Template 1 Ppt PowerPoint Presentation Pictures Objects
This is a cash flow statement kpis template 1 ppt powerpoint presentation pictures objects. This is a four stage process. The stages in this process are cash flow from operations, cash flow from investing activities, cash flow from financing activities, change in cash and cash equivalents.
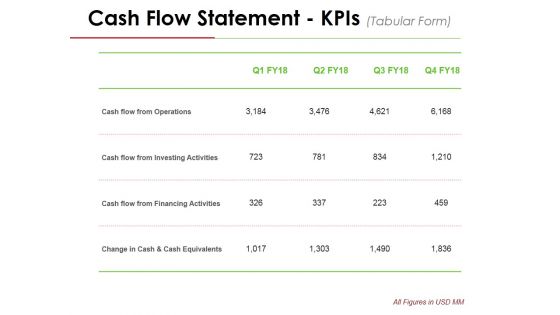
Cash Flow Statement Kpis Template 2 Ppt PowerPoint Presentation Pictures Guide
This is a cash flow statement kpis template 2 ppt powerpoint presentation pictures guide. This is a four stage process. The stages in this process are cash flow from operations, cash flow from investing activities, cash flow from financing activities, change in cash and cash equivalents.
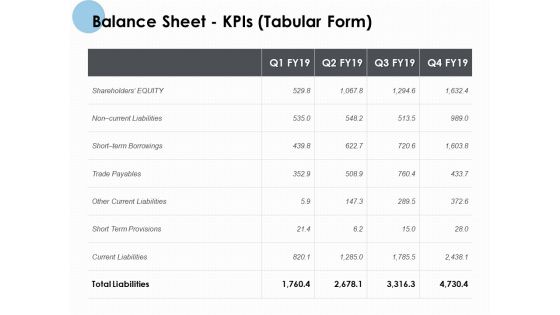
Balance Sheet Kpis Tabular Form Ppt PowerPoint Presentation Summary Graphics Pictures
Presenting this set of slides with name balance sheet kpis tabular form ppt powerpoint presentation summary graphics pictures. The topics discussed in these slides are current assets, current liabilities, total assets, total liabilities. This is a completely editable PowerPoint presentation and is available for immediate download. Download now and impress your audience.
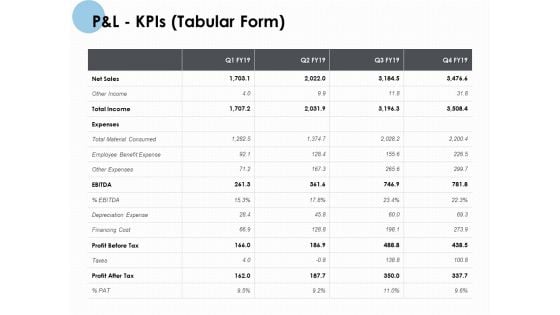
P And L Kpis Tabular Form Ppt PowerPoint Presentation Pictures Introduction
Presenting this set of slides with name p and l kpis tabular form ppt powerpoint presentation pictures introduction. The topics discussed in these slides are revenue, operating profit, net increase cash. This is a completely editable PowerPoint presentation and is available for immediate download. Download now and impress your audience.
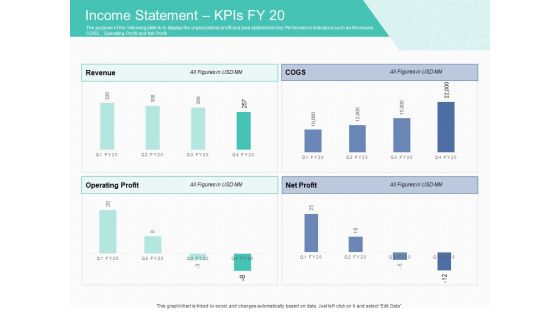
Corporate Debt Refinancing And Restructuring Income Statement Kpis FY 20 Pictures PDF
Presenting this set of slides with name corporate debt refinancing and restructuring income statement kpis fy 20 pictures pdf. The topics discussed in these slides are revenue, cogs, operating profit, net profit. This is a completely editable PowerPoint presentation and is available for immediate download. Download now and impress your audience.
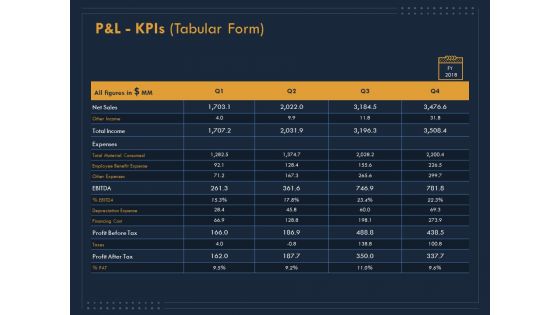
Enterprise Review P And L Kpis Tabular Form Ppt Pictures Template PDF
Deliver an awe inspiring pitch with this creative enterprise review p and l kpis tabular form ppt pictures template pdf bundle. Topics like revenue, operating profit, cogs, net profit can be discussed with this completely editable template. It is available for immediate download depending on the needs and requirements of the user.
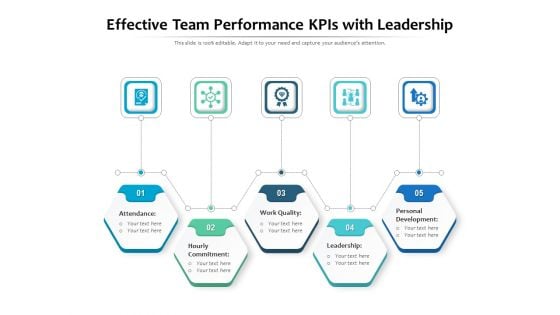
Effective Team Performance KPIs With Leadership Ppt PowerPoint Presentation Slides Graphics Pictures PDF
Presenting effective team performance kpis with leadership ppt powerpoint presentation slides graphics pictures pdf to dispense important information. This template comprises five stages. It also presents valuable insights into the topics including attendance, hourly commitment, work quality, leadership, personal development. This is a completely customizable PowerPoint theme that can be put to use immediately. So, download it and address the topic impactfully.
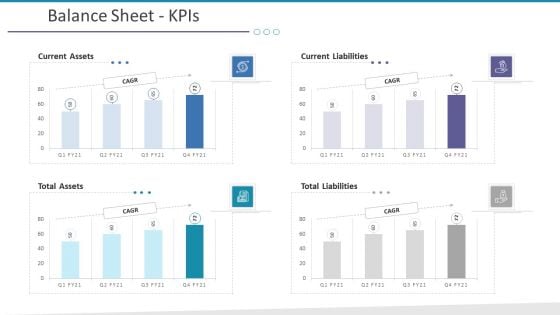
Investigation For Business Procurement Balance Sheet Kpis Ppt Layouts Pictures PDF
Deliver and pitch your topic in the best possible manner with this investigation for business procurement balance sheet kpis ppt layouts pictures pdf. Use them to share invaluable insights on current assets, total assets, total liabilities, current liabilities and impress your audience. This template can be altered and modified as per your expectations. So, grab it now.
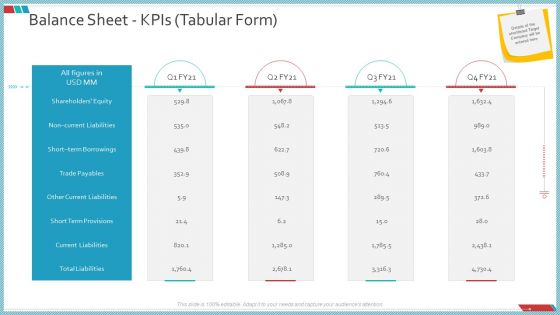
Enterprise Action Plan For Growth Balance Sheet Kpis Tabular Form Pictures PDF
Deliver and pitch your topic in the best possible manner with this enterprise action plan for growth balance sheet kpis tabular form pictures pdf. Use them to share invaluable insights on shareholders equity, other current liabilities, short term provisions and impress your audience. This template can be altered and modified as per your expectations. So, grab it now.
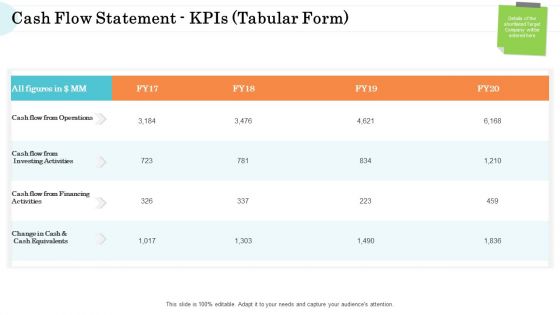
Steps In M And A Process Cash Flow Statement Kpis Tabular Form Pictures PDF
Deliver an awe inspiring pitch with this creative steps in m and a process cash flow statement kpis tabular form pictures pdf bundle. Topics like cash flow from operations, cash flow from investing activities, cash flow from financing activities can be discussed with this completely editable template. It is available for immediate download depending on the needs and requirements of the user.

HR Capital Management Strategy With Kpis Ppt Styles Graphics Pictures PDF
Pitch your topic with ease and precision using this hr capital management strategy with kpis ppt styles graphics pictures pdf. This layout presents information on marketing project expand the sales region, employee productivity. It is also available for immediate download and adjustment. So, changes can be made in the color, design, graphics or any other component to create a unique layout.
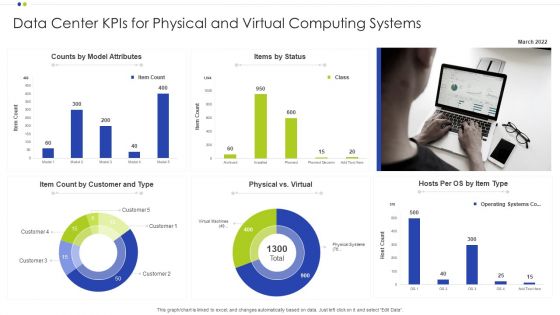
Data Center Kpis For Physical And Virtual Computing Systems Ppt Infographic Template Pictures PDF
Showcasing this set of slides titled Data Center Kpis For Physical And Virtual Computing Systems Ppt Infographic Template Pictures PDF. The topics addressed in these templates are Operating Systems, Computing Systems, Data Center. All the content presented in this PPT design is completely editable. Download it and make adjustments in color, background, font etc. as per your unique business setting.
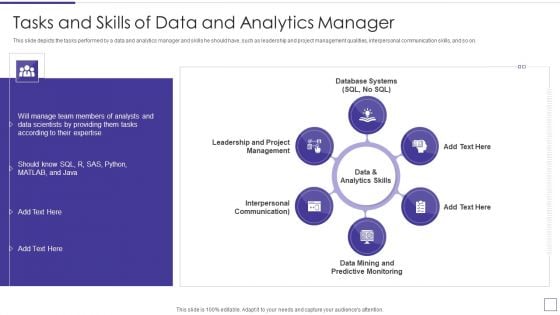
Data Mining Implementation Tasks And Skills Of Data And Analytics Manager Graphics PDF
This slide depicts the tasks performed by a data and analytics manager and skills he should have, such as leadership and project management qualities, interpersonal communication skills, and so on. This is a data mining implementation tasks and skills of data and analytics manager graphics pdf template with various stages. Focus and dispense information on six stages using this creative set, that comes with editable features. It contains large content boxes to add your information on topics like interpersonal communication, mining and predictive monitoring, data and analytics skills You can also showcase facts, figures, and other relevant content using this PPT layout. Grab it now.
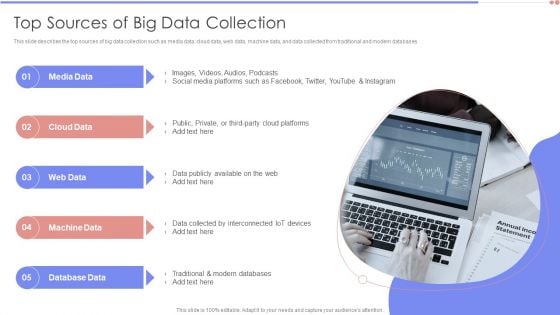
Data Analytics Management Top Sources Of Big Data Collection Sample PDF
This slide describes the top sources of big data collection such as media data, cloud data, web data, machine data, and data collected from traditional and modern databases.Presenting Data Analytics Management Top Sources Of Big Data Collection Sample PDF to provide visual cues and insights. Share and navigate important information on five stages that need your due attention. This template can be used to pitch topics like Machine Data, Database Data, Media Data. In addtion, this PPT design contains high resolution images, graphics, etc, that are easily editable and available for immediate download.

Business Intelligence And Big Data Work Streams Organizational Structure For Data Analytics Formats PDF
This slide shows the organization structure model including the analytics leadership, analytical tool for to obtain the business results. Presenting business intelligence and big data work streams organizational structure for data analytics formats pdf to provide visual cues and insights. Share and navigate important information on two stages that need your due attention. This template can be used to pitch topics like business sponsor, analytics leadership, business owner, it owner. In addtion, this PPT design contains high resolution images, graphics, etc, that are easily editable and available for immediate download.
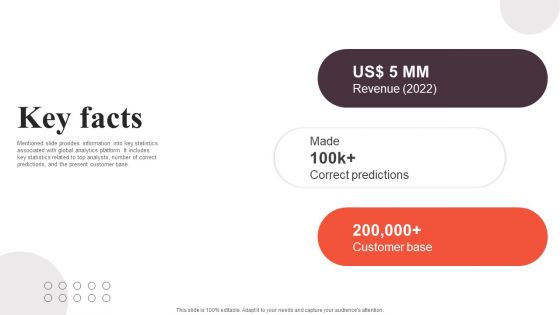
Financial Analytics Solution Investor Funding Elevator Pitch Deck Key Facts Themes PDF
Mentioned slide provides information into key statistics associated with global analytics platform. It includes key statistics related to top analysts, number of correct predictions, and the present customer base. The Financial Analytics Solution Investor Funding Elevator Pitch Deck Key Facts Themes PDF is a compilation of the most recent design trends as a series of slides. It is suitable for any subject or industry presentation, containing attractive visuals and photo spots for businesses to clearly express their messages. This template contains a variety of slides for the user to input data, such as structures to contrast two elements, bullet points, and slides for written information. Slidegeeks is prepared to create an impression.
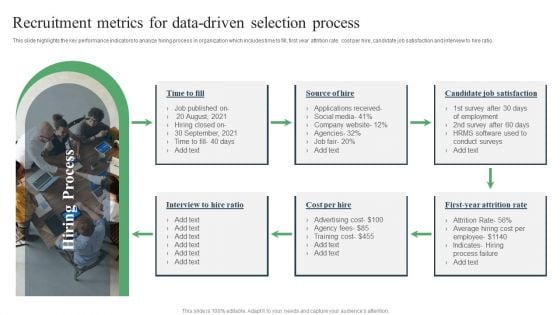
Recruitment Metrics For Data Driven Selection Process Ppt PowerPoint Presentation Inspiration Graphics Download PDF
This slide highlights the key performance indicators to analyze hiring process in organization which includes time to fill, first year attrition rate, cost per hire, candidate job satisfaction and interview to hire ratio. Persuade your audience using this Recruitment Metrics For Data-Driven Selection Process Ppt PowerPoint Presentation Inspiration Graphics Download PDF. This PPT design covers one stage, thus making it a great tool to use. It also caters to a variety of topics including Candidate Job, Satisfaction, Attrition Rate. Download this PPT design now to present a convincing pitch that not only emphasizes the topic but also showcases your presentation skills.
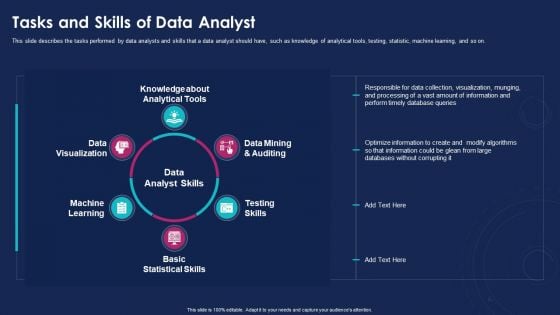
Data Analytics IT Tasks And Skills Of Data Analyst Ppt Infographic Template Vector PDF
This slide describes the tasks performed by data analysts and skills that a data analyst should have, such as knowledge of analytical tools, testing, statistic, machine learning, and so on. Presenting data analytics it tasks and skills of data analyst ppt infographic template vector pdf to provide visual cues and insights. Share and navigate important information on six stages that need your due attention. This template can be used to pitch topics like data visualization, machine learning, basic statistical skills, testing skills, data mining and auditing. In addtion, this PPT design contains high resolution images, graphics, etc, that are easily editable and available for immediate download.
Data Evaluation And Processing Toolkit Key Features Of Data Analytics Software Icons PDF
This slide shows broad range of data analytics features that help businesses to draw data driven decision. It includes features such as collaboration, data cleaning, data governance and many more. Take your projects to the next level with our ultimate collection of Data Evaluation And Processing Toolkit Key Features Of Data Analytics Software Icons PDF. Slidegeeks has designed a range of layouts that are perfect for representing task or activity duration, keeping track of all your deadlines at a glance. Tailor these designs to your exact needs and give them a truly corporate look with your own brand colors theyll make your projects stand out from the rest.
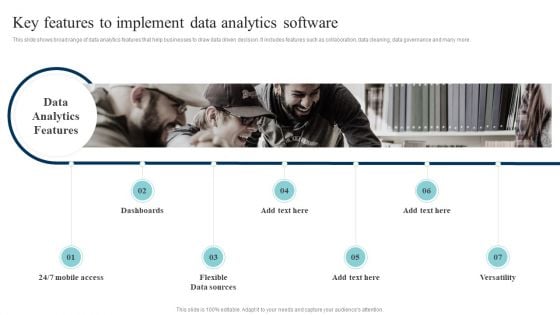
Data Evaluation And Processing Toolkit Key Features To Implement Data Analytics Software Designs PDF
This slide shows broad range of data analytics features that help businesses to draw data driven decision. It includes features such as collaboration, data cleaning, data governance and many more. Find a pre-designed and impeccable Data Evaluation And Processing Toolkit Key Features To Implement Data Analytics Software Designs PDF. The templates can ace your presentation without additional effort. You can download these easy-to-edit presentation templates to make your presentation stand out from others. So, what are you waiting for Download the template from Slidegeeks today and give a unique touch to your presentation.

Big Data Analytics Lifecycle Top Big Data Technology Domains Ppt Show Diagrams PDF
This slide represents the top big data technology domains, such as data storage, mining, analytics, and data visualization. It caters to the big data tools that every domain contains, such as Hadoop, MongoDB, RainStor, Presto, RapidMiner, etc. There are so many reasons you need a Big Data Analytics Lifecycle Top Big Data Technology Domains Ppt Show Diagrams PDF. The first reason is you cant spend time making everything from scratch, Thus, Slidegeeks has made presentation templates for you too. You can easily download these templates from our website easily.
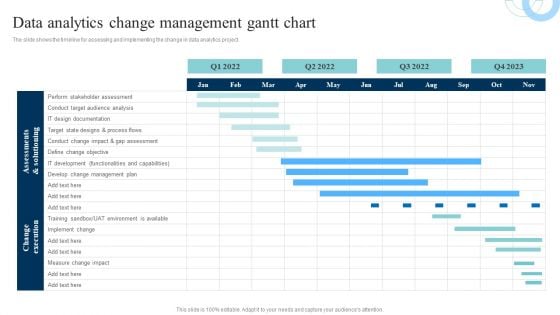
Data Evaluation And Processing Toolkit Data Analytics Change Management Gantt Chart Elements PDF
The slide shows the timeline for assessing and implementing the change in data analytics project. If your project calls for a presentation, then Slidegeeks is your go-to partner because we have professionally designed, easy-to-edit templates that are perfect for any presentation. After downloading, you can easily edit Data Evaluation And Processing Toolkit Data Analytics Change Management Gantt Chart Elements PDF and make the changes accordingly. You can rearrange slides or fill them with different images. Check out all the handy templates.
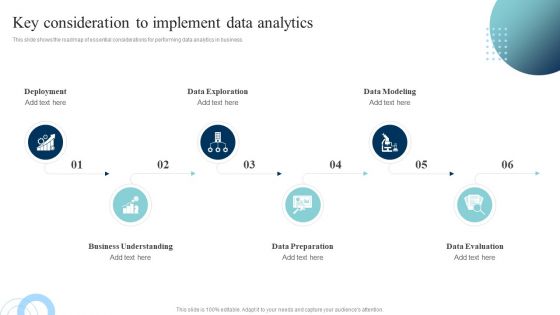
Data Evaluation And Processing Toolkit Key Consideration To Implement Data Analytics Graphics PDF
This slide shows the roadmap of essential considerations for performing data analytics in business. Find a pre-designed and impeccable Data Evaluation And Processing Toolkit Key Consideration To Implement Data Analytics Graphics PDF. The templates can ace your presentation without additional effort. You can download these easy-to-edit presentation templates to make your presentation stand out from others. So, what are you waiting for Download the template from Slidegeeks today and give a unique touch to your presentation.
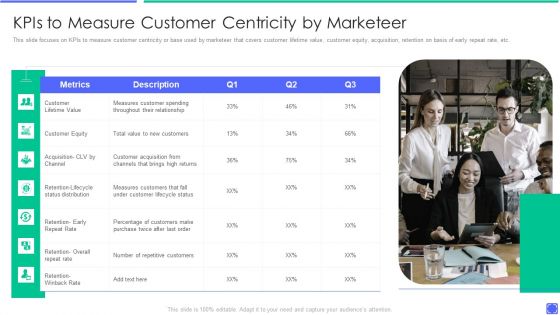
Best Techniques To Enhance New Product Management Efficiency Kpis To Measure Customer Pictures PDF
This slide focuses on KPIs to measure customer centricity or base used by marketeer that covers customer lifetime value, customer equity, acquisition, retention on basis of early repeat rate, etc. Presenting best techniques to enhance new product management efficiency kpis to measure customer pictures pdf to provide visual cues and insights. Share and navigate important information on seven stages that need your due attention. This template can be used to pitch topics like define goals and objectives, create roadmap, product success metrics. In addtion, this PPT design contains high resolution images, graphics, etc, that are easily editable and available for immediate download.
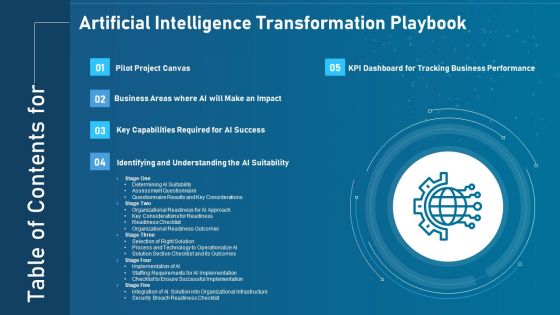
Table Of Contents Artificial Intelligence Transformation Playbook Pictures PDF
Deliver an awe inspiring pitch with this creative table of contents artificial intelligence transformation playbook pictures pdf bundle. Topics like pilot project canvas, business areas where ai will make an impact, key capabilities required for ai success, identifying and understanding the ai suitability, kpi dashboard for tracking business performance can be discussed with this completely editable template. It is available for immediate download depending on the needs and requirements of the user.
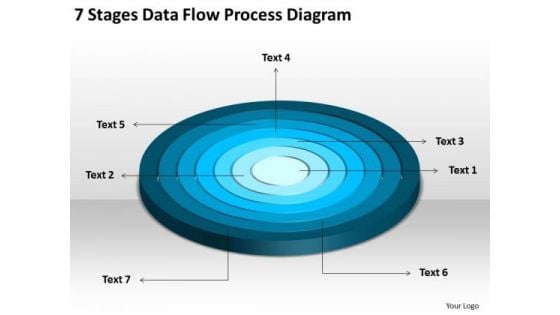
7 Stages Data Flow Process Diagram Business Plan PowerPoint Templates
We present our 7 stages data flow process diagram business plan PowerPoint templates.Download and present our Circle Charts PowerPoint Templates because Our PowerPoint Templates and Slides ensures Effective communication. They help you put across your views with precision and clarity. Download our Shapes PowerPoint Templates because Our PowerPoint Templates and Slides will let your team Walk through your plans. See their energy levels rise as you show them the way. Present our Signs PowerPoint Templates because Our PowerPoint Templates and Slides are Clear and concise. Use them and dispel any doubts your team may have. Present our Maketing PowerPoint Templates because Our PowerPoint Templates and Slides are aesthetically designed to attract attention. We gaurantee that they will grab all the eyeballs you need. Download and present our Metaphors-Visual Concepts PowerPoint Templates because Our PowerPoint Templates and Slides offer you the needful to organise your thoughts. Use them to list out your views in a logical sequence.Use these PowerPoint slides for presentations relating to diagram, circular, market, bar, advertise, interface, business, concept, vector, sign, success, presentation, symbol, template, circle, brochure, finance, data, description, report, marketing, title, label, abstract, management, graph, four, illustration, icon, pie, chart, strategy, catalog, research, web, design, growth, text, professional, banner, account, profit, information, background, info-graphic, analyze, financial, button, goals. The prominent colors used in the PowerPoint template are Blue, Blue light, White. Amuse your audience with our 7 Stages Data Flow Process Diagram Business Plan PowerPoint Templates. Some of them are designed to be far out.
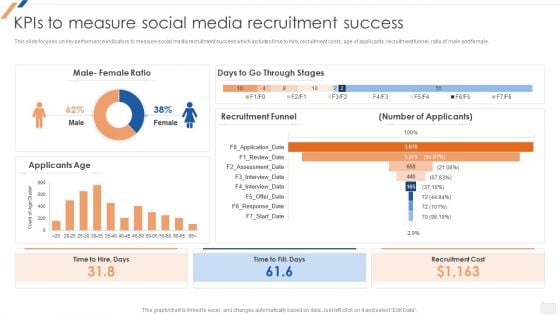
Kpis To Measure Social Media Recruitment Success Enhancing Social Media Recruitment Process Mockup PDF
This slide focuses on key performance indicators to measure social media recruitment success which includes time to hire, recruitment costs, age of applicants, recruitment funnel, ratio of male and female.Crafting an eye-catching presentation has never been more straightforward. Let your presentation shine with this tasteful yet straightforward Kpis To Measure Social Media Recruitment Success Enhancing Social Media Recruitment Process Mockup PDF template. It offers a minimalistic and classy look that is great for making a statement. The colors have been employed intelligently to add a bit of playfulness while still remaining professional. Construct the ideal Kpis To Measure Social Media Recruitment Success Enhancing Social Media Recruitment Process Mockup PDF that effortlessly grabs the attention of your audience Begin now and be certain to wow your customers.
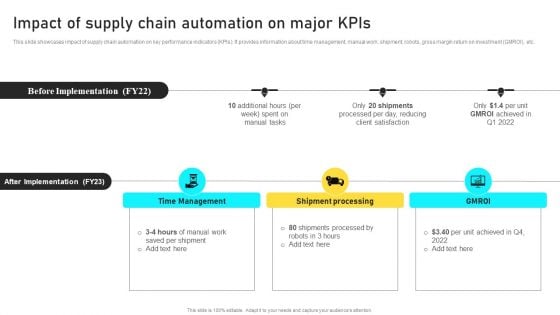
Manufacturing Process Automation For Enhancing Productivity Impact Of Supply Chain Automation On Major Kpis Demonstration PDF
This slide showcases impact of supply chain automation on key performance indicators KPIs. It provides information about time management, manual work, shipment, robots, gross margin return on investment GMROI, etc. Coming up with a presentation necessitates that the majority of the effort goes into the content and the message you intend to convey. The visuals of a PowerPoint presentation can only be effective if it supplements and supports the story that is being told. Keeping this in mind our experts created Manufacturing Process Automation For Enhancing Productivity Impact Of Supply Chain Automation On Major Kpis Demonstration PDF to reduce the time that goes into designing the presentation. This way, you can concentrate on the message while our designers take care of providing you with the right template for the situation.
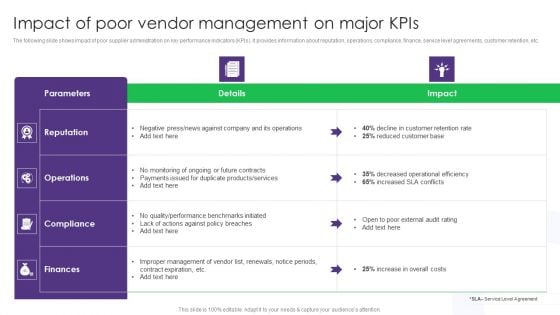
Impact Of Poor Vendor Management On Major Kpis Vendor Management System Deployment Elements PDF
The following slide shows impact of poor supplier administration on key performance indicators KPIs. It provides information about reputation, operations, compliance, finance, service level agreements, customer retention, etc. Present like a pro with Impact Of Poor Vendor Management On Major Kpis Vendor Management System Deployment Elements PDF Create beautiful presentations together with your team, using our easy-to-use presentation slides. Share your ideas in real-time and make changes on the fly by downloading our templates. So whether you are in the office, on the go, or in a remote location, you can stay in sync with your team and present your ideas with confidence. With Slidegeeks presentation got a whole lot easier. Grab these presentations today.

Coca Cola Emotional Marketing Strategy Affect Of Consumer Emotions On Brands Kpis Inspiration PDF
This slide showcases assessing key indicators for measuring financial performance of brand. It provides details about turnover, marketing costs, sales, administrative expenses, profit, percentage turnover, trade debtor days, headcount, etc. Create an editable Coca Cola Emotional Marketing Strategy Affect Of Consumer Emotions On Brands Kpis Inspiration PDF that communicates your idea and engages your audience. Whether youre presenting a business or an educational presentation, pre-designed presentation templates help save time. Coca Cola Emotional Marketing Strategy Affect Of Consumer Emotions On Brands Kpis Inspiration PDF is highly customizable and very easy to edit, covering many different styles from creative to business presentations. Slidegeeks has creative team members who have crafted amazing templates. So, go and get them without any delay.
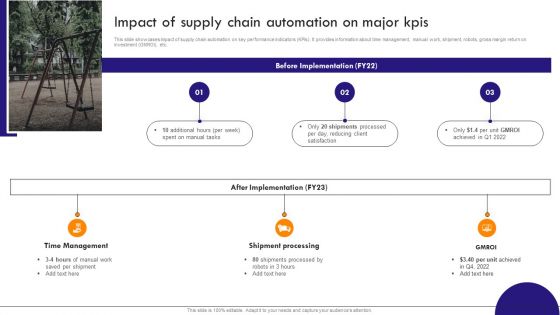
Implementing Robotic Process Impact Of Supply Chain Automation On Major Kpis Elements PDF
This slide showcases impact of supply chain automation on key performance indicators KPIs. It provides information about time management, manual work, shipment, robots, gross margin return on investment GMROI, etc. Welcome to our selection of the Implementing Robotic Process Impact Of Supply Chain Automation On Major Kpis Elements PDF. These are designed to help you showcase your creativity and bring your sphere to life. Planning and Innovation are essential for any business that is just starting out. This collection contains the designs that you need for your everyday presentations. All of our PowerPoints are 100 percent editable, so you can customize them to suit your needs. This multi-purpose template can be used in various situations. Grab these presentation templates today.
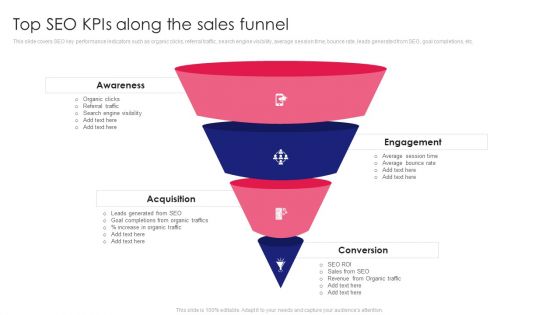
Guide To SEO Marketing Top SEO Kpis Along The Sales Funnel Slides PDF
This slide covers SEO key performance indicators such as organic clicks, referral traffic, search engine visibility, average session time, bounce rate, leads generated from SEO, goal completions, etc. Find highly impressive Guide To SEO Marketing Top SEO Kpis Along The Sales Funnel Slides PDF on Slidegeeks to deliver a meaningful presentation. You can save an ample amount of time using these presentation templates. No need to worry to prepare everything from scratch because Slidegeeks experts have already done a huge research and work for you. You need to download Guide To SEO Marketing Top SEO Kpis Along The Sales Funnel Slides PDF for your upcoming presentation. All the presentation templates are 100 percent editable and you can change the color and personalize the content accordingly. Download now.
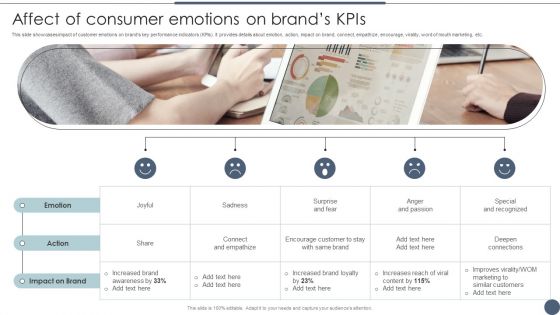
Affect Of Consumer Emotions On Brands Kpis Utilizing Emotional And Rational Branding For Improved Themes PDF
This slide showcases impact of customer emotions on brands key performance indicators KPIs. It provides details about emotion, action, impact on brand, connect, empathize, encourage, virality, word of mouth marketing, etc. Boost your pitch with our creative Affect Of Consumer Emotions On Brands Kpis Utilizing Emotional And Rational Branding For Improved Themes PDF. Deliver an awe-inspiring pitch that will mesmerize everyone. Using these presentation templates you will surely catch everyones attention. You can browse the ppts collection on our website. We have researchers who are experts at creating the right content for the templates. So you do not have to invest time in any additional work. Just grab the template now and use them.

Fitness Product Promotion Campaigns Sports Marketing Strategies Impact On Major Kpis Introduction PDF
This slide showcases major impact of sports marketing strategies on key performance indicators KPIs. It provides details about sponsored brand sales, return on investment ROI, customer base, merchandise, social media followers, etc. Retrieve professionally designed Fitness Product Promotion Campaigns Sports Marketing Strategies Impact On Major Kpis Introduction PDF to effectively convey your message and captivate your listeners. Save time by selecting pre-made slideshows that are appropriate for various topics, from business to educational purposes. These themes come in many different styles, from creative to corporate, and all of them are easily adjustable and can be edited quickly. Access them as PowerPoint templates or as Google Slides themes. You do not have to go on a hunt for the perfect presentation because Slidegeeks got you covered from everywhere.
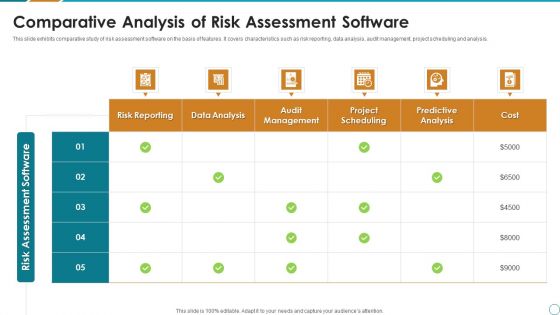
Comparative Analysis Of Risk Assessment Software Ppt PowerPoint Presentation File Inspiration PDF
This slide exhibits comparative study of risk assessment software on the basis of features. It covers characteristics such as risk reporting, data analysis, audit management, project scheduling and analysis. Pitch your topic with ease and precision using this Comparative Analysis Of Risk Assessment Software Ppt PowerPoint Presentation File Inspiration PDF. This layout presents information on Risk Reporting, Data Analysis, Audit Management, Project Scheduling. It is also available for immediate download and adjustment. So, changes can be made in the color, design, graphics or any other component to create a unique layout.
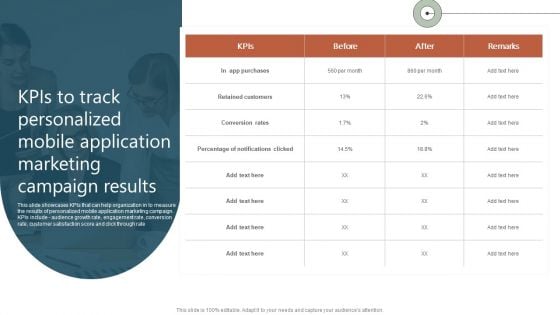
Kpis To Track Personalized Mobile Application Marketing Campaign Results Ppt Pictures Infographics PDF
This slide showcases KPIs that can help organization in measure the results of personalized mobile application marketing campaign. KPIs include audience growth rate, engagement rate, conversion rate, customer satisfaction score and click through rate. Present like a pro with Kpis To Track Personalized Mobile Application Marketing Campaign Results Ppt Pictures Infographics PDF Create beautiful presentations together with your team, using our easy to use presentation slides. Share your ideas in real time and make changes on the fly by downloading our templates. So whether you are in the office, on the go, or in a remote location, you can stay in sync with your team and present your ideas with confidence. With Slidegeeks presentation got a whole lot easier. Grab these presentations today.
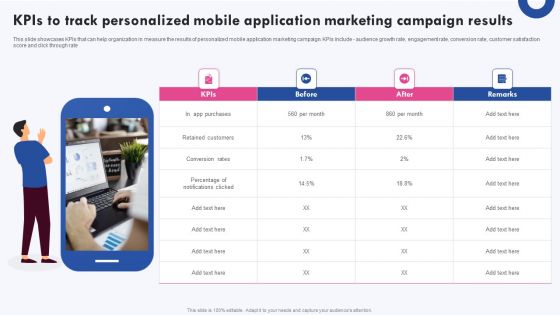
Targeted Marketing Campaigns To Improve Buyers Experience Kpis To Track Personalized Mobile Application Pictures PDF
This slide showcases KPIs that can help organization in measure the results of personalized mobile application marketing campaign. KPIs include audience growth rate, engagement rate, conversion rate, customer satisfaction score and click through rate Welcome to our selection of the Targeted Marketing Campaigns To Improve Buyers Experience Kpis To Track Personalized Mobile Application Pictures PDF. These are designed to help you showcase your creativity and bring your sphere to life. Planning and Innovation are essential for any business that is just starting out. This collection contains the designs that you need for your everyday presentations. All of our PowerPoints are 100 percent editable, so you can customize them to suit your needs. This multi purpose template can be used in various situations. Grab these presentation templates today.
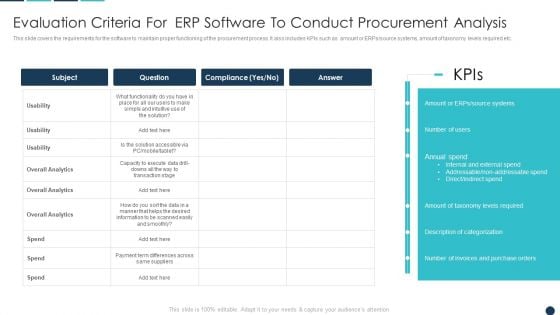
Evaluation Criteria For ERP Software To Conduct Procurement Analysis Information PDF
This slide covers the requirements for the software to maintain proper functioning of the procurement process. It also includes KPIs such as amount or ERPs or source systems, amount of taxonomy levels required etc.Deliver an awe inspiring pitch with this creative Evaluation Criteria For ERP Software To Conduct Procurement Analysis Information PDF bundle. Topics like Data Extraction, Reporting And Analysis, Categorization Enrichment can be discussed with this completely editable template. It is available for immediate download depending on the needs and requirements of the user.
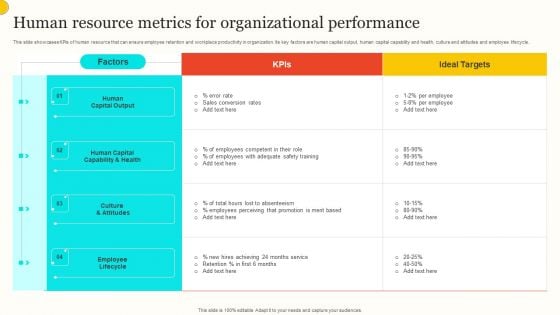
Human Resource Metrics For Organizational Performance Diagrams PDF
This slide showcases KPIs of human resource that can ensure employee retention and workplace productivity in organization. Its key factors are human capital output, human capital capability and health, culture and attitudes and employee lifecycle. Showcasing this set of slides titled Human Resource Metrics For Organizational Performance Diagrams PDF. The topics addressed in these templates are Human Capital Output, Human Capital Capability Health, Culture Attitudes. All the content presented in this PPT design is completely editable. Download it and make adjustments in color, background, font etc. as per your unique business setting.


 Continue with Email

 Home
Home


