Snapshot
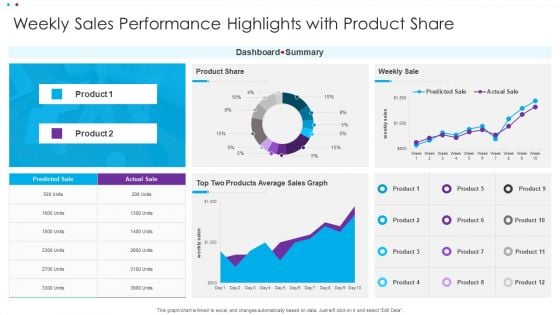
Weekly Sales Performance Highlights With Product Share Ppt File Information PDF
This graph or chart is linked to excel, and changes automatically based on data. Just left click on it and select Edit Data. Pitch your topic with ease and precision using this Weekly Sales Performance Highlights With Product Share Ppt File Information PDF. This layout presents information on Dashboard Summary, Weekly Sale, Product Share. It is also available for immediate download and adjustment. So, changes can be made in the color, design, graphics or any other component to create a unique layout.
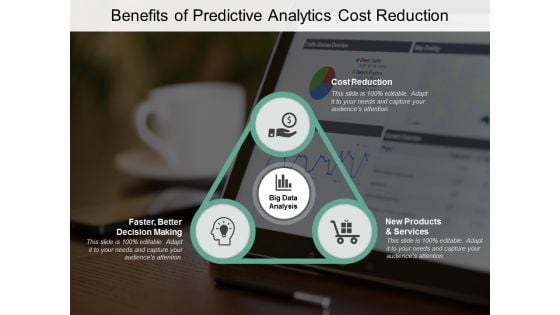
Benefits Of Predictive Analytics Cost Reduction Ppt PowerPoint Presentation Styles Sample
Presenting this set of slides with name benefits of predictive analytics cost reduction ppt powerpoint presentation styles sample. This is a three stage process. The stages in this process are big data analysis, data management, technologies segmentation. This is a completely editable PowerPoint presentation and is available for immediate download. Download now and impress your audience.
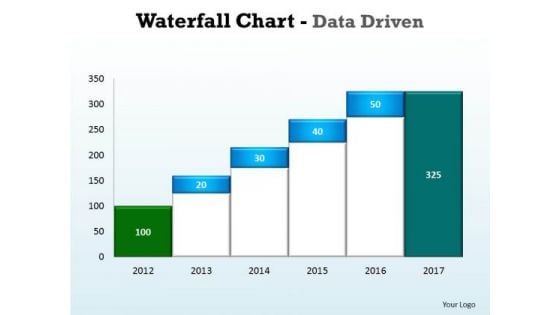
Business Graphic PowerPoint Templates Business Waterfall Chart Data Driven Ppt Slides
Business Graphic PowerPoint Templates Business waterfall chart data driven PPT Slides- This Water Fall chart can display continuous data over time, set against a common scale, and are therefore ideal for showing trends in data at equal intervals-This ppt can be used for concepts relating to-chart,, graph, growth, investment, , market, percentage, , presentation report, results, statistics, stock, success and business. Expose your team to a brave new world. Challenge preset boundaries with our Business Graphic PowerPoint Templates Business Waterfall Chart Data Driven Ppt Slides.
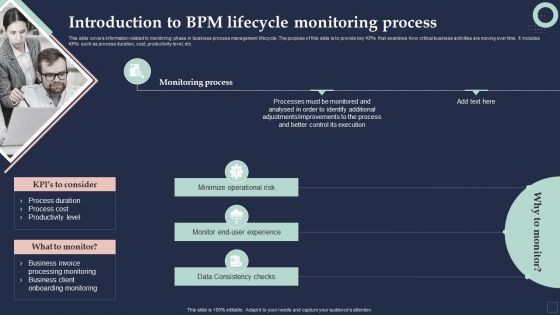
BPM System Methodology Introduction To BPM Lifecycle Monitoring Process Graphics PDF
This slide covers information related to monitoring phase in business process management lifecycle. The purpose of this slide is to provide key KPIs that examines how critical business activities are moving over time. It includes KPIs such as process duration, cost, productivity level, etc. Retrieve professionally designed BPM System Methodology Introduction To BPM Lifecycle Monitoring Process Graphics PDF to effectively convey your message and captivate your listeners. Save time by selecting pre-made slideshows that are appropriate for various topics, from business to educational purposes. These themes come in many different styles, from creative to corporate, and all of them are easily adjustable and can be edited quickly. Access them as PowerPoint templates or as Google Slides themes. You dont have to go on a hunt for the perfect presentation because Slidegeeks got you covered from everywhere.

Assessment And Market Position Of Competitors Product Product Range Ppt PowerPoint Presentation Pictures Design Ideas
This is a assessment and market position of competitors product product range ppt powerpoint presentation pictures design ideas. This is a five stage process. The stages in this process are design, price, performance, quality, additional functions.
Assessment And Market Position Of Competitors Product Product Range Ppt PowerPoint Presentation Pictures Icons
This is a assessment and market position of competitors product product range ppt powerpoint presentation pictures icons. This is a four stage process. The stages in this process are design, price, performance, quality, additional functions.
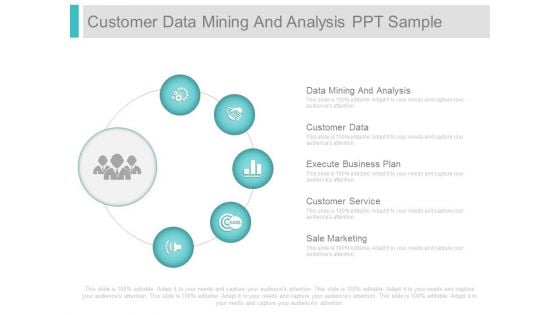
Customer Data Mining And Analysis Ppt Sample
This is a customer data mining and analysis ppt sample. This is a five stage process. The stages in this process are data mining and analysis, customer data, execute business plan, customer service, sale marketing.
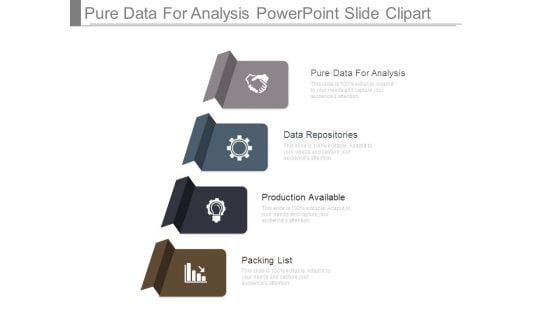
Pure Data For Analysis Powerpoint Slide Clipart
This is a pure data for analysis powerpoint slide clipart. This is a four stage process. The stages in this process are pure data for analysis, data repositories, production available, packing list.
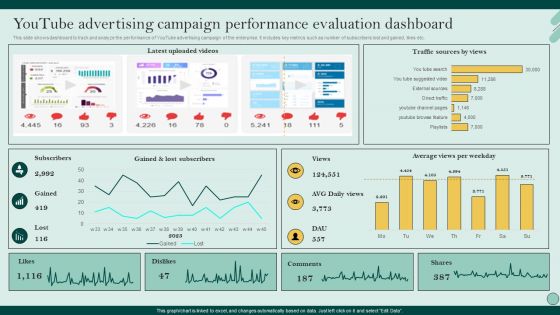
Social Networks Marketing To Improve Youtube Advertising Campaign Performance Microsoft PDF
This slide shows dashboard to track and analyze the performance of YouTube advertising campaign of the enterprise. It includes key metrics such as number of subscribers lost and gained, likes etc. Create an editable Social Networks Marketing To Improve Youtube Advertising Campaign Performance Microsoft PDF that communicates your idea and engages your audience. Whether youre presenting a business or an educational presentation, pre-designed presentation templates help save time. Social Networks Marketing To Improve Youtube Advertising Campaign Performance Microsoft PDF is highly customizable and very easy to edit, covering many different styles from creative to business presentations. Slidegeeks has creative team members who have crafted amazing templates. So, go and get them without any delay.
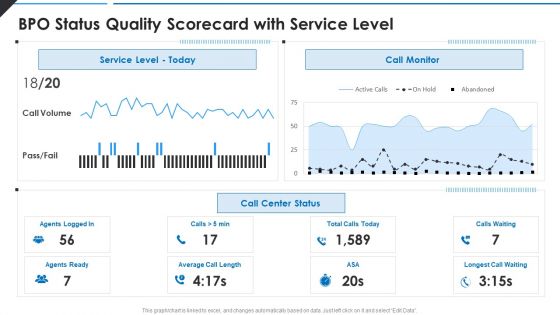
BPO Status Quality Scorecard With Service Level Pictures PDF
Deliver and pitch your topic in the best possible manner with this BPO Status Quality Scorecard With Service Level Pictures PDF Use them to share invaluable insights on Service Level, Call Monitor, Call Center and impress your audience. This template can be altered and modified as per your expectations. So, grab it now.
9 Principles of Design You Must Master for Perfect Slide Compositions
This slide covers the KPI dashboard for evaluating inbound lead performance. It includes metrics such as lead to opportunity ratio, opportunity to win ratio, lead conversion ratio, inbound leads, and leads in the sales funnel. Boost your pitch with our creative Optimizing Consumer Lead Nurturing Procedure Inbound Lead Performance Tracking Dashboard Summary PDF. Deliver an awe-inspiring pitch that will mesmerize everyone. Using these presentation templates you will surely catch everyones attention. You can browse the ppts collection on our website. We have researchers who are experts at creating the right content for the templates. So you do not have to invest time in any additional work. Just grab the template now and use them.
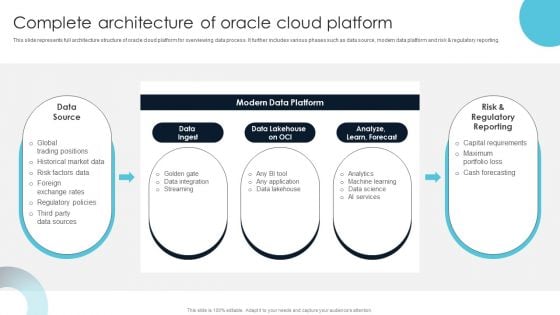
Complete Architecture Of Oracle Cloud Platform Information PDF
This slide represents full architecture structure of oracle cloud platform for overviewing data process. It further includes various phases such as data source, modern data platform and risk and regulatory reporting. Slidegeeks is here to make your presentations a breeze with Complete Architecture Of Oracle Cloud Platform Information PDF With our easy-to-use and customizable templates, you can focus on delivering your ideas rather than worrying about formatting. With a variety of designs to choose from, you are sure to find one that suits your needs. And with animations and unique photos, illustrations, and fonts, you can make your presentation pop. So whether you are giving a sales pitch or presenting to the board, make sure to check out Slidegeeks first
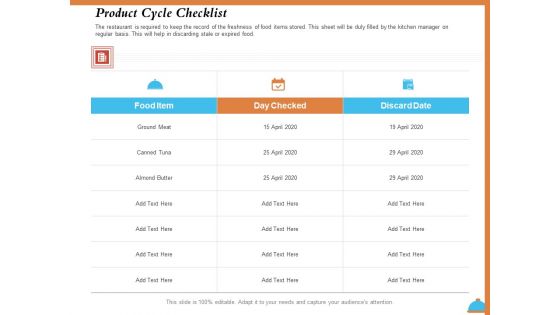
Improving Restaurant Operations Product Cycle Checklist Ppt PowerPoint Presentation Model Example PDF
Presenting this set of slides with name improving restaurant operations product cycle checklist ppt powerpoint presentation model example pdf. The topics discussed in these slides are food item, day checked, discard date, ground meat, canned tuna, almond butter. This is a completely editable PowerPoint presentation and is available for immediate download. Download now and impress your audience.
Icons Slide For Machine Learning Development And Operations Cycle IT Introduction PDF
Introducing our well designed icons slide for machine learning development and operations cycle it introduction pdf set of slides. The slide displays editable icons to enhance your visual presentation. The icons can be edited easily. So customize according to your business to achieve a creative edge. Download and share it with your audience.

Machine Learning Development And Operations Cycle IT Different Pipelines For Software Mockup PDF
Deliver and pitch your topic in the best possible manner with this machine learning development and operations cycle it different pipelines for software mockup pdf Use them to share invaluable insights on feature engineering, model experiment, model development and impress your audience. This template can be altered and modified as per your expectations. So, grab it now.
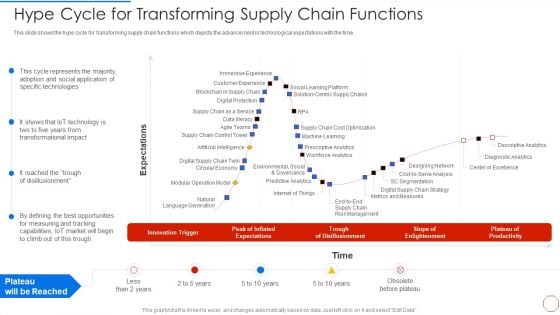
Minimizing Operational Cost Through Iot Virtual Twins Implementation Hype Cycle For Transforming Diagrams PDF
Deliver and pitch your topic in the best possible manner with this minimizing operational cost through iot virtual twins implementation hype cycle for transforming diagrams pdf. Use them to share invaluable insights on workforce analytics, prescriptive analytics, cost, optimization, supply and impress your audience. This template can be altered and modified as per your expectations. So, grab it now.
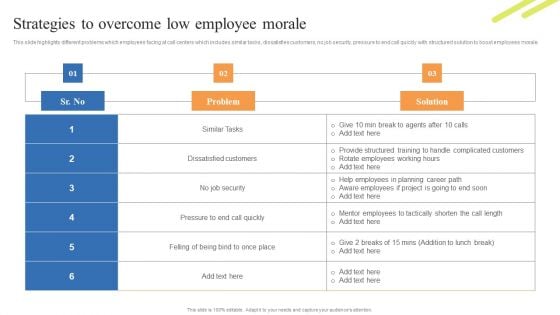
Customer Support Center Strategies To Overcome Low Employee Morale Background PDF
This slide highlights different problems which employees facing at call centers which includes similar tasks, dissatisfies customers, no job security, pressure to end call quickly with structured solution to boost employees morale. This Customer Support Center Strategies To Overcome Low Employee Morale Background PDF is perfect for any presentation, be it in front of clients or colleagues. It is a versatile and stylish solution for organizing your meetings. The Customer Support Center Strategies To Overcome Low Employee Morale Background PDF features a modern design for your presentation meetings. The adjustable and customizable slides provide unlimited possibilities for acing up your presentation. Slidegeeks has done all the homework before launching the product for you. So, dont wait, grab the presentation templates today.
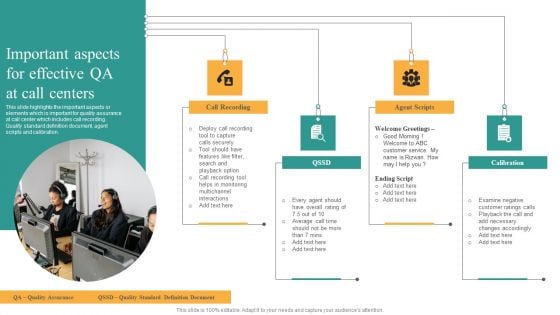
Comprehensive Guide For Enhancing Performance Of Customer Service Center Important Aspects For Effective Mockup PDF
This slide highlights the important aspects or elements which is important for quality assurance at call center which includes call recording. Quality standard definition document, agent scripts and calibration. Get a simple yet stunning designed Comprehensive Guide For Enhancing Performance Of Customer Service Center Important Aspects For Effective Mockup PDF. It is the best one to establish the tone in your meetings. It is an excellent way to make your presentations highly effective. So, download this PPT today from Slidegeeks and see the positive impacts. Our easy to edit Comprehensive Guide For Enhancing Performance Of Customer Service Center Important Aspects For Effective Mockup PDF can be your go to option for all upcoming conferences and meetings. So, what are you waiting for Grab this template today.
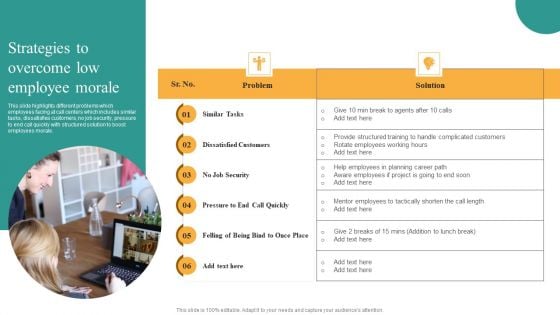
Comprehensive Guide For Enhancing Performance Of Customer Service Center Strategies To Overcome Graphics PDF
This slide highlights different problems which employees facing at call centers which includes similar tasks, dissatisfies customers, no job security, pressure to end call quickly with structured solution to boost employees morale. Do you have an important presentation coming up Are you looking for something that will make your presentation stand out from the rest Look no further than Comprehensive Guide For Enhancing Performance Of Customer Service Center Strategies To Overcome Graphics PDF. With our professional designs, you can trust that your presentation will pop and make delivering it a smooth process. And with Slidegeeks, you can trust that your presentation will be unique and memorable. So why wait Grab Comprehensive Guide For Enhancing Performance Of Customer Service Center Strategies To Overcome Graphics PDF today and make your presentation stand out from the rest.
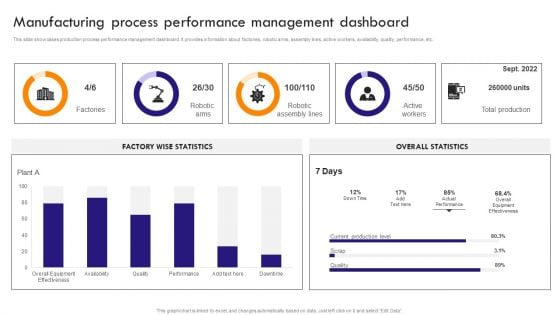
Implementing Robotic Process Manufacturing Process Performance Management Sample PDF
This slide showcases production process performance management dashboard. It provides information about factories, robotic arms, assembly lines, active workers, availability, quality, performance, etc. The Implementing Robotic Process Manufacturing Process Performance Management Sample PDF is a compilation of the most recent design trends as a series of slides. It is suitable for any subject or industry presentation, containing attractive visuals and photo spots for businesses to clearly express their messages. This template contains a variety of slides for the user to input data, such as structures to contrast two elements, bullet points, and slides for written information. Slidegeeks is prepared to create an impression.
Develop Campaign Performance Tracking Framework Elements PDF
The following slide depicts campaign performance management dashboard to measure the results. It includes elements such as conversions funnel, conversion rates, opportunity value, landing pages, sources google, twitter, Facebook etc. The Develop Campaign Performance Tracking Framework Elements PDF is a compilation of the most recent design trends as a series of slides. It is suitable for any subject or industry presentation, containing attractive visuals and photo spots for businesses to clearly express their messages. This template contains a variety of slides for the user to input data, such as structures to contrast two elements, bullet points, and slides for written information. Slidegeeks is prepared to create an impression.
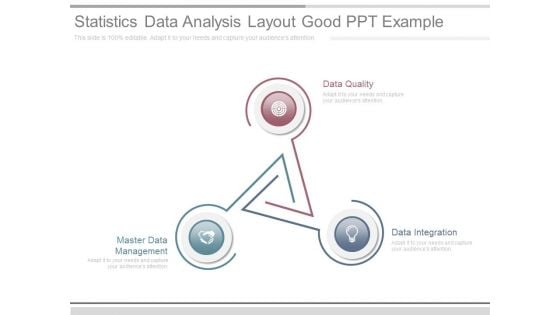
Statistics Data Analysis Layout Good Ppt Example
This is a statistics data analysis layout good ppt example. This is a three stage process. The stages in this process are data quality, data integration, master data management.
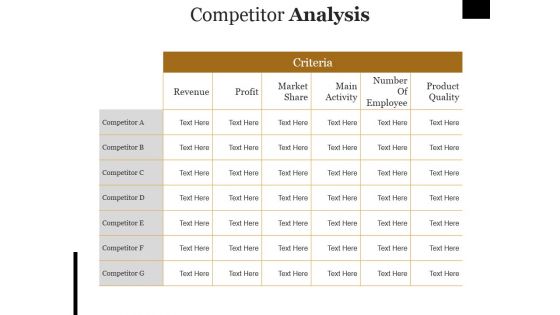
Competitor Analysis Ppt PowerPoint Presentation Outline Rules
This is a competitor analysis ppt powerpoint presentation outline rules. This is a seven stage process. The stages in this process are revenue, profit, market share, main activity, number of employee.
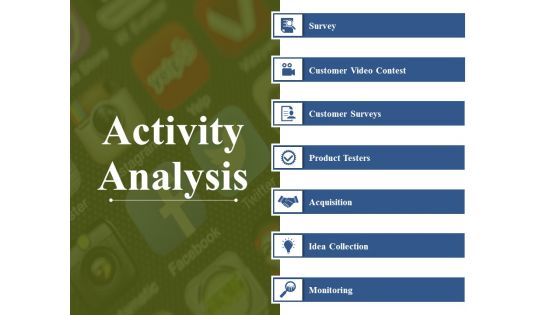
Activity Analysis Ppt PowerPoint Presentation Styles Elements
This is a activity analysis ppt powerpoint presentation styles elements. This is a seven stage process. The stages in this process are survey, customer video contest, customer surveys, product testers, acquisition.
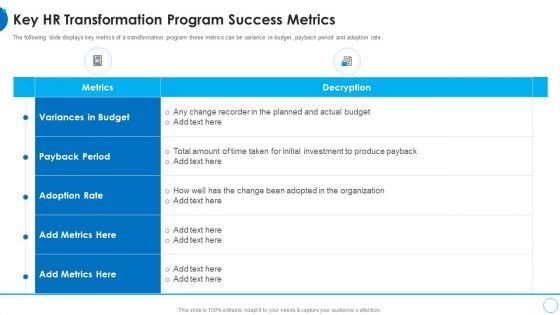
Key HR Transformation Program Success Metrics HR Change Management Tools Structure PDF
The following slide displays key metrics of a transformation program these metrics can be variance in budget, payback period and adoption rate. Deliver an awe inspiring pitch with this creative key hr transformation program success metrics hr change management tools structure pdf bundle. Topics like metrics, budget, planned, investment can be discussed with this completely editable template. It is available for immediate download depending on the needs and requirements of the user.
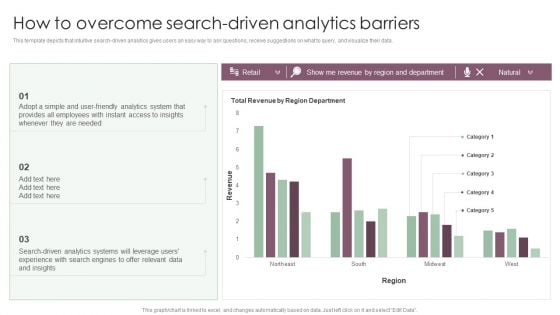
Information Analysis And BI Playbook How To Overcome Search Driven Analytics Barriers Formats PDF
This template depicts that intuitive search driven analytics gives users an easy way to ask questions, receive suggestions on what to query, and visualize their data. Coming up with a presentation necessitates that the majority of the effort goes into the content and the message you intend to convey. The visuals of a PowerPoint presentation can only be effective if it supplements and supports the story that is being told. Keeping this in mind our experts created Information Analysis And BI Playbook How To Overcome Search Driven Analytics Barriers Formats PDF to reduce the time that goes into designing the presentation. This way, you can concentrate on the message while our designers take care of providing you with the right template for the situation.
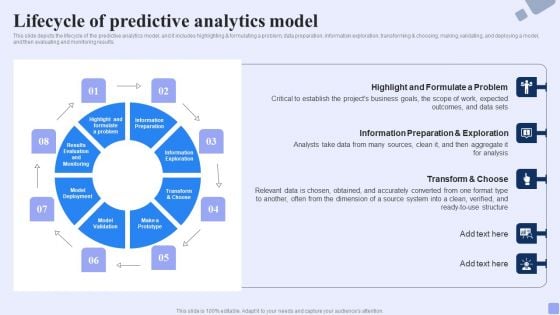
Lifecycle Of Predictive Analytics Model Forward Looking Analysis IT Designs PDF
This slide depicts the lifecycle of the predictive analytics model, and it includes highlighting formulating a problem, data preparation, information exploration, transforming and choosing, making, validating, and deploying a model, and then evaluating and monitoring results.Present like a pro with Lifecycle Of Predictive Analytics Model Forward Looking Analysis IT Designs PDF Create beautiful presentations together with your team, using our easy-to-use presentation slides. Share your ideas in real-time and make changes on the fly by downloading our templates. So whether you are in the office, on the go, or in a remote location, you can stay in sync with your team and present your ideas with confidence. With Slidegeeks presentation got a whole lot easier. Grab these presentations today.
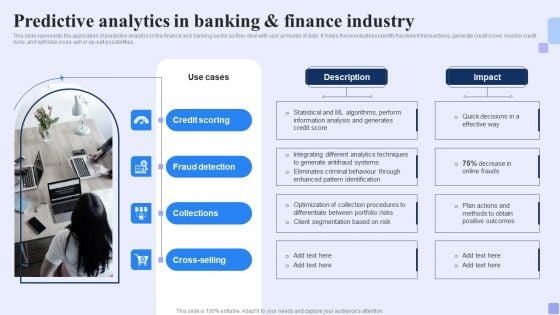
Predictive Analytics In Banking And Finance Industry Forward Looking Analysis IT Diagrams PDF
This slide represents the application of predictive analytics in the finance and banking sector as they deal with vast amounts of data. It helps these industries identify fraudulent transactions, generate credit score, monitor credit risks, and optimize cross-sell or up-sell possibilities.Coming up with a presentation necessitates that the majority of the effort goes into the content and the message you intend to convey. The visuals of a PowerPoint presentation can only be effective if it supplements and supports the story that is being told. Keeping this in mind our experts created Predictive Analytics In Banking And Finance Industry Forward Looking Analysis IT Diagrams PDF to reduce the time that goes into designing the presentation. This way, you can concentrate on the message while our designers take care of providing you with the right template for the situation.
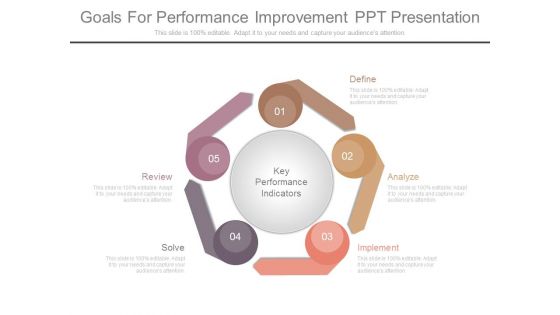
Goals For Performance Improvement Ppt Presentation
This is a goals for performance improvement ppt presentation. This is a five stage process. The stages in this process are key performance indicators, define, analyze, implement, solve, review.
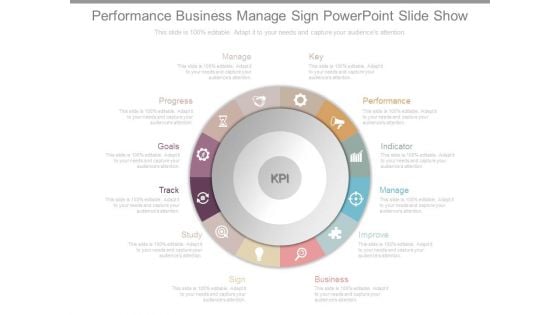
Performance Business Manage Sign Powerpoint Slide Show
This is a performance business manage sign powerpoint slide show. This is a twelve stage process. The stages in this process are key, performance, indicator, manage, improve, business, sign, study, track, goals, progress, manage, kpi.
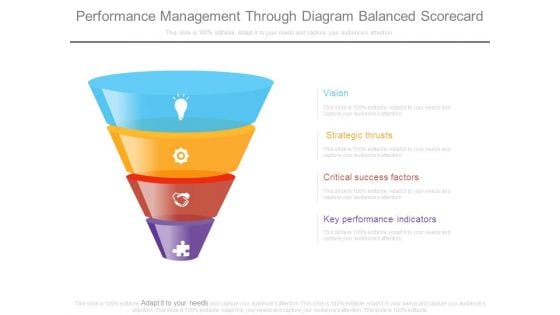
Performance Management Through Diagram Balanced Scorecard
This is a performance management through diagram balanced scorecard. This is a four stage process. The stages in this process are vision, strategic thrusts, critical success factors, key performance indicators.
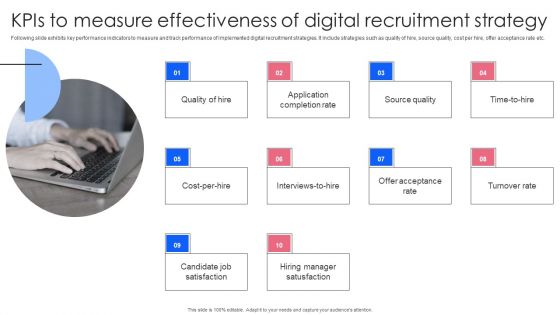
Effective Guide To Build Strong Online Hiring Strategy Kpis To Measure Effectiveness Of Digital Recruitment Introduction PDF
Following slide exhibits key performance indicators to measure and track performance of implemented digital recruitment strategies. It include strategies such as quality of hire, source quality, cost per hire, offer acceptance rate etc. Slidegeeks is one of the best resources for PowerPoint templates. You can download easily and regulate Effective Guide To Build Strong Online Hiring Strategy Kpis To Measure Effectiveness Of Digital Recruitment Introduction PDF for your personal presentations from our wonderful collection. A few clicks is all it takes to discover and get the most relevant and appropriate templates. Use our Templates to add a unique zing and appeal to your presentation and meetings. All the slides are easy to edit and you can use them even for advertisement purposes.
Performance Measurement And Tracking For Sales Incentive Strategy Introduction Pdf
The following slide highlights points like role specific sales incentives, split sales, presales, omnichannel and analytics based incentives to show multiple types of sales incentive plan. It helps organizations to tailor incentive structures to align with specific roles, drive desired sales behaviors, and optimize sales performance across various channels.Pitch your topic with ease and precision using this Performance Measurement And Tracking For Sales Incentive Strategy Introduction Pdf This layout presents information on Performance Reviews, Implement Regular, Reporting Tools It is also available for immediate download and adjustment. So, changes can be made in the color, design, graphics or any other component to create a unique layout. The following slide highlights points like establish metrics, implement performance review, utilize data, reporting tools and culture of accountability to show performance measurement and tracking for sales incentive plan. It helps organizations to optimize performance management, enhance decision making, and drive sales excellence.

Risk Mitigation Strategies For Customer Service Ppt PowerPoint Presentation Pictures Slides
This is a risk mitigation strategies for customer service ppt powerpoint presentation pictures slides. This is a six stage process. The stages in this process are recognize an unhappy customer, keep customers in the loop, empower employees to make nice gestures, take action, grease the squeaky wheels.
Neuromarketing Strategy Icon To Determine Target Audience Preference Ppt Pictures Portrait PDF
Presenting Neuromarketing Strategy Icon To Determine Target Audience Preference Ppt Pictures Portrait PDF to dispense important information. This template comprises three stages. It also presents valuable insights into the topics including Neuromarketing Strategy, Icon To Determine, Target Audience Preference. This is a completely customizable PowerPoint theme that can be put to use immediately. So, download it and address the topic impactfully.
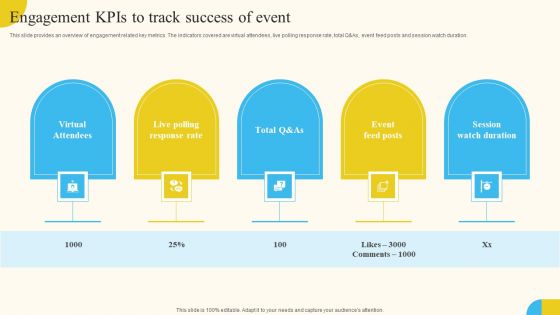
Engagement KPIS To Track Success Of Event Activities For Successful Launch Event Rules PDF
This slide provides an overview of engagement related key metrics. The indicators covered are virtual attendees, live polling response rate, total Q and As, event feed posts and session watch duration. Presenting this PowerPoint presentation, titled Engagement KPIS To Track Success Of Event Activities For Successful Launch Event Rules PDF, with topics curated by our researchers after extensive research. This editable presentation is available for immediate download and provides attractive features when used. Download now and captivate your audience. Presenting this Engagement KPIS To Track Success Of Event Activities For Successful Launch Event Rules PDF. Our researchers have carefully researched and created these slides with all aspects taken into consideration. This is a completely customizable Engagement KPIS To Track Success Of Event Activities For Successful Launch Event Rules PDF that is available for immediate downloading. Download now and make an impact on your audience. Highlight the attractive features available with our PPTs.

Data Analysis Business PowerPoint Template 0910
binary data under a magnifying lens. digital illustration. Spread it out in equal doses. Get the portions right with our Data Analysis Business PowerPoint Template 0910.
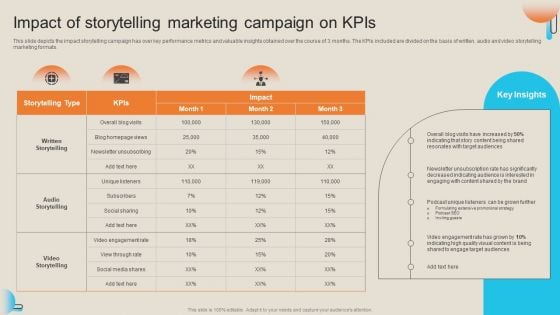
Comprehensive Guide For Storytelling Promotion Impact Of Storytelling Marketing Campaign On Kpis Introduction PDF
This slide depicts the impact storytelling campaign has over key performance metrics and valuable insights obtained over the course of 3 months. The KPIs included are divided on the basis of written, audio and video storytelling marketing formats. Coming up with a presentation necessitates that the majority of the effort goes into the content and the message you intend to convey. The visuals of a PowerPoint presentation can only be effective if it supplements and supports the story that is being told. Keeping this in mind our experts created v to reduce the time that goes into designing the presentation. This way, you can concentrate on the message while our designers take care of providing you with the right template for the situation.
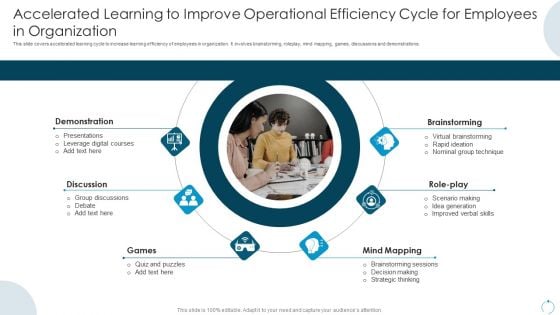
Accelerated Learning To Improve Operational Efficiency Cycle For Employees In Organization Introduction PDF
This slide covers accelerated learning cycle to increase learning efficiency of employees in organization. It involves brainstorming, roleplay, mind mapping, games, discussions and demonstrations. Persuade your audience using this Accelerated Learning To Improve Operational Efficiency Cycle For Employees In Organization Introduction PDF. This PPT design covers six stages, thus making it a great tool to use. It also caters to a variety of topics including Demonstration, Discussion, Games, Mind Mapping. Download this PPT design now to present a convincing pitch that not only emphasizes the topic but also showcases your presentation skills.
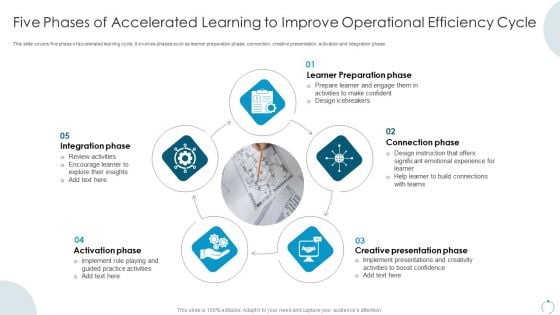
Five Phases Of Accelerated Learning To Improve Operational Efficiency Cycle Microsoft PDF
This slide covers five phase of accelerated learning cycle. It involves phases such as learner preparation phase, connection, creative presentation, activation and integration phase. Presenting Five Phases Of Accelerated Learning To Improve Operational Efficiency Cycle Microsoft PDF to dispense important information. This template comprises five stages. It also presents valuable insights into the topics including Learner Preparation Phase, Connection Phase, Creative Presentation Phase. This is a completely customizable PowerPoint theme that can be put to use immediately. So, download it and address the topic impactfully.
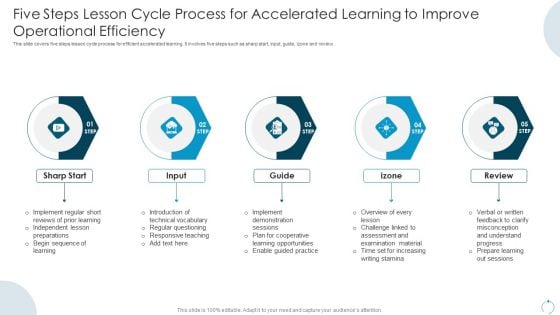
Five Steps Lesson Cycle Process For Accelerated Learning To Improve Operational Efficiency Professional PDF
This slide covers five steps lesson cycle process for efficient accelerated learning. It involves five steps such as sharp start, input, guide, izone and review. Persuade your audience using this Five Steps Lesson Cycle Process For Accelerated Learning To Improve Operational Efficiency Professional PDF. This PPT design covers five stages, thus making it a great tool to use. It also caters to a variety of topics including Sharp Start, Input, Guide, Review. Download this PPT design now to present a convincing pitch that not only emphasizes the topic but also showcases your presentation skills.
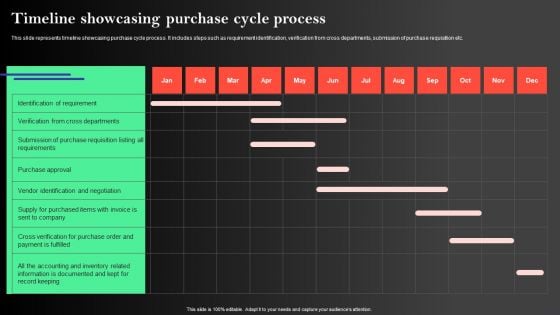
Manufacturing Operations Management Process Timeline Showcasing Purchase Cycle Process Microsoft PDF
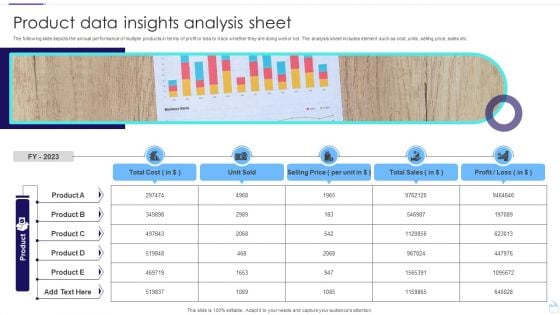
Product Data Insights Analysis Sheet Infographics PDF
The following slide depicts the annual performance of multiple products in terms of profit or loss to track whether they are doing well or not. The analysis sheet includes element such as cost, units, selling price, sales etc. Pitch your topic with ease and precision using this Product Data Insights Analysis Sheet Infographics PDF. This layout presents information on Unit Sold, Selling Price, Total Sales. It is also available for immediate download and adjustment. So, changes can be made in the color, design, graphics or any other component to create a unique layout.
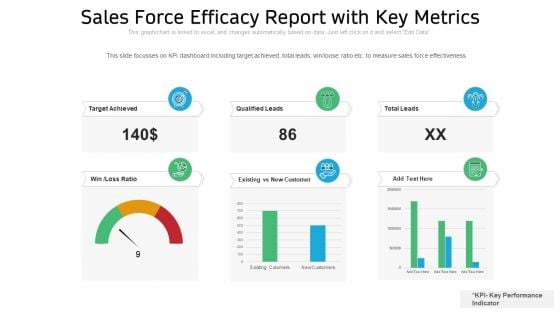
Sales Force Efficacy Report With Key Metrics Ppt PowerPoint Presentation File Summary PDF
Showcasing this set of slides titled sales force efficacy report with key metrics ppt powerpoint presentation file summary pdf. The topics addressed in these templates are sales force efficacy report with key metrics All the content presented in this PPT design is completely editable. Download it and make adjustments in color, background, font etc. as per your unique business setting.
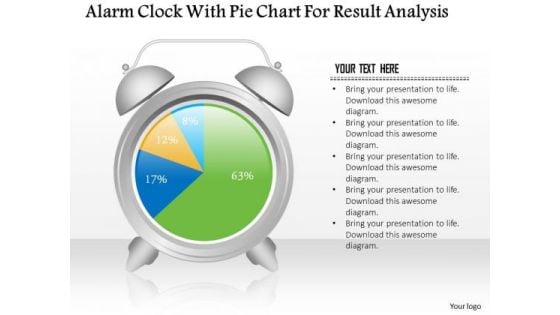
Business Diagram Alarm Clock With Pie Chart For Result Analysis PowerPoint Slide
This business slide displays alarm clock with pie chart. This diagram is a data visualization tool that gives you a simple way to present statistical information. This slide helps your audience examine and interpret the data you present.
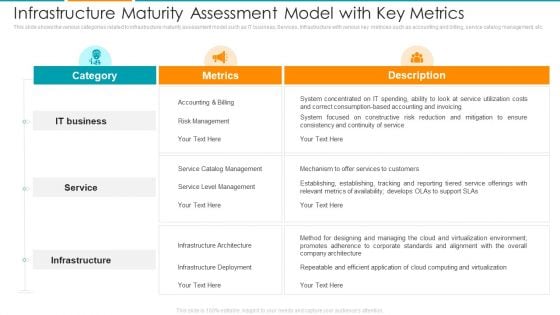
Infrastructure Maturity Assessment Model With Key Metrics Ppt Inspiration Slides PDF
This slide shows the various categories related to infrastructure maturity assessment model such as IT business, Services, Infrastructure with various key metrices such as accounting and billing, service catalog management, etc. Deliver an awe-inspiring pitch with this creative infrastructure maturity assessment model with key metrics ppt inspiration slides pdf bundle. Topics like infrastructure, service, it business can be discussed with this completely editable template. It is available for immediate download depending on the needs and requirements of the user.
Analytics Solutions Diagram Sample Of Ppt Presentation
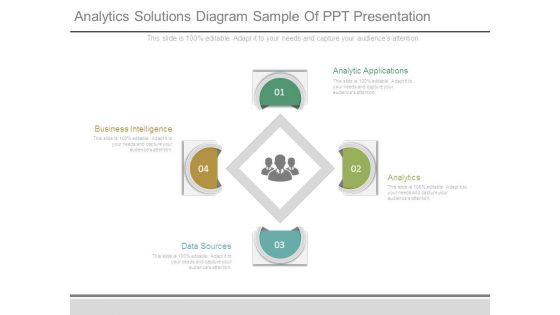
This is a analytics solutions diagram sample of ppt presentation. This is a four stage process. The stages in this process are analytic applications, analytics, data sources, business intelligence.
Grubhub Fund Raising Elevator Consistent Growth In Key Metrics Diagrams PDF
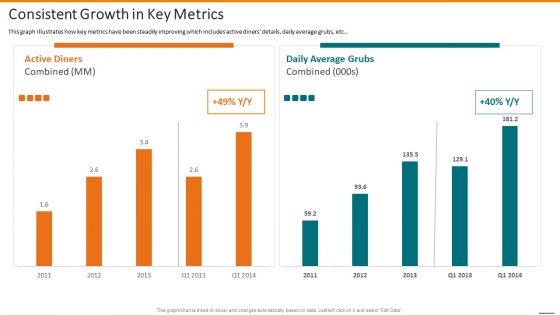
This graph illustrates how key metrics have been steadily improving which includes active diners details, daily average grubs, etc. Deliver and pitch your topic in the best possible manner with this grubhub fund raising elevator consistent growth in key metrics diagrams pdf. Use them to share invaluable insights on consistent growth in key metrics and impress your audience. This template can be altered and modified as per your expectations. So, grab it now.
Financial Transformation Key Success Metrics Assessment Digital Transformation Toolkit Accounting Finance Introduction PDF
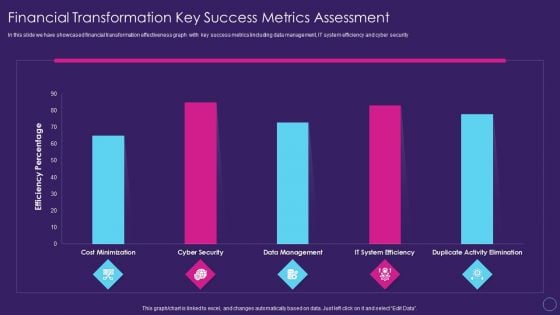
In this slide we have showcased financial transformation effectiveness graph with key success metrics lincluding data management, IT system efficiency and cyber security Deliver an awe inspiring pitch with this creative financial transformation key success metrics assessment digital transformation toolkit accounting finance introduction pdf bundle. Topics like financial transformation key success metrics assessment can be discussed with this completely editable template. It is available for immediate download depending on the needs and requirements of the user.
Checklist To Implement Concurrent Computing In Company Ppt Pictures Example PDF
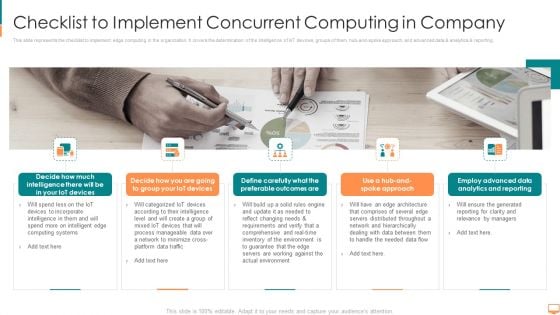
This slide represents the checklist to implement edge computing in the organization. It covers the determination of the intelligence of IoT devices, groups of them, hub-and-spoke approach, and advanced data and analytics and reporting. Presenting checklist to implement concurrent computing in company ppt pictures example pdf to provide visual cues and insights. Share and navigate important information on five stages that need your due attention. This template can be used to pitch topics like requirements, comprehensive, inventory, guarantee, manageable. In addtion, this PPT design contains high resolution images, graphics, etc, that are easily editable and available for immediate download.
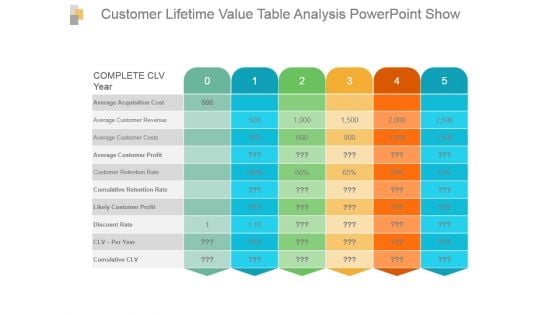
Customer Lifetime Value Table Analysis Powerpoint Show
This is a customer lifetime value table analysis powerpoint show. This is a five stage process. The stages in this process are complete clv year, average acquisition cost, average customer revenue, average customer costs, average customer profit, customer retention rate, cumulative retention rate, likely customer profit, discount rate.
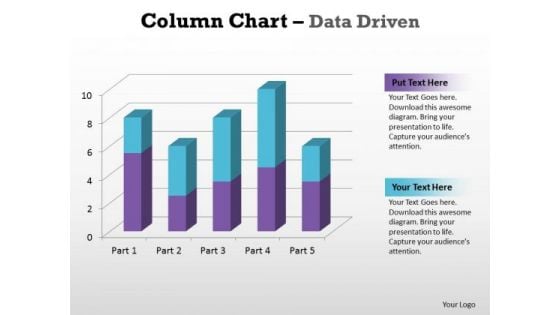
Business Graphic PowerPoint Templates Business Column Chart Data Driven Ppt Slides
Business Graphic PowerPoint Templates Business column chart data driven PPT Slides-With help of visual aids like this template you can capture the attention of the audience and make the presentation very interactive and lively.-Business Graphic PowerPoint Templates Business column chart data driven PPT Slides-This ppt can be used for concepts relating to-chart,, graph, growth, investment, , market, percentage, , presentation report, results, statistics, stock, success and business. Attain stardom with our Business Graphic PowerPoint Templates Business Column Chart Data Driven Ppt Slides. You will come out on top.
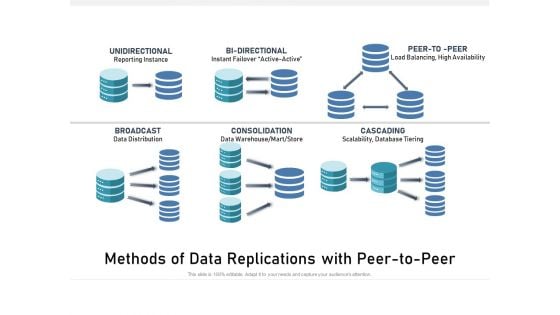
Methods Of Data Replications With Peer To Peer Ppt PowerPoint Presentation Model Graphic Images PDF
Presenting methods of data replications with peer to peer ppt powerpoint presentation model graphic images pdf. to dispense important information. This template comprises six stages. It also presents valuable insights into the topics including unidirectional, reporting instance, bi directional, instant failover active active, peer to peer, load balancing, high availability, broadcast, data distribution, consolidation, data warehouse mart store, cascading, scalability, database tiering. This is a completely customizable PowerPoint theme that can be put to use immediately. So, download it and address the topic impactfully.
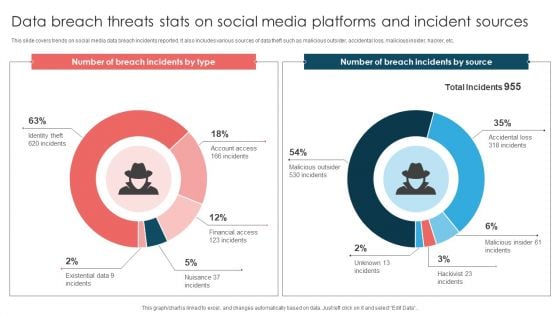
Data Breach Threats Stats On Social Media Platforms And Incident Sources Introduction PDF
This slide covers trends on social media data breach incidents reported. It also includes various sources of data theft such as malicious outsider, accidental loss, malicious insider, hacker, etc. Pitch your topic with ease and precision using this Data Breach Threats Stats On Social Media Platforms And Incident Sources Introduction PDF. This layout presents information on Number Breach, Total Incidents, Malicious Insider. It is also available for immediate download and adjustment. So, changes can be made in the color, design, graphics or any other component to create a unique layout.

Key Succession And Career Planning Metrics Ppt PowerPoint Presentation Slides Structure
This is a key succession and career planning metrics ppt powerpoint presentation slides structure. This is a six stage process. The stages in this process are marketing, business, management, planning, strategy.
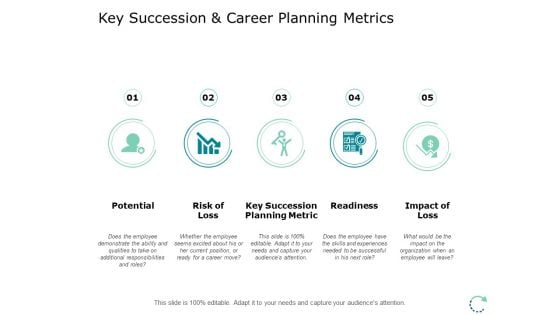
Key Succession And Career Planning Metrics Ppt PowerPoint Presentation Portfolio Portrait
This is a key succession and career planning metrics ppt powerpoint presentation portfolio portrait. This is a five stage process. The stages in this process are marketing, business, management, planning, strategy.
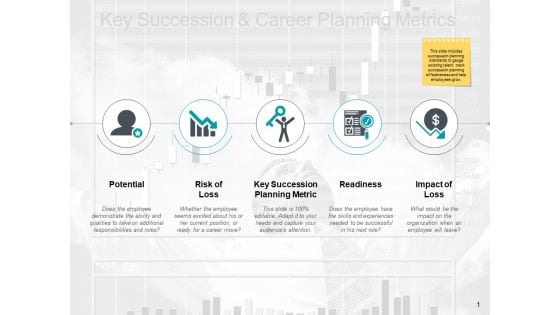
Key Succession And Career Planning Metrics Ppt PowerPoint Presentation File Graphics Design
This is a key succession and career planning metrics ppt powerpoint presentation file graphics design. This is a two stage process. The stages in this process are marketing, business, management, planning, strategy.

IAAS Framework IT Infrastructure As A Service Iaas Ppt Professional Graphics Pictures PDF
This slide represents the infrastructure as a service model of the cloud computing service and how it helps organizations outsource their IT resources to execute their programs and applications without maintaining IT infrastructures. Crafting an eye-catching presentation has never been more straightforward. Let your presentation shine with this tasteful yet straightforward IAAS Framework IT Infrastructure As A Service Iaas Ppt Professional Graphics Pictures PDF template. It offers a minimalistic and classy look that is great for making a statement. The colors have been employed intelligently to add a bit of playfulness while still remaining professional. Construct the ideal IAAS Framework IT Infrastructure As A Service Iaas Ppt Professional Graphics Pictures PDF that effortlessly grabs the attention of your audience Begin now and be certain to wow your customers.
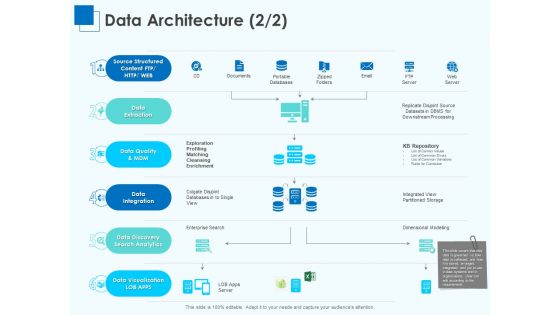
Corporate Intelligence Business Analysis Data Architecture Server Ppt Pictures Ideas PDF
Deliver an awe-inspiring pitch with this creative corporate intelligence business analysis data architecture server ppt pictures ideas pdf bundle. Topics like data sources, data warehouse servers, data movement, streaming engines can be discussed with this completely editable template. It is available for immediate download depending on the needs and requirements of the user.

Big Data Cycle For Analysis Diagram Slides
This is a big data cycle for analysis diagram slides. This is a five stage process. The stages in this process are massive data, new management needs, new final result, new hard and software, new analysis possibilities.


 Continue with Email

 Home
Home


