Software Icon

Analysing Operational Tasks Status Summary Objectives And Key Result Methodology For Business
The following slide showcases the business performance status summary to effectively measure results and outcomes. It includes elements such as task status, priority, planned and actual budget, pending tasks, decisions, actions and change requests etc. Create an editable Analysing Operational Tasks Status Summary Objectives And Key Result Methodology For Business that communicates your idea and engages your audience. Whether you are presenting a business or an educational presentation, pre-designed presentation templates help save time. Analysing Operational Tasks Status Summary Objectives And Key Result Methodology For Business is highly customizable and very easy to edit, covering many different styles from creative to business presentations. Slidegeeks has creative team members who have crafted amazing templates. So, go and get them without any delay. The following slide showcases the business performance status summary to effectively measure results and outcomes. It includes elements such as task status, priority, planned and actual budget, pending tasks, decisions, actions and change requests etc.
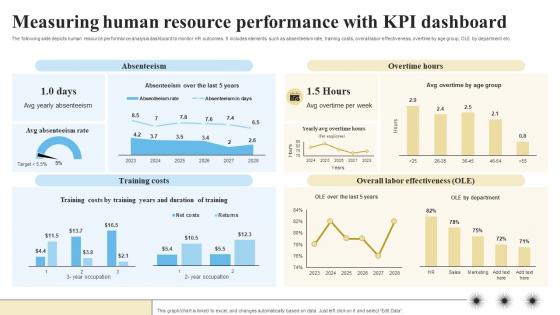
Measuring Human Resource Performance Objectives And Key Result Methodology For Business
The following slide depicts human resource performance analysis dashboard to monitor HR outcomes. It includes elements such as absenteeism rate, training costs, overall labor effectiveness, overtime by age group, OLE by department etc. Welcome to our selection of the Measuring Human Resource Performance Objectives And Key Result Methodology For Business. These are designed to help you showcase your creativity and bring your sphere to life. Planning and Innovation are essential for any business that is just starting out. This collection contains the designs that you need for your everyday presentations. All of our PowerPoints are 100Percent editable, so you can customize them to suit your needs. This multi-purpose template can be used in various situations. Grab these presentation templates today. The following slide depicts human resource performance analysis dashboard to monitor HR outcomes. It includes elements such as absenteeism rate, training costs, overall labor effectiveness, overtime by age group, OLE by department etc.
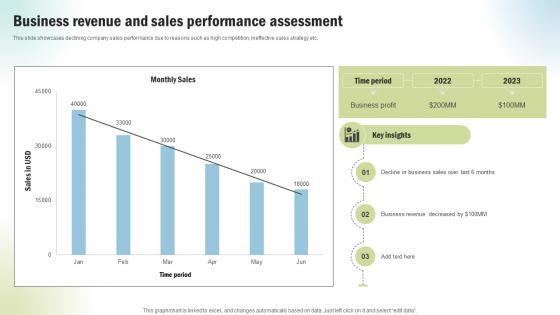
Marketing Project Performance Benchmarking Business Revenue And Sales CRP SS V
This slide showcases declining company sales performance due to reasons such as high competition, ineffective sales strategy etc. Get a simple yet stunning designed Marketing Project Performance Benchmarking Business Revenue And Sales CRP SS V. It is the best one to establish the tone in your meetings. It is an excellent way to make your presentations highly effective. So, download this PPT today from Slidegeeks and see the positive impacts. Our easy-to-edit Marketing Project Performance Benchmarking Business Revenue And Sales CRP SS V can be your go-to option for all upcoming conferences and meetings. So, what are you waiting for Grab this template today. This slide showcases declining company sales performance due to reasons such as high competition, ineffective sales strategy etc.
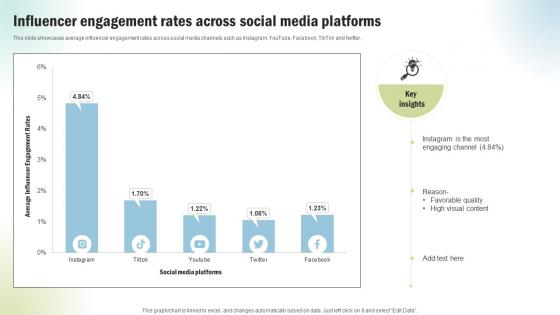
Marketing Project Performance Benchmarking Influencer Engagement Rates Across CRP SS V
This slide showcases average influencer engagement rates across social media channels such as Instagram, YouTube, Facebook, TikTok and twitter. This Marketing Project Performance Benchmarking Influencer Engagement Rates Across CRP SS V is perfect for any presentation, be it in front of clients or colleagues. It is a versatile and stylish solution for organizing your meetings. The Marketing Project Performance Benchmarking Influencer Engagement Rates Across CRP SS V features a modern design for your presentation meetings. The adjustable and customizable slides provide unlimited possibilities for acing up your presentation. Slidegeeks has done all the homework before launching the product for you. So, do not wait, grab the presentation templates today This slide showcases average influencer engagement rates across social media channels such as Instagram, YouTube, Facebook, TikTok and twitter.

Marketing Project Performance Benchmarking Top Most Social Media Platforms Used CRP SS V
This slide showcases various social media platforms used to engage targeted audience such as Facebook, twitter and YouTube and Instagram. Get a simple yet stunning designed Marketing Project Performance Benchmarking Top Most Social Media Platforms Used CRP SS V. It is the best one to establish the tone in your meetings. It is an excellent way to make your presentations highly effective. So, download this PPT today from Slidegeeks and see the positive impacts. Our easy-to-edit Marketing Project Performance Benchmarking Top Most Social Media Platforms Used CRP SS V can be your go-to option for all upcoming conferences and meetings. So, what are you waiting for Grab this template today. This slide showcases various social media platforms used to engage targeted audience such as Facebook, twitter and YouTube and Instagram.
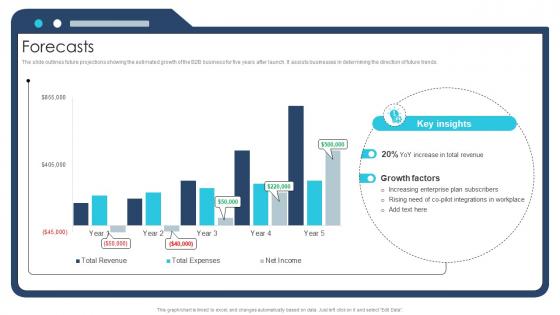
Forecasts Ai Chatbot Service Market Entry Strategy
The slide outlines future projections showing the estimated growth of the B2B business for five years after launch. It assists businesses in determining the direction of future trends.Slidegeeks is here to make your presentations a breeze with Forecasts Ai Chatbot Service Market Entry Strategy With our easy-to-use and customizable templates, you can focus on delivering your ideas rather than worrying about formatting. With a variety of designs to choose from, you are sure to find one that suits your needs. And with animations and unique photos, illustrations, and fonts, you can make your presentation pop. So whether you are giving a sales pitch or presenting to the board, make sure to check out Slidegeeks first The slide outlines future projections showing the estimated growth of the B2B business for five years after launch. It assists businesses in determining the direction of future trends.

Increasing Business Awareness Examining Ranking Factors That Impact Websites Strategy SS V
This slide analyzes the impact of main SEOs ranking factors on website ranking. It help develop and implement search marketing strategies that include a balance of on-page, off-page, and technical best practices. Find highly impressive Increasing Business Awareness Examining Ranking Factors That Impact Websites Strategy SS V on Slidegeeks to deliver a meaningful presentation. You can save an ample amount of time using these presentation templates. No need to worry to prepare everything from scratch because Slidegeeks experts have already done a huge research and work for you. You need to download Increasing Business Awareness Examining Ranking Factors That Impact Websites Strategy SS V for your upcoming presentation. All the presentation templates are 100 percent editable and you can change the color and personalize the content accordingly. Download now This slide analyzes the impact of main SEOs ranking factors on website ranking. It help develop and implement search marketing strategies that include a balance of on-page, off-page, and technical best practices.

Increasing Business Awareness Introducing Social Media Marketing For Creating Strategy SS V
This slide presents an overview of social media marketing. It also include a graph showcasing the associated benefits of social media for insurers such as marketing, customer service, new sales leads, fraud detection and risk selection. Take your projects to the next level with our ultimate collection of Increasing Business Awareness Introducing Social Media Marketing For Creating Strategy SS V. Slidegeeks has designed a range of layouts that are perfect for representing task or activity duration, keeping track of all your deadlines at a glance. Tailor these designs to your exact needs and give them a truly corporate look with your own brand colors they will make your projects stand out from the rest This slide presents an overview of social media marketing. It also include a graph showcasing the associated benefits of social media for insurers such as marketing, customer service, new sales leads, fraud detection and risk selection

Increasing Business Awareness Overview And Key Trends In Insurance Industry Strategy SS V
This slide presents an overview of the market and key trends in the insurance industry. It includes trends such as digital information, data analytics and AI, personalization, customer experience, collaboration and partnerships, and environmental and social responsibility. From laying roadmaps to briefing everything in detail, our templates are perfect for you. You can set the stage with your presentation slides. All you have to do is download these easy-to-edit and customizable templates. Increasing Business Awareness Overview And Key Trends In Insurance Industry Strategy SS V will help you deliver an outstanding performance that everyone would remember and praise you for. Do download this presentation today. This slide presents an overview of the market and key trends in the insurance industry. It includes trends such as digital information, data analytics and AI, personalization, customer experience, collaboration and partnerships, and environmental and social responsibility.
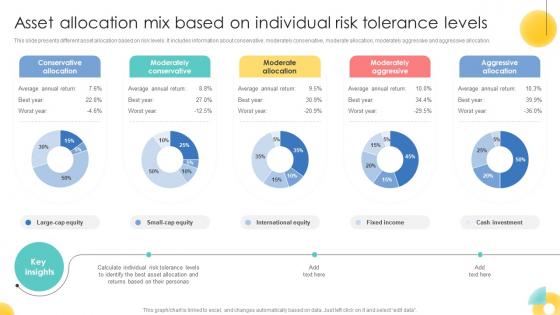
Asset Allocation Mix Based On Individual Risk Strategic Investment Plan For Optimizing Risk SS V
This slide presents different asset allocation based on risk levels. It includes information about conservative, moderately conservative, moderate allocation, moderately aggressive and aggressive allocation.Want to ace your presentation in front of a live audience Our Asset Allocation Mix Based On Individual Risk Strategic Investment Plan For Optimizing Risk SS V can help you do that by engaging all the users towards you. Slidegeeks experts have put their efforts and expertise into creating these impeccable powerpoint presentations so that you can communicate your ideas clearly. Moreover, all the templates are customizable, and easy-to-edit and downloadable. Use these for both personal and commercial use. This slide presents different asset allocation based on risk levels. It includes information about conservative, moderately conservative, moderate allocation, moderately aggressive and aggressive allocation.

Asset Mix Defining Taxable And Tax Free Allocation Strategic Investment Plan For Optimizing Risk SS V
This slide presents an asset mix for insured asset allocation strategy. It segregates assets based on four criteria no risk, low risk, high risk and moderate risk and differentiate between taxable vs. tax-free assets.There are so many reasons you need a Asset Mix Defining Taxable And Tax Free Allocation Strategic Investment Plan For Optimizing Risk SS V. The first reason is you can not spend time making everything from scratch, Thus, Slidegeeks has made presentation templates for you too. You can easily download these templates from our website easily. This slide presents an asset mix for insured asset allocation strategy. It segregates assets based on four criteria no risk, low risk, high risk and moderate risk and differentiate between taxable vs. tax-free assets.

Equity Asset Allocation Dashboard Analytics Strategic Investment Plan For Optimizing Risk SS V
This slide represents an equity asset allocation dashboard to measure and manage the performance of equity overtime. It tracks KPIs such as, average position size, market cap distribution, average PE distribution, ratio and yield, by geography, industry, currency and holding lists.If your project calls for a presentation, then Slidegeeks is your go-to partner because we have professionally designed, easy-to-edit templates that are perfect for any presentation. After downloading, you can easily edit Equity Asset Allocation Dashboard Analytics Strategic Investment Plan For Optimizing Risk SS V and make the changes accordingly. You can rearrange slides or fill them with different images. Check out all the handy templates This slide represents an equity asset allocation dashboard to measure and manage the performance of equity overtime. It tracks KPIs such as, average position size, market cap distribution, average PE distribution, ratio and yield, by geography, industry, currency and holding lists.
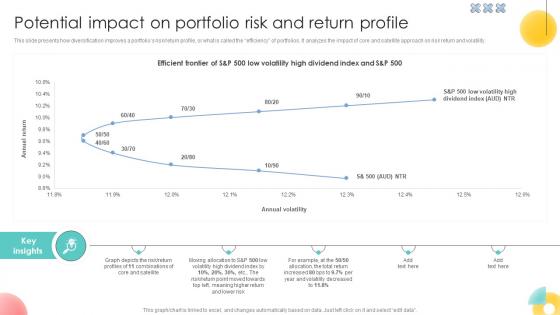
Potential Impact On Portfolio Risk And Return Profile Strategic Investment Plan For Optimizing Risk SS V
This slide presents how diversification improves a portfolios risk or return profile, or what is called the efficiency of portfolios. It analyzes the impact of core and satellite approach on risk return and volatility.From laying roadmaps to briefing everything in detail, our templates are perfect for you. You can set the stage with your presentation slides. All you have to do is download these easy-to-edit and customizable templates. Potential Impact On Portfolio Risk And Return Profile Strategic Investment Plan For Optimizing Risk SS V will help you deliver an outstanding performance that everyone would remember and praise you for. Do download this presentation today. This slide presents how diversification improves a portfolios risk or return profile, or what is called the efficiency of portfolios. It analyzes the impact of core and satellite approach on risk return and volatility.
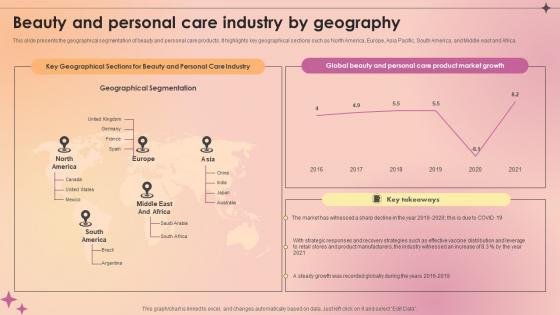
Beauty And Personal Care Industry By Geography Makeup And Skincare Market IR SS V
This slide presents the geographical segmentation of beauty and personal care products. It highlights key geographical sections such as North America, Europe, Asia Pacific, South America, and Middle east and Africa. Boost your pitch with our creative Beauty And Personal Care Industry By Geography Makeup And Skincare Market IR SS V. Deliver an awe-inspiring pitch that will mesmerize everyone. Using these presentation templates you will surely catch everyones attention. You can browse the ppts collection on our website. We have researchers who are experts at creating the right content for the templates. So you do not have to invest time in any additional work. Just grab the template now and use them. This slide presents the geographical segmentation of beauty and personal care products. It highlights key geographical sections such as North America, Europe, Asia Pacific, South America, and Middle east and Africa.
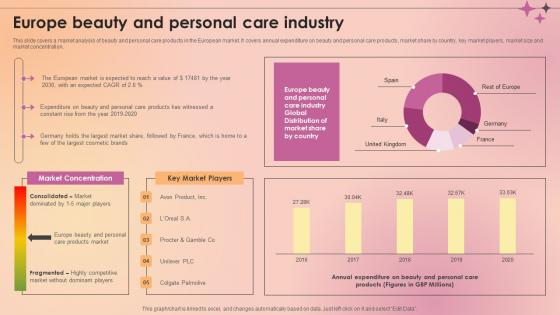
Europe Beauty And Personal Care Industry Makeup And Skincare Market IR SS V
This slide covers a market analysis of beauty and personal care products in the European market. It covers annual expenditure on beauty and personal care products, market share by country, key market players, market size and market concentration. From laying roadmaps to briefing everything in detail, our templates are perfect for you. You can set the stage with your presentation slides. All you have to do is download these easy-to-edit and customizable templates. Europe Beauty And Personal Care Industry Makeup And Skincare Market IR SS V will help you deliver an outstanding performance that everyone would remember and praise you for. Do download this presentation today. This slide covers a market analysis of beauty and personal care products in the European market. It covers annual expenditure on beauty and personal care products, market share by country, key market players, market size and market concentration.

Cultural Diversity Global Innovation And Business Solutions Company Profile CP SS V
This slide represents cultural diversity overview for Accenture highlighting company board diversity and board tenure. It also covers information such as board committee members, diverse directors and average age for director nominee.Slidegeeks is here to make your presentations a breeze with Cultural Diversity Global Innovation And Business Solutions Company Profile CP SS V With our easy-to-use and customizable templates, you can focus on delivering your ideas rather than worrying about formatting. With a variety of designs to choose from, you are sure to find one that suits your needs. And with animations and unique photos, illustrations, and fonts, you can make your presentation pop. So whether you are giving a sales pitch or presenting to the board, make sure to check out Slidegeeks first This slide represents cultural diversity overview for Accenture highlighting company board diversity and board tenure. It also covers information such as board committee members, diverse directors and average age for director nominee.

Employee Count Trend Global Innovation And Business Solutions Company Profile CP SS V
This slide represents the employee count trend of Accenture from 2018 to 2022 year. It also covers information regarding new members added to workforce, total training hours etc.Find highly impressive Employee Count Trend Global Innovation And Business Solutions Company Profile CP SS V on Slidegeeks to deliver a meaningful presentation. You can save an ample amount of time using these presentation templates. No need to worry to prepare everything from scratch because Slidegeeks experts have already done a huge research and work for you. You need to download Employee Count Trend Global Innovation And Business Solutions Company Profile CP SS V for your upcoming presentation. All the presentation templates are 100 percent editable and you can change the color and personalize the content accordingly. Download now This slide represents the employee count trend of Accenture from 2018 to 2022 year. It also covers information regarding new members added to workforce, total training hours etc.

Allocations Of Funds Work Management Tool Pitch Deck
This slide presents information on how company will allocate the funding raised during the round. It include allocation in areas such as research and development, hiring, digital marketing, sales.Find a pre-designed and impeccable Allocations Of Funds Work Management Tool Pitch Deck. The templates can ace your presentation without additional effort. You can download these easy-to-edit presentation templates to make your presentation stand out from others. So, what are you waiting for Download the template from Slidegeeks today and give a unique touch to your presentation. This slide presents information on how company will allocate the funding raised during the round. It include allocation in areas such as research and development, hiring, digital marketing, sales.
Financial Performance Work Management Tool Pitch Deck
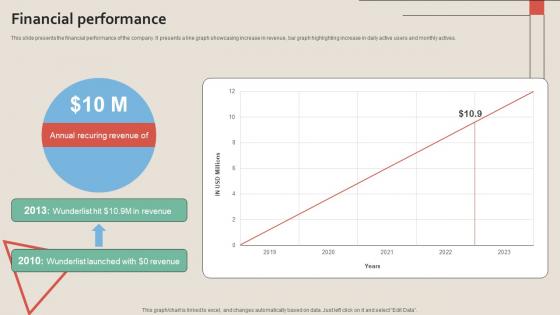
This slide presents the financial performance of the company. It presents a line graph showcasing increase in revenue, bar graph highlighting increase in daily active users and monthly actives.Present like a pro with Financial Performance Work Management Tool Pitch Deck. Create beautiful presentations together with your team, using our easy-to-use presentation slides. Share your ideas in real-time and make changes on the fly by downloading our templates. So whether you are in the office, on the go, or in a remote location, you can stay in sync with your team and present your ideas with confidence. With Slidegeeks presentation got a whole lot easier. Grab these presentations today. This slide presents the financial performance of the company. It presents a line graph showcasing increase in revenue, bar graph highlighting increase in daily active users and monthly actives.

Financial Projections Work Management Tool Pitch Deck
This slide presents the financial projection of the company with the help of line graphs. It showcases projected increase in company revenue and growth of EBITDA.Slidegeeks is here to make your presentations a breeze with Financial Projections Work Management Tool Pitch Deck With our easy-to-use and customizable templates, you can focus on delivering your ideas rather than worrying about formatting. With a variety of designs to choose from, you are sure to find one that suits your needs. And with animations and unique photos, illustrations, and fonts, you can make your presentation pop. So whether you are giving a sales pitch or presenting to the board, make sure to check out Slidegeeks first This slide presents the financial projection of the company with the help of line graphs. It showcases projected increase in company revenue and growth of EBITDA.

Create A Restaurant Marketing Challenges Faced In Implementing Restaurant
This slide shows buyers persona for understanding the target audiences pain points. It includes customer details such as professional information, goals, challenges, biggest fears, common objectives, hobbies, and interests. Want to ace your presentation in front of a live audience Our Create A Restaurant Marketing Challenges Faced In Implementing Restaurant can help you do that by engaging all the users towards you. Slidegeeks experts have put their efforts and expertise into creating these impeccable powerpoint presentations so that you can communicate your ideas clearly. Moreover, all the templates are customizable, and easy-to-edit and downloadable. Use these for both personal and commercial use. This slide shows buyers persona for understanding the target audiences pain points. It includes customer details such as professional information, goals, challenges, biggest fears, common objectives, hobbies, and interests.

Create A Restaurant Marketing Revenue Generation Dashboard Of Restaurant
This slide shows the KPI dashboards of restaurant business revenue generation to generate more leads. It includes KPIs such as total sales, margin ,profit, etc. Present like a pro with Create A Restaurant Marketing Revenue Generation Dashboard Of Restaurant. Create beautiful presentations together with your team, using our easy-to-use presentation slides. Share your ideas in real-time and make changes on the fly by downloading our templates. So whether you are in the office, on the go, or in a remote location, you can stay in sync with your team and present your ideas with confidence. With Slidegeeks presentation got a whole lot easier. Grab these presentations today. This slide shows the KPI dashboards of restaurant business revenue generation to generate more leads. It includes KPIs such as total sales, margin ,profit, etc.
Problem Statement Probate Assistance Solutions Company Investor Funding Elevator Pitch Deck
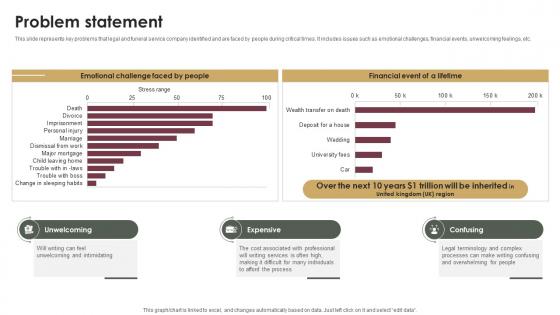
This slide represents key problems that legal and funeral service company identified and are faced by people during critical times. It includes issues such as emotional challenges, financial events, unwelcoming feelings, etc.Make sure to capture your audiences attention in your business displays with our gratis customizable Problem Statement Probate Assistance Solutions Company Investor Funding Elevator Pitch Deck. These are great for business strategies, office conferences, capital raising or task suggestions. If you desire to acquire more customers for your tech business and ensure they stay satisfied, create your own sales presentation with these plain slides. This slide represents key problems that legal and funeral service company identified and are faced by people during critical times. It includes issues such as emotional challenges, financial events, unwelcoming feelings, etc.
Candle Business Venture Analyzing Candle Industry Regional Outlook BP SS V
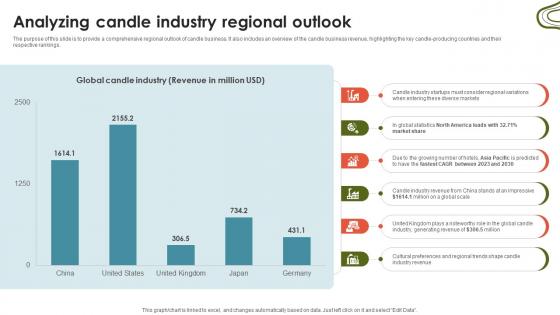
The purpose of this slide is to provide a comprehensive regional outlook of candle business. It also includes an overview of the candle business revenue, highlighting the key candle-producing countries and their respective rankings. Create an editable Candle Business Venture Analyzing Candle Industry Regional Outlook BP SS V that communicates your idea and engages your audience. Whether you are presenting a business or an educational presentation, pre-designed presentation templates help save time. Candle Business Venture Analyzing Candle Industry Regional Outlook BP SS V is highly customizable and very easy to edit, covering many different styles from creative to business presentations. Slidegeeks has creative team members who have crafted amazing templates. So, go and get them without any delay. The purpose of this slide is to provide a comprehensive regional outlook of candle business. It also includes an overview of the candle business revenue, highlighting the key candle-producing countries and their respective rankings.
Candle Business Venture Candle Making Business Market Shares BP SS V
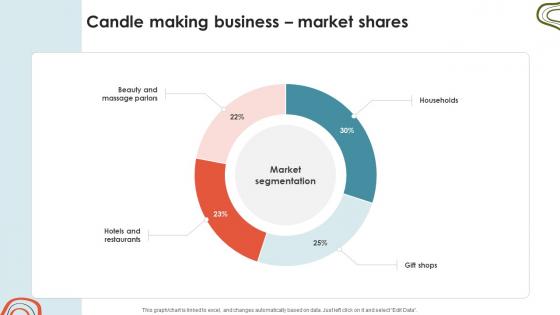
Get a simple yet stunning designed Candle Business Venture Candle Making Business Market Shares BP SS V. It is the best one to establish the tone in your meetings. It is an excellent way to make your presentations highly effective. So, download this PPT today from Slidegeeks and see the positive impacts. Our easy-to-edit Candle Business Venture Candle Making Business Market Shares BP SS V can be your go-to option for all upcoming conferences and meetings. So, what are you waiting for Grab this template today. Our Candle Business Venture Candle Making Business Market Shares BP SS V are topically designed to provide an attractive backdrop to any subject. Use them to look like a presentation pro.
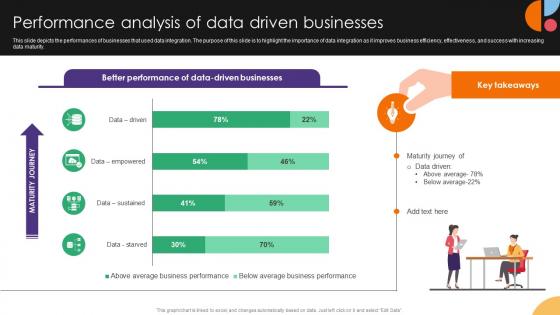
Performance Analysis Of Data Driven Businesses Data Integration Strategies For Business
This slide depicts the performances of businesses that used data integration. The purpose of this slide is to highlight the importance of data integration as it improves business efficiency, effectiveness, and success with increasing data maturity. From laying roadmaps to briefing everything in detail, our templates are perfect for you. You can set the stage with your presentation slides. All you have to do is download these easy-to-edit and customizable templates. Performance Analysis Of Data Driven Businesses Data Integration Strategies For Business will help you deliver an outstanding performance that everyone would remember and praise you for. Do download this presentation today. This slide depicts the performances of businesses that used data integration. The purpose of this slide is to highlight the importance of data integration as it improves business efficiency, effectiveness, and success with increasing data maturity.
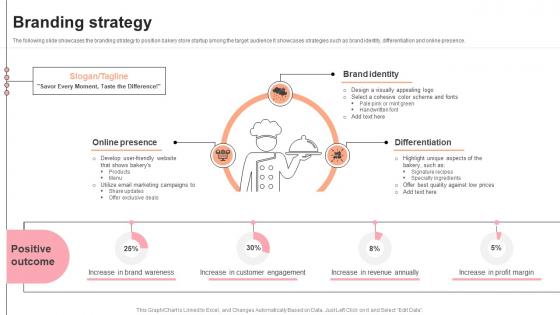
Branding Strategy Pastry Shop Market Entry Plan GTM SS V
The following slide showcases the branding strategy to position bakery store startup among the target audience It showcases strategies such as brand identity, differentiation and online presence. Boost your pitch with our creative Branding Strategy Pastry Shop Market Entry Plan GTM SS V. Deliver an awe-inspiring pitch that will mesmerize everyone. Using these presentation templates you will surely catch everyones attention. You can browse the ppts collection on our website. We have researchers who are experts at creating the right content for the templates. So you do not have to invest time in any additional work. Just grab the template now and use them. The following slide showcases the branding strategy to position bakery store startup among the target audience It showcases strategies such as brand identity, differentiation and online presence.
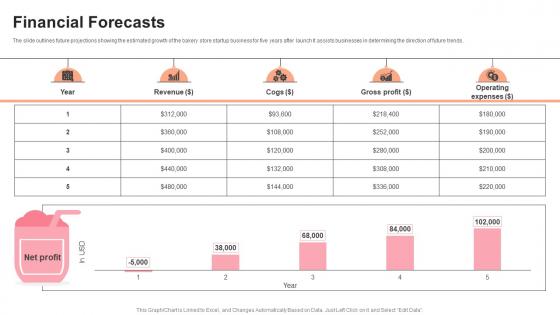
Financial Forecasts Pastry Shop Market Entry Plan GTM SS V
The slide outlines future projections showing the estimated growth of the bakery store startup business for five years after launch It assists businesses in determining the direction of future trends. Present like a pro with Financial Forecasts Pastry Shop Market Entry Plan GTM SS V. Create beautiful presentations together with your team, using our easy-to-use presentation slides. Share your ideas in real-time and make changes on the fly by downloading our templates. So whether you are in the office, on the go, or in a remote location, you can stay in sync with your team and present your ideas with confidence. With Slidegeeks presentation got a whole lot easier. Grab these presentations today. The slide outlines future projections showing the estimated growth of the bakery store startup business for five years after launch It assists businesses in determining the direction of future trends.
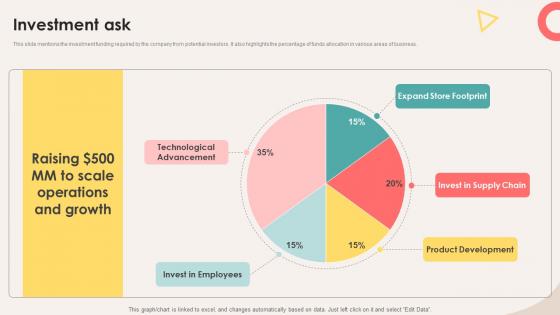
Investment Ask Retail Store Investor Elevator Pitch Deck
This slide mentions the investment funding required by the company from potential investors. It also highlights the percentage of funds allocation in various areas of business. Find highly impressive Investment Ask Retail Store Investor Elevator Pitch Deck on Slidegeeks to deliver a meaningful presentation. You can save an ample amount of time using these presentation templates. No need to worry to prepare everything from scratch because Slidegeeks experts have already done a huge research and work for you. You need to download Investment Ask Retail Store Investor Elevator Pitch Deck for your upcoming presentation. All the presentation templates are 100 percent editable and you can change the color and personalize the content accordingly. Download now This slide mentions the investment funding required by the company from potential investors. It also highlights the percentage of funds allocation in various areas of business.
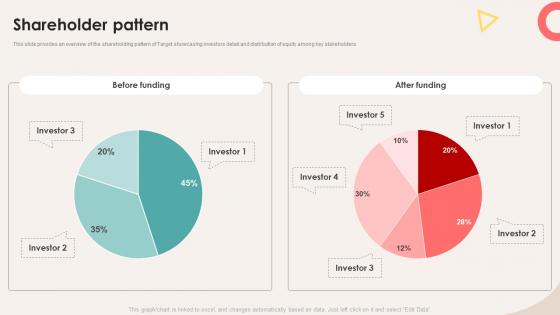
Shareholder Pattern Retail Store Investor Elevator Pitch Deck
This slide provides an overview of the shareholding pattern of Target showcasing investors detail and distribution of equity among key stakeholders. This Shareholder Pattern Retail Store Investor Elevator Pitch Deck is perfect for any presentation, be it in front of clients or colleagues. It is a versatile and stylish solution for organizing your meetings. The Shareholder Pattern Retail Store Investor Elevator Pitch Deck features a modern design for your presentation meetings. The adjustable and customizable slides provide unlimited possibilities for acing up your presentation. Slidegeeks has done all the homework before launching the product for you. So, do not wait, grab the presentation templates today This slide provides an overview of the shareholding pattern of Target showcasing investors detail and distribution of equity among key stakeholders.

Project Change Management Kpi Dashboard Strategies For Success In Digital
This slide represents KPI dashboard to effectively track and monitor effectiveness of changes implemented in organizational projects. It includes details related to KPIs such as changes investigated, submitted, approved, declined, etc. Slidegeeks has constructed Project Change Management Kpi Dashboard Strategies For Success In Digital after conducting extensive research and examination. These presentation templates are constantly being generated and modified based on user preferences and critiques from editors. Here, you will find the most attractive templates for a range of purposes while taking into account ratings and remarks from users regarding the content. This is an excellent jumping-off point to explore our content and will give new users an insight into our top-notch PowerPoint Templates. This slide represents KPI dashboard to effectively track and monitor effectiveness of changes implemented in organizational projects. It includes details related to KPIs such as changes investigated, submitted, approved, declined, etc.
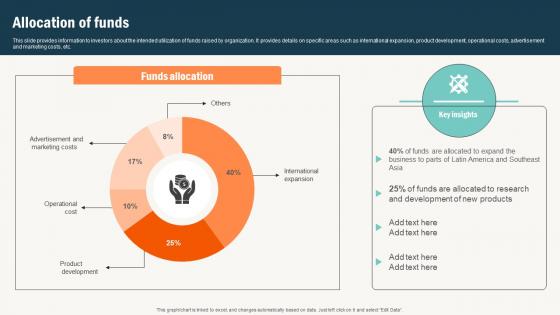
Allocation Of Funds Conversational Commerce Platform Investor
This slide provides information to investors about the intended utilization of funds raised by organization. It provides details on specific areas such as international expansion, product development, operational costs, advertisement and marketing costs, etc. Find a pre designed and impeccable Allocation Of Funds Conversational Commerce Platform Investor The templates can ace your presentation without additional effort. You can download these easy to edit presentation templates to make your presentation stand out from others. So, what are you waiting for Download the template from Slidegeeks today and give a unique touch to your presentation. This slide provides information to investors about the intended utilization of funds raised by organization. It provides details on specific areas such as international expansion, product development, operational costs, advertisement and marketing costs, etc.
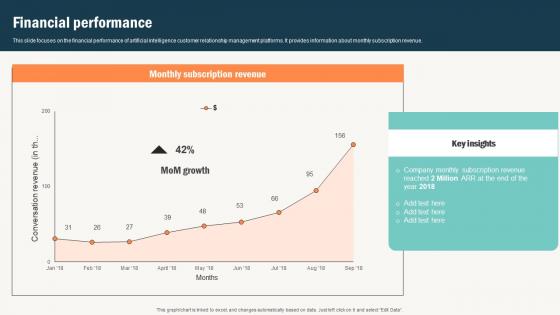
Financial Performance Conversational Commerce Platform Investor
This slide focuses on the financial performance of artificial intelligence customer relationship management platforms. It provides information about monthly subscription revenue. Present like a pro with Financial Performance Conversational Commerce Platform Investor Create beautiful presentations together with your team, using our easy to use presentation slides. Share your ideas in real time and make changes on the fly by downloading our templates. So whether you are in the office, on the go, or in a remote location, you can stay in sync with your team and present your ideas with confidence. With Slidegeeks presentation got a whole lot easier. Grab these presentations today. This slide focuses on the financial performance of artificial intelligence customer relationship management platforms. It provides information about monthly subscription revenue.
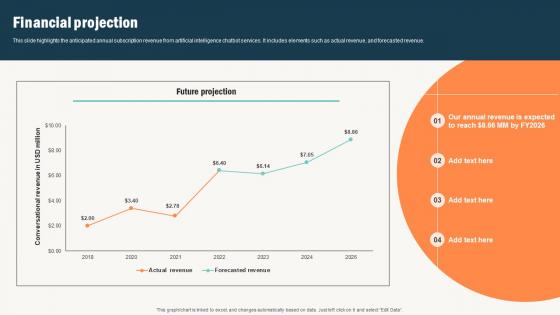
Financial Projection Conversational Commerce Platform Investor
This slide highlights the anticipated annual subscription revenue from artificial intelligence chatbot services. It includes elements such as actual revenue, and forecasted revenue. Slidegeeks is here to make your presentations a breeze with Financial Projection Conversational Commerce Platform Investor With our easy to use and customizable templates, you can focus on delivering your ideas rather than worrying about formatting. With a variety of designs to choose from, you are sure to find one that suits your needs. And with animations and unique photos, illustrations, and fonts, you can make your presentation pop. So whether you are giving a sales pitch or presenting to the board, make sure to check out Slidegeeks first This slide highlights the anticipated annual subscription revenue from artificial intelligence chatbot services. It includes elements such as actual revenue, and forecasted revenue.
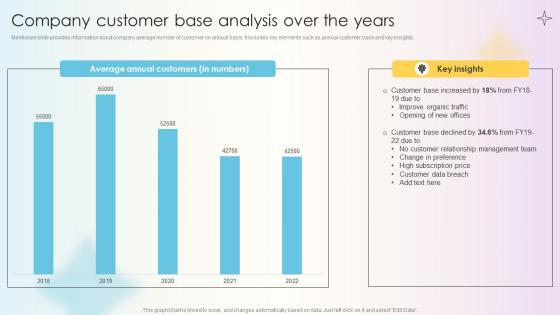
Managing Technical And Non Company Customer Base Analysis Over The Years
Mentioned slide provides information about company average number of customer on annual basis. It includes key elements such as annual customer base and key insights. Find highly impressive Managing Technical And Non Company Customer Base Analysis Over The Years on Slidegeeks to deliver a meaningful presentation. You can save an ample amount of time using these presentation templates. No need to worry to prepare everything from scratch because Slidegeeks experts have already done a huge research and work for you. You need to download Managing Technical And Non Company Customer Base Analysis Over The Years for your upcoming presentation. All the presentation templates are 100 percent editable and you can change the color and personalize the content accordingly. Download now Mentioned slide provides information about company average number of customer on annual basis. It includes key elements such as annual customer base and key insights.
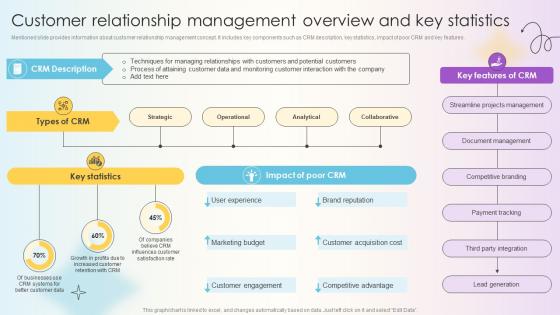
Managing Technical And Non Customer Relationship Management Overview And Key
Mentioned slide provides information about customer relationship management concept. It includes key components such as CRM description, key statistics, impact of poor CRM and key features. Make sure to capture your audiences attention in your business displays with our gratis customizable Managing Technical And Non Customer Relationship Management Overview And Key. These are great for business strategies, office conferences, capital raising or task suggestions. If you desire to acquire more customers for your tech business and ensure they stay satisfied, create your own sales presentation with these plain slides. Mentioned slide provides information about customer relationship management concept. It includes key components such as CRM description, key statistics, impact of poor CRM and key features.
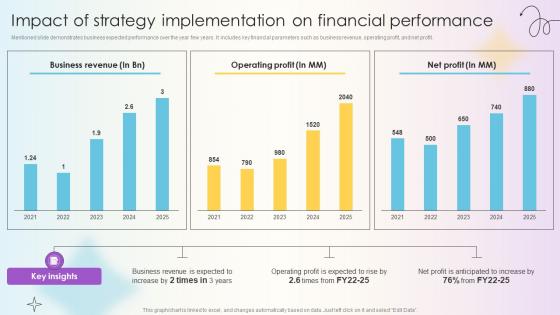
Managing Technical And Non Impact Of Strategy Implementation On Financial
Mentioned slide demonstrates business expected performance over the year few years. It includes key financial parameters such as business revenue, operating profit, and net profit. Slidegeeks has constructed Managing Technical And Non Impact Of Strategy Implementation On Financial after conducting extensive research and examination. These presentation templates are constantly being generated and modified based on user preferences and critiques from editors. Here, you will find the most attractive templates for a range of purposes while taking into account ratings and remarks from users regarding the content. This is an excellent jumping-off point to explore our content and will give new users an insight into our top-notch PowerPoint Templates. Mentioned slide demonstrates business expected performance over the year few years. It includes key financial parameters such as business revenue, operating profit, and net profit.
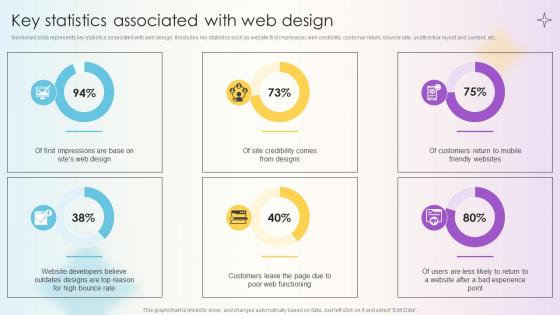
Managing Technical And Non Technical Key Statistics Associated With Web Design
Mentioned slide represents key statistics associated with web design. It includes key statistics such as website first impression, web credibility, customer return, bounce rate, unattractive layout and content, etc. Find highly impressive Managing Technical And Non Technical Key Statistics Associated With Web Design on Slidegeeks to deliver a meaningful presentation. You can save an ample amount of time using these presentation templates. No need to worry to prepare everything from scratch because Slidegeeks experts have already done a huge research and work for you. You need to download Managing Technical And Non Technical Key Statistics Associated With Web Design for your upcoming presentation. All the presentation templates are 100 percent editable and you can change the color and personalize the content accordingly. Download now Mentioned slide represents key statistics associated with web design. It includes key statistics such as website first impression, web credibility, customer return, bounce rate, unattractive layout and content, etc.
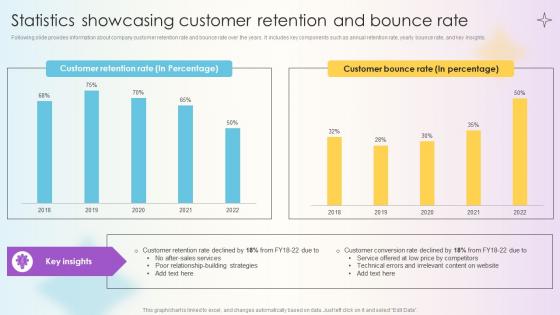
Managing Technical And Non Technical Statistics Showcasing Customer Retention
Following slide provides information about company customer retention rate and bounce rate over the years. It includes key components such as annual retention rate, yearly bounce rate, and key insights. If your project calls for a presentation, then Slidegeeks is your go-to partner because we have professionally designed, easy-to-edit templates that are perfect for any presentation. After downloading, you can easily edit Managing Technical And Non Technical Statistics Showcasing Customer Retention and make the changes accordingly. You can rearrange slides or fill them with different images. Check out all the handy templates Following slide provides information about company customer retention rate and bounce rate over the years. It includes key components such as annual retention rate, yearly bounce rate, and key insights.
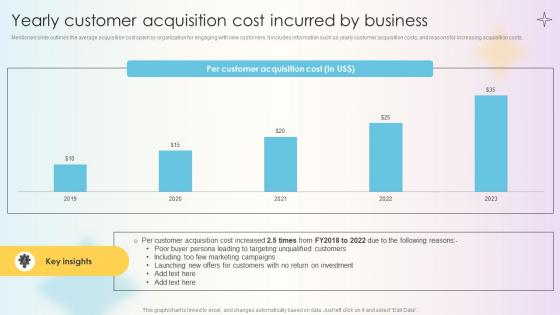
Managing Technical And Non Yearly Customer Acquisition Cost Incurred By Business
Mentioned slide outlines the average acquisition cost spent by organization for engaging with new customers. It includes information such as yearly customer acquisition costs, and reasons for increasing acquisition costs. Explore a selection of the finest Managing Technical And Non Yearly Customer Acquisition Cost Incurred By Business here. With a plethora of professionally designed and pre-made slide templates, you can quickly and easily find the right one for your upcoming presentation. You can use our Managing Technical And Non Yearly Customer Acquisition Cost Incurred By Business to effectively convey your message to a wider audience. Slidegeeks has done a lot of research before preparing these presentation templates. The content can be personalized and the slides are highly editable. Grab templates today from Slidegeeks. Mentioned slide outlines the average acquisition cost spent by organization for engaging with new customers. It includes information such as yearly customer acquisition costs, and reasons for increasing acquisition costs.
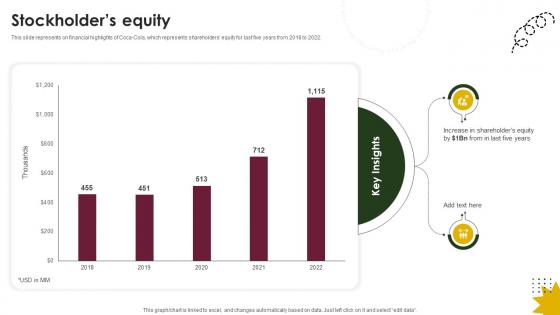
Stockholders Equity Beverage Company Profile CP SS V
This slide represents on financial highlights of Coca-Cola, which represents shareholders equity for last five years from 2018 to 2022.This Stockholders Equity Beverage Company Profile CP SS V is perfect for any presentation, be it in front of clients or colleagues. It is a versatile and stylish solution for organizing your meetings. The Stockholders Equity Beverage Company Profile CP SS V features a modern design for your presentation meetings. The adjustable and customizable slides provide unlimited possibilities for acing up your presentation. Slidegeeks has done all the homework before launching the product for you. So, do not wait, grab the presentation templates today This slide represents on financial highlights of Coca-Cola, which represents shareholders equity for last five years from 2018 to 2022.
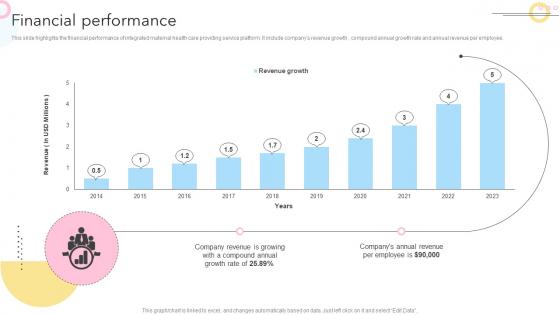
Financial Performance Maternity Support Platform Pitch Deck
This slide highlights the financial performance of integrated maternal health care providing service platform. It include companys revenue growth , compound annual growth rate and annual revenue per employee.Present like a pro with Financial Performance Maternity Support Platform Pitch Deck. Create beautiful presentations together with your team, using our easy-to-use presentation slides. Share your ideas in real-time and make changes on the fly by downloading our templates. So whether you are in the office, on the go, or in a remote location, you can stay in sync with your team and present your ideas with confidence. With Slidegeeks presentation got a whole lot easier. Grab these presentations today. This slide highlights the financial performance of integrated maternal health care providing service platform. It include companys revenue growth , compound annual growth rate and annual revenue per employee.
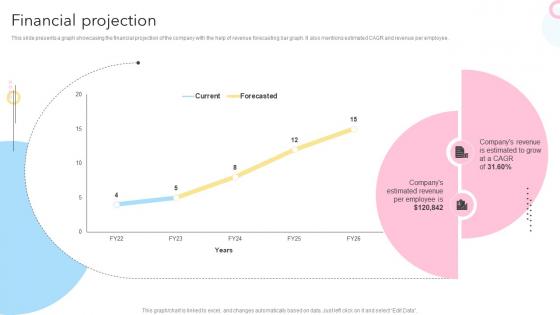
Financial Projection Maternity Support Platform Pitch Deck
This slide presents a graph showcasing the financial projection of the company with the help of revenue forecasting bar graph. It also mentions estimated CAGR and revenue per employee.Slidegeeks is here to make your presentations a breeze with Financial Projection Maternity Support Platform Pitch Deck With our easy-to-use and customizable templates, you can focus on delivering your ideas rather than worrying about formatting. With a variety of designs to choose from, you are sure to find one that suits your needs. And with animations and unique photos, illustrations, and fonts, you can make your presentation pop. So whether you are giving a sales pitch or presenting to the board, make sure to check out Slidegeeks first This slide presents a graph showcasing the financial projection of the company with the help of revenue forecasting bar graph. It also mentions estimated CAGR and revenue per employee.
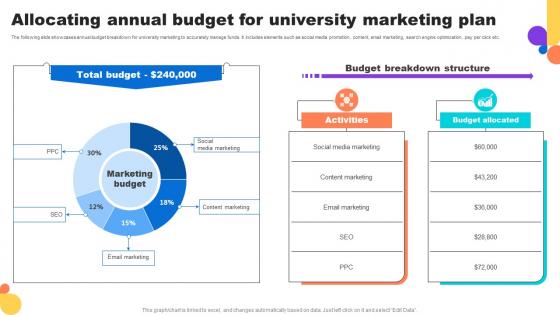
Allocating Annual Budget For University Marketing Plan Key Step To Implementation University Strategy SS V
The following slide showcases annual budget breakdown for university marketing to accurately manage funds. It includes elements such as social media promotion, content, email marketing, search engine optimization, pay per click etc.Create an editable Allocating Annual Budget For University Marketing Plan Key Step To Implementation University Strategy SS V that communicates your idea and engages your audience. Whether you are presenting a business or an educational presentation, pre-designed presentation templates help save time. Allocating Annual Budget For University Marketing Plan Key Step To Implementation University Strategy SS V is highly customizable and very easy to edit, covering many different styles from creative to business presentations. Slidegeeks has creative team members who have crafted amazing templates. So, go and get them without any delay. The following slide showcases annual budget breakdown for university marketing to accurately manage funds. It includes elements such as social media promotion, content, email marketing, search engine optimization, pay per click etc.
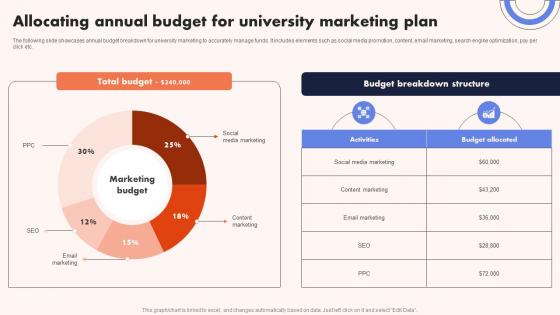
University Marketing Guide Allocating Annual Budget For University Marketing Strategy SS V
The following slide showcases annual budget breakdown for university marketing to accurately manage funds. It includes elements such as social media promotion, content, email marketing, search engine optimization, pay per click etc. From laying roadmaps to briefing everything in detail, our templates are perfect for you. You can set the stage with your presentation slides. All you have to do is download these easy-to-edit and customizable templates. University Marketing Guide Allocating Annual Budget For University Marketing Strategy SS V will help you deliver an outstanding performance that everyone would remember and praise you for. Do download this presentation today. The following slide showcases annual budget breakdown for university marketing to accurately manage funds. It includes elements such as social media promotion, content, email marketing, search engine optimization, pay per click etc.
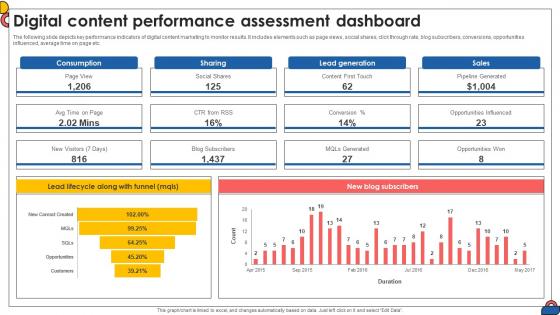
Digital Content Performance Assessment Dashboard Comprehensive Guide To Implement Strategy SS V
The following slide depicts key performance indicators of digital content marketing to monitor results. It includes elements such as page views, social shares, click through rate, blog subscribers, conversions, opportunities influenced, average time on page etc.If your project calls for a presentation, then Slidegeeks is your go-to partner because we have professionally designed, easy-to-edit templates that are perfect for any presentation. After downloading, you can easily edit Digital Content Performance Assessment Dashboard Comprehensive Guide To Implement Strategy SS V and make the changes accordingly. You can rearrange slides or fill them with different images. Check out all the handy templates The following slide depicts key performance indicators of digital content marketing to monitor results. It includes elements such as page views, social shares, click through rate, blog subscribers, conversions, opportunities influenced, average time on page etc.
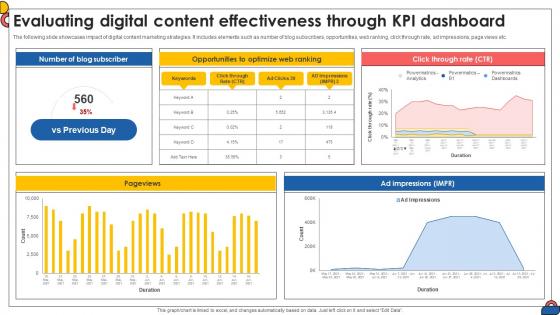
Evaluating Digital Content Effectiveness Through Kpi Comprehensive Guide To Implement Strategy SS V
The following slide showcases impact of digital content marketing strategies. It includes elements such as number of blog subscribers, opportunities, web ranking, click through rate, ad impressions, page views etc. Make sure to capture your audiences attention in your business displays with our gratis customizable Evaluating Digital Content Effectiveness Through Kpi Comprehensive Guide To Implement Strategy SS V. These are great for business strategies, office conferences, capital raising or task suggestions. If you desire to acquire more customers for your tech business and ensure they stay satisfied, create your own sales presentation with these plain slides. The following slide showcases impact of digital content marketing strategies. It includes elements such as number of blog subscribers, opportunities, web ranking, click through rate, ad impressions, page views etc.
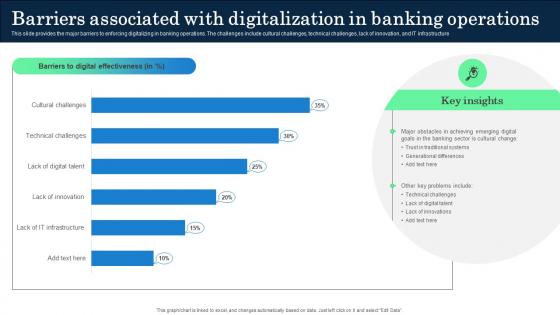
Barriers Associated With Digitalization In Incorporating Banking Operational Growth
This slide provides the major barriers to enforcing digitalizing in banking operations. The challenges include cultural challenges, technical challenges, lack of innovation, and IT infrastructure. Do you have to make sure that everyone on your team knows about any specific topic I yes, then you should give Barriers Associated With Digitalization In Incorporating Banking Operational Growth a try. Our experts have put a lot of knowledge and effort into creating this impeccable Barriers Associated With Digitalization In Incorporating Banking Operational Growth. You can use this template for your upcoming presentations, as the slides are perfect to represent even the tiniest detail. You can download these templates from the Slidegeeks website and these are easy to edit. So grab these today This slide provides the major barriers to enforcing digitalizing in banking operations. The challenges include cultural challenges, technical challenges, lack of innovation, and IT infrastructure.
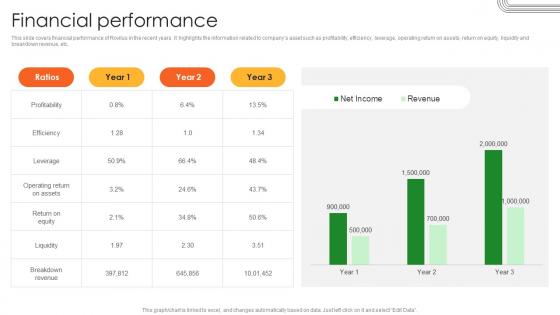
Financial Performance Battery Production Firm Investor Funding Elevator Pitch Deck
This slide covers financial performance of Rovilus in the recent years. It highlights the information related to companys asset such as profitability, efficiency, leverage, operating return on assets, return on equity, liquidity and breakdown revenue, etc. From laying roadmaps to briefing everything in detail, our templates are perfect for you. You can set the stage with your presentation slides. All you have to do is download these easy-to-edit and customizable templates. Financial Performance Battery Production Firm Investor Funding Elevator Pitch Deck will help you deliver an outstanding performance that everyone would remember and praise you for. Do download this presentation today. This slide covers financial performance of Rovilus in the recent years. It highlights the information related to companys asset such as profitability, efficiency, leverage, operating return on assets, return on equity, liquidity and breakdown revenue, etc.
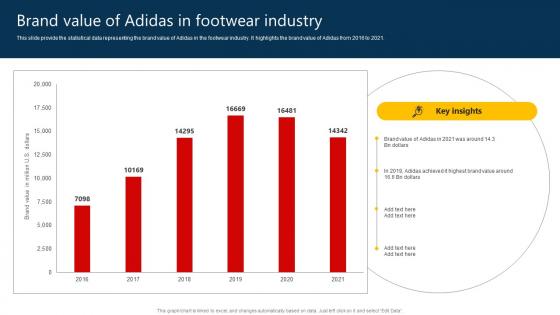
The Marketing Mix Of Brand Value Of Adidas In Footwear Industry Strategy SS V
This slide provide the statistical data representing the brand value of Adidas in the footwear industry. It highlights the brand value of Adidas from 2016 to 2021. Slidegeeks has constructed The Marketing Mix Of Brand Value Of Adidas In Footwear Industry Strategy SS V after conducting extensive research and examination. These presentation templates are constantly being generated and modified based on user preferences and critiques from editors. Here, you will find the most attractive templates for a range of purposes while taking into account ratings and remarks from users regarding the content. This is an excellent jumping-off point to explore our content and will give new users an insight into our top-notch PowerPoint Templates. This slide provide the statistical data representing the brand value of Adidas in the footwear industry. It highlights the brand value of Adidas from 2016 to 2021.
Unlocking Potential Enhancing Team Members Performance Tracking Dashboards
This slide depicts performance tracking dashboard for project manager to analyze work being done by the team. It includes average rating for the week, total work done and weekly change, employee rating and work done. Take your projects to the next level with our ultimate collection of Unlocking Potential Enhancing Team Members Performance Tracking Dashboards. Slidegeeks has designed a range of layouts that are perfect for representing task or activity duration, keeping track of all your deadlines at a glance. Tailor these designs to your exact needs and give them a truly corporate look with your own brand colors they will make your projects stand out from the rest This slide depicts performance tracking dashboard for project manager to analyze work being done by the team. It includes average rating for the week, total work done and weekly change, employee rating and work done.
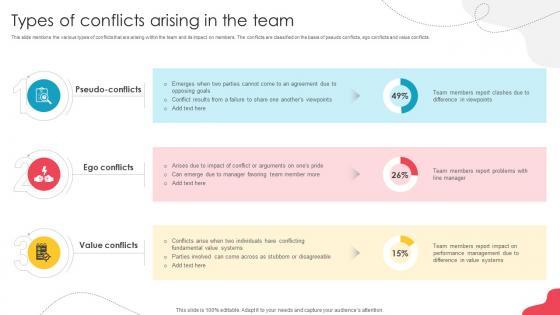
Unlocking Potential Enhancing Types Of Conflicts Arising In The Team
This slide mentions the various types of conflicts that are arising within the team and its impact on members. The conflicts are classified on the basis of pseudo conflicts, ego conflicts and value conflicts. Create an editable Unlocking Potential Enhancing Types Of Conflicts Arising In The Team that communicates your idea and engages your audience. Whether you are presenting a business or an educational presentation, pre-designed presentation templates help save time. Unlocking Potential Enhancing Types Of Conflicts Arising In The Team is highly customizable and very easy to edit, covering many different styles from creative to business presentations. Slidegeeks has creative team members who have crafted amazing templates. So, go and get them without any delay. This slide mentions the various types of conflicts that are arising within the team and its impact on members. The conflicts are classified on the basis of pseudo conflicts, ego conflicts and value conflicts.

Product Analytics Dashboard To Track Engagement Driving Business Success Integrating Product
This slide illustrates a dashboard to monitor customer engagement on company website by leveraging product analytics tools aimed at making necessary improvements. It covers insights regarding active monthly users, new users, total completed purchases, screen views, average duration of session, etc. There are so many reasons you need a Product Analytics Dashboard To Track Engagement Driving Business Success Integrating Product. The first reason is you can not spend time making everything from scratch, Thus, Slidegeeks has made presentation templates for you too. You can easily download these templates from our website easily. This slide illustrates a dashboard to monitor customer engagement on company website by leveraging product analytics tools aimed at making necessary improvements. It covers insights regarding active monthly users, new users, total completed purchases, screen views, average duration of session, etc.
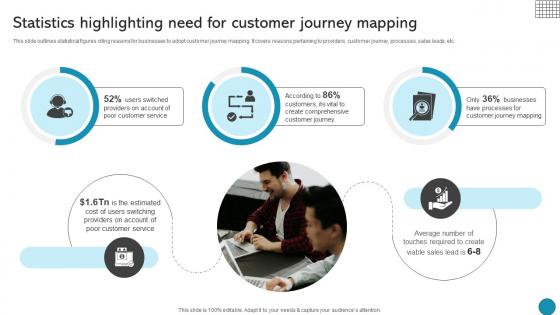
Statistics Highlighting Need For Customer Journey Driving Business Success Integrating Product
This slide outlines statistical figures citing reasons for businesses to adopt customer journey mapping. It covers reasons pertaining to providers, customer journey, processes, sales leads, etc. Make sure to capture your audiences attention in your business displays with our gratis customizable Statistics Highlighting Need For Customer Journey Driving Business Success Integrating Product. These are great for business strategies, office conferences, capital raising or task suggestions. If you desire to acquire more customers for your tech business and ensure they stay satisfied, create your own sales presentation with these plain slides. This slide outlines statistical figures citing reasons for businesses to adopt customer journey mapping. It covers reasons pertaining to providers, customer journey, processes, sales leads, etc.
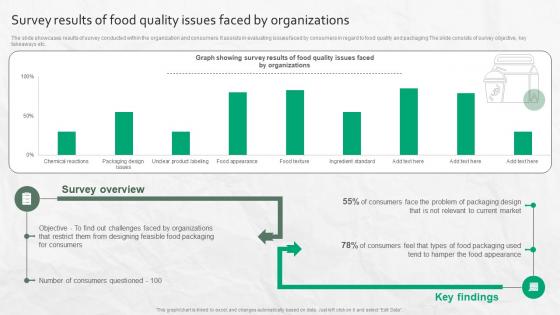
Survey Results Of Food Quality Issues Faced By Organizations
The slide showcases results of survey conducted within the organization and consumers. It assists in evaluating issues faced by consumers in regard to food quality and packaging The slide consists of survey objective, key takeaways etc. Slidegeeks is here to make your presentations a breeze with Survey Results Of Food Quality Issues Faced By Organizations With our easy-to-use and customizable templates, you can focus on delivering your ideas rather than worrying about formatting. With a variety of designs to choose from, you are sure to find one that suits your needs. And with animations and unique photos, illustrations, and fonts, you can make your presentation pop. So whether you are giving a sales pitch or presenting to the board, make sure to check out Slidegeeks first The slide showcases results of survey conducted within the organization and consumers. It assists in evaluating issues faced by consumers in regard to food quality and packaging The slide consists of survey objective, key takeaways etc.
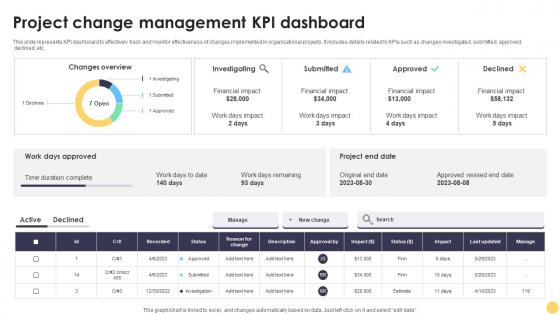
Project Change Management Kpi Dashboard Digital Project Management Strategies
This slide represents KPI dashboard to effectively track and monitor effectiveness of changes implemented in organizational projects. It includes details related to KPIs such as changes investigated, submitted, approved, declined, etc. Do you have to make sure that everyone on your team knows about any specific topic I yes, then you should give Project Change Management Kpi Dashboard Digital Project Management Strategies a try. Our experts have put a lot of knowledge and effort into creating this impeccable Project Change Management Kpi Dashboard Digital Project Management Strategies. You can use this template for your upcoming presentations, as the slides are perfect to represent even the tiniest detail. You can download these templates from the Slidegeeks website and these are easy to edit. So grab these today This slide represents KPI dashboard to effectively track and monitor effectiveness of changes implemented in organizational projects. It includes details related to KPIs such as changes investigated, submitted, approved, declined, etc.
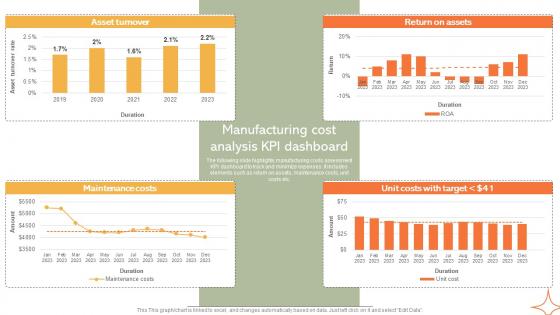
Manufacturing Cost Analysis KPI Dashboard Implementing Manufacturing Strategy SS V
The following slide highlights manufacturing costs assessment KPI dashboard to track and minimize expenses. It includes elements such as return on assets, maintenance costs, unit costs etc. Make sure to capture your audiences attention in your business displays with our gratis customizable Manufacturing Cost Analysis KPI Dashboard Implementing Manufacturing Strategy SS V. These are great for business strategies, office conferences, capital raising or task suggestions. If you desire to acquire more customers for your tech business and ensure they stay satisfied, create your own sales presentation with these plain slides. The following slide highlights manufacturing costs assessment KPI dashboard to track and minimize expenses. It includes elements such as return on assets, maintenance costs, unit costs etc.
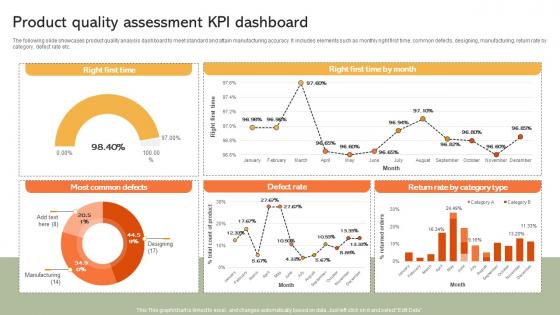
Product Quality Assessment KPI Dashboard Implementing Manufacturing Strategy SS V
The following slide showcases product quality analysis dashboard to meet standard and attain manufacturing accuracy. It includes elements such as monthly right first time, common defects, designing, manufacturing, return rate by category, defect rate etc. Take your projects to the next level with our ultimate collection of Product Quality Assessment KPI Dashboard Implementing Manufacturing Strategy SS V. Slidegeeks has designed a range of layouts that are perfect for representing task or activity duration, keeping track of all your deadlines at a glance. Tailor these designs to your exact needs and give them a truly corporate look with your own brand colors they will make your projects stand out from the rest The following slide showcases product quality analysis dashboard to meet standard and attain manufacturing accuracy. It includes elements such as monthly right first time, common defects, designing, manufacturing, return rate by category, defect rate etc.
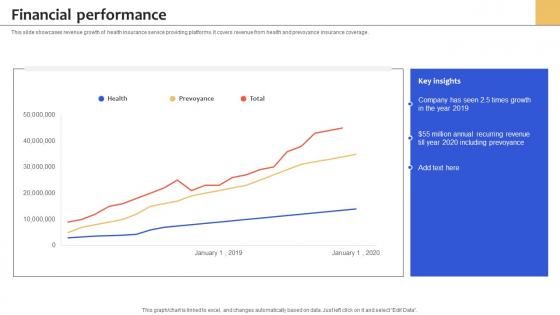
Financial Performance Health Insurance Services Management Platform Pitch Deck
This slide showcases revenue growth of health insurance service providing platforms. It covers revenue from health and prevoyance insurance coverage. Present like a pro with Financial Performance Health Insurance Services Management Platform Pitch Deck. Create beautiful presentations together with your team, using our easy-to-use presentation slides. Share your ideas in real-time and make changes on the fly by downloading our templates. So whether you are in the office, on the go, or in a remote location, you can stay in sync with your team and present your ideas with confidence. With Slidegeeks presentation got a whole lot easier. Grab these presentations today. This slide showcases revenue growth of health insurance service providing platforms. It covers revenue from health and prevoyance insurance coverage.
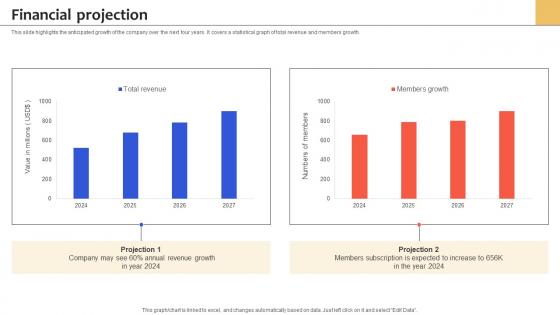
Financial Projection Health Insurance Services Management Platform Pitch Deck
This slide highlights the anticipated growth of the company over the next four years. It covers a statistical graph of total revenue and members growth. Slidegeeks is here to make your presentations a breeze with Financial Projection Health Insurance Services Management Platform Pitch Deck With our easy-to-use and customizable templates, you can focus on delivering your ideas rather than worrying about formatting. With a variety of designs to choose from, you are sure to find one that suits your needs. And with animations and unique photos, illustrations, and fonts, you can make your presentation pop. So whether you are giving a sales pitch or presenting to the board, make sure to check out Slidegeeks first This slide highlights the anticipated growth of the company over the next four years. It covers a statistical graph of total revenue and members growth.

 Home
Home