Software Icon
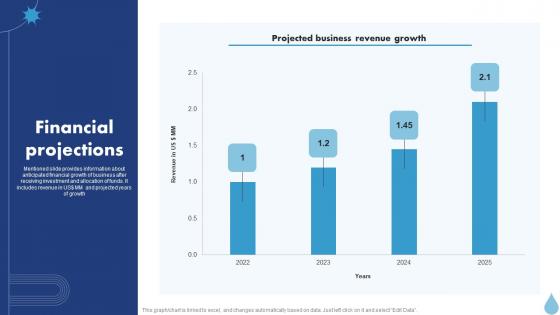
Financial Projections Water Purifier Investor Funding Elevator Pitch Deck
Mentioned slide provides information about anticipated financial growth of business after receiving investment and allocation of funds. It includes revenue in US dollar MM and projected years of growth. Present like a pro with Financial Projections Water Purifier Investor Funding Elevator Pitch Deck. Create beautiful presentations together with your team, using our easy-to-use presentation slides. Share your ideas in real-time and make changes on the fly by downloading our templates. So whether you are in the office, on the go, or in a remote location, you can stay in sync with your team and present your ideas with confidence. With Slidegeeks presentation got a whole lot easier. Grab these presentations today. Mentioned slide provides information about anticipated financial growth of business after receiving investment and allocation of funds. It includes revenue in US dollar MM and projected years of growth.
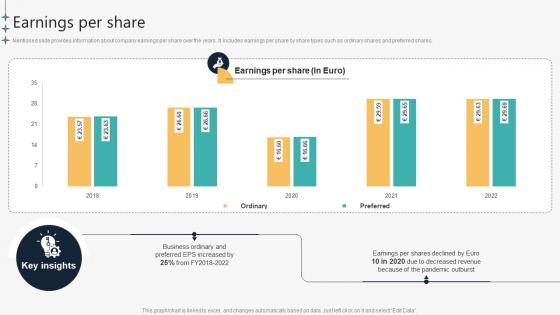
Earnings Per Share Automotive Manufacturing Company Profile CP SS V
Mentioned slide provides information about company earnings per share over the years. It includes earnings per share by share types such as ordinary shares and preferred shares.Slidegeeks is here to make your presentations a breeze with Earnings Per Share Automotive Manufacturing Company Profile CP SS V With our easy-to-use and customizable templates, you can focus on delivering your ideas rather than worrying about formatting. With a variety of designs to choose from, you are sure to find one that suits your needs. And with animations and unique photos, illustrations, and fonts, you can make your presentation pop. So whether you are giving a sales pitch or presenting to the board, make sure to check out Slidegeeks first Mentioned slide provides information about company earnings per share over the years. It includes earnings per share by share types such as ordinary shares and preferred shares.
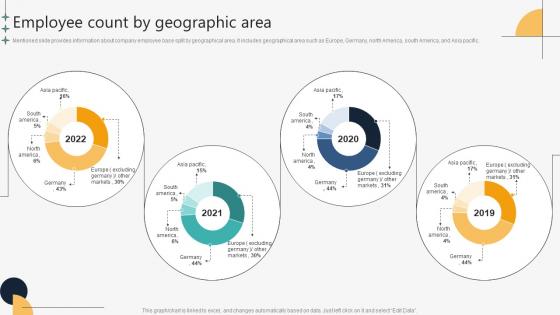
Employee Count By Geographic Area Automotive Manufacturing Company Profile CP SS V
Mentioned slide provides information about company employee base split by geographical area. It includes geographical area such as Europe, Germany, north America, south America, and Asia pacific.Find highly impressive Employee Count By Geographic Area Automotive Manufacturing Company Profile CP SS V on Slidegeeks to deliver a meaningful presentation. You can save an ample amount of time using these presentation templates. No need to worry to prepare everything from scratch because Slidegeeks experts have already done a huge research and work for you. You need to download Employee Count By Geographic Area Automotive Manufacturing Company Profile CP SS V for your upcoming presentation. All the presentation templates are 100 percent editable and you can change the color and personalize the content accordingly. Download now Mentioned slide provides information about company employee base split by geographical area. It includes geographical area such as Europe, Germany, north America, south America, and Asia pacific.
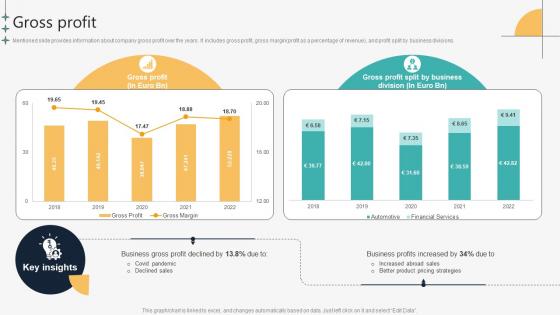
Gross Profit Automotive Manufacturing Company Profile CP SS V
Mentioned slide provides information about company gross profit over the years. It includes gross profit, gross margin profit as a percentage of revenue , and profit split by business divisions.Formulating a presentation can take up a lot of effort and time, so the content and message should always be the primary focus. The visuals of the PowerPoint can enhance the presenters message, so our Gross Profit Automotive Manufacturing Company Profile CP SS V was created to help save time. Instead of worrying about the design, the presenter can concentrate on the message while our designers work on creating the ideal templates for whatever situation is needed. Slidegeeks has experts for everything from amazing designs to valuable content, we have put everything into Gross Profit Automotive Manufacturing Company Profile CP SS V. Mentioned slide provides information about company gross profit over the years. It includes gross profit, gross marginandprofit as a percentage of revenueand, and profit split by business divisions.
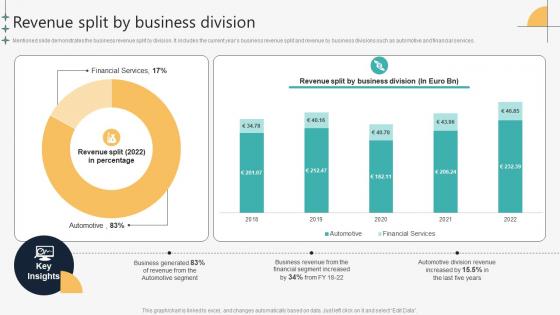
Revenue Split By Business Division Automotive Manufacturing Company Profile CP SS V
Mentioned slide demonstrates the business revenue split by division. It includes the current years business revenue split and revenue by business divisions such as automotive and financial services.Take your projects to the next level with our ultimate collection of Revenue Split By Business Division Automotive Manufacturing Company Profile CP SS V. Slidegeeks has designed a range of layouts that are perfect for representing task or activity duration, keeping track of all your deadlines at a glance. Tailor these designs to your exact needs and give them a truly corporate look with your own brand colors they will make your projects stand out from the rest Mentioned slide demonstrates the business revenue split by division. It includes the current years business revenue split and revenue by business divisions such as automotive and financial services.
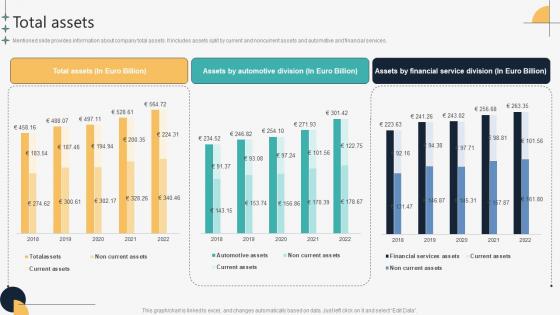
Total Assets Automotive Manufacturing Company Profile CP SS V
Mentioned slide provides information about company total assets. It includes assets split by current and noncurrent assets and automotive and financial services.Present like a pro with Total Assets Automotive Manufacturing Company Profile CP SS V. Create beautiful presentations together with your team, using our easy-to-use presentation slides. Share your ideas in real-time and make changes on the fly by downloading our templates. So whether you are in the office, on the go, or in a remote location, you can stay in sync with your team and present your ideas with confidence. With Slidegeeks presentation got a whole lot easier. Grab these presentations today. Mentioned slide provides information about company total assets. It includes assets split by current and noncurrent assets and automotive and financial services.
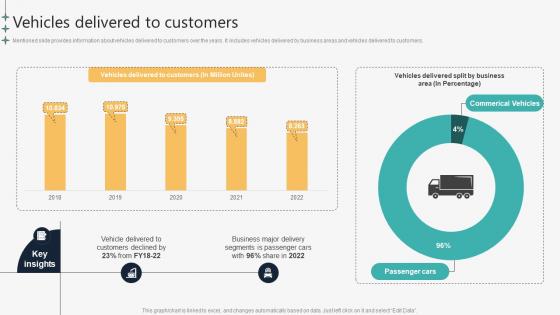
Vehicles Delivered To Customers Automotive Manufacturing Company Profile CP SS V
Mentioned slide provides information about vehicles delivered to customers over the years. It includes vehicles delivered by business areas and vehicles delivered to customers. Slidegeeks is here to make your presentations a breeze with Vehicles Delivered To Customers Automotive Manufacturing Company Profile CP SS V With our easy-to-use and customizable templates, you can focus on delivering your ideas rather than worrying about formatting. With a variety of designs to choose from, you are sure to find one that suits your needs. And with animations and unique photos, illustrations, and fonts, you can make your presentation pop. So whether you are giving a sales pitch or presenting to the board, make sure to check out Slidegeeks first Mentioned slide provides information about vehicles delivered to customers over the years. It includes vehicles delivered by business areas and vehicles delivered to customers.
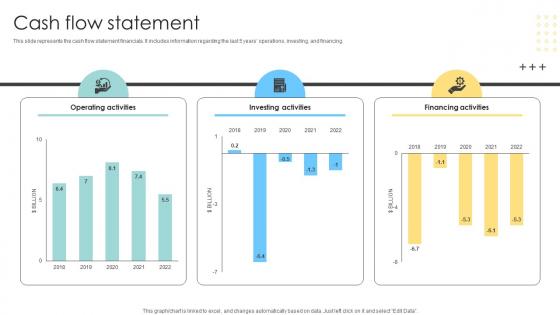
Cash Flow Statement Multinational Conglomerate Company Profile CP SS V
This slide represents the cash flow statement financials. It includes information regarding the last 5 years operations, investing, and financing.Boost your pitch with our creative Cash Flow Statement Multinational Conglomerate Company Profile CP SS V. Deliver an awe-inspiring pitch that will mesmerize everyone. Using these presentation templates you will surely catch everyones attention. You can browse the ppts collection on our website. We have researchers who are experts at creating the right content for the templates. So you do not have to invest time in any additional work. Just grab the template now and use them. This slide represents the cash flow statement financials. It includes information regarding the last 5 years operations, investing, and financing.
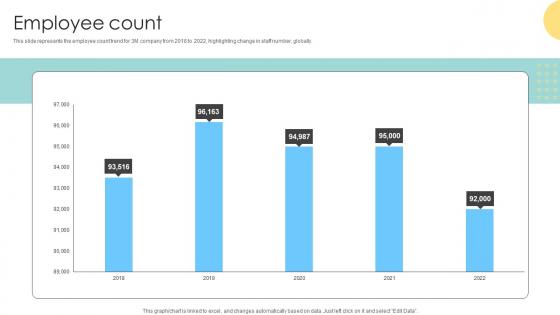
Employee Count Multinational Conglomerate Company Profile CP SS V
This slide represents the employee count trend for 3M company from 2018 to 2022, highlighting change in staff number, globally.Get a simple yet stunning designed Employee Count Multinational Conglomerate Company Profile CP SS V. It is the best one to establish the tone in your meetings. It is an excellent way to make your presentations highly effective. So, download this PPT today from Slidegeeks and see the positive impacts. Our easy-to-edit Employee Count Multinational Conglomerate Company Profile CP SS V can be your go-to option for all upcoming conferences and meetings. So, what are you waiting for Grab this template today. This slide represents the employee count trend for 3M company from 2018 to 2022, highlighting change in staff number, globally.
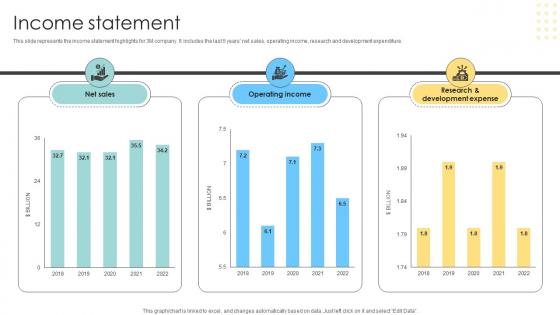
Income Statement Multinational Conglomerate Company Profile CP SS V
This slide represents the income statement highlights for 3M company. It includes the last 5 years net sales, operating income, research and development expenditure.Find highly impressive Income Statement Multinational Conglomerate Company Profile CP SS V on Slidegeeks to deliver a meaningful presentation. You can save an ample amount of time using these presentation templates. No need to worry to prepare everything from scratch because Slidegeeks experts have already done a huge research and work for you. You need to download Income Statement Multinational Conglomerate Company Profile CP SS V for your upcoming presentation. All the presentation templates are 100 percent editable and you can change the color and personalize the content accordingly. Download now This slide represents the income statement highlights for 3M company. It includes the last 5 years net sales, operating income, research and development expenditure.
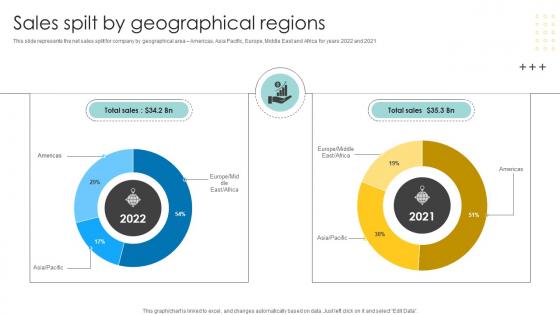
Sales Spilt By Geographical Regions Multinational Conglomerate Company Profile CP SS V
This slide represents the net sales split for company by geographical area Americas, Asia Pacific, Europe, Middle East and Africa for years 2022 and 2021.This Sales Spilt By Geographical Regions Multinational Conglomerate Company Profile CP SS V is perfect for any presentation, be it in front of clients or colleagues. It is a versatile and stylish solution for organizing your meetings. The Sales Spilt By Geographical Regions Multinational Conglomerate Company Profile CP SS V features a modern design for your presentation meetings. The adjustable and customizable slides provide unlimited possibilities for acing up your presentation. Slidegeeks has done all the homework before launching the product for you. So, do not wait, grab the presentation templates today This slide represents the net sales split for company by geographical area Americas, Asia Pacific, Europe, Middle East and Africa for years 2022 and 2021
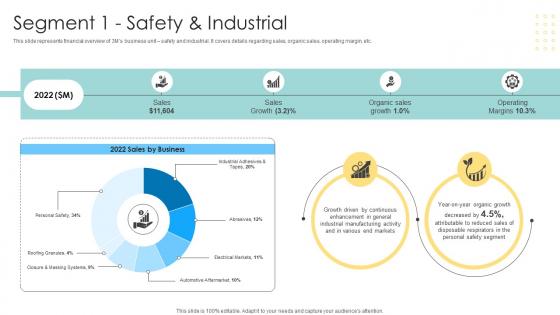
Segment 1 Safety And Industrial Multinational Conglomerate Company Profile CP SS V
This slide represents financial overview of 3Ms business unit safety and industrial. It covers details regarding sales, organic sales, operating margin, etc.Welcome to our selection of the Segment 1 Safety And Industrial Multinational Conglomerate Company Profile CP SS V. These are designed to help you showcase your creativity and bring your sphere to life. Planning and Innovation are essential for any business that is just starting out. This collection contains the designs that you need for your everyday presentations. All of our PowerPoints are 100 percent editable, so you can customize them to suit your needs. This multi-purpose template can be used in various situations. Grab these presentation templates today. This slide represents financial overview of 3Ms business unit safety and industrial. It covers details regarding sales, organic sales, operating margin, etc.
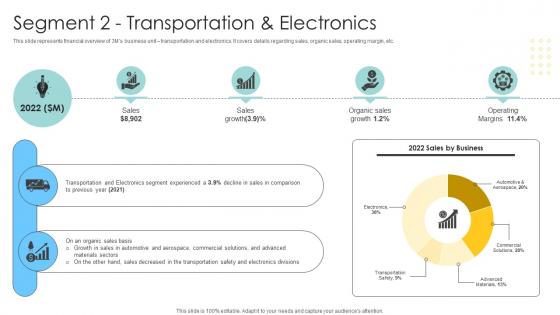
Segment 2 Transportation And Electronics Multinational Conglomerate Company Profile CP SS V
This slide represents financial overview of 3Ms business unit transportation and electronics. It covers details regarding sales, organic sales, operating margin, etc.Explore a selection of the finest Segment 2 Transportation And Electronics Multinational Conglomerate Company Profile CP SS V here. With a plethora of professionally designed and pre-made slide templates, you can quickly and easily find the right one for your upcoming presentation. You can use our Segment 2 Transportation And Electronics Multinational Conglomerate Company Profile CP SS V to effectively convey your message to a wider audience. Slidegeeks has done a lot of research before preparing these presentation templates. The content can be personalized and the slides are highly editable. Grab templates today from Slidegeeks. This slide represents financial overview of 3Ms business unit transportation and electronics. It covers details regarding sales, organic sales, operating margin, etc.
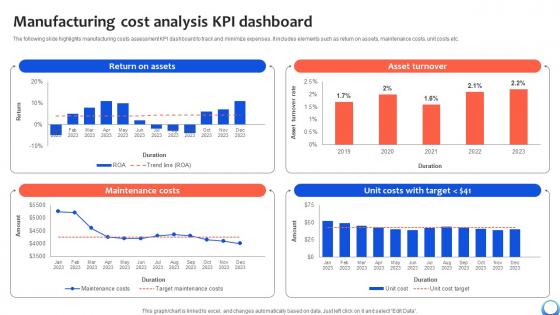
Manufacturing Cost Analysis KPI Dashboard Automating Production Process Strategy SS V
The following slide highlights manufacturing costs assessment KPI dashboard to track and minimize expenses. It includes elements such as return on assets, maintenance costs, unit costs etc. Make sure to capture your audiences attention in your business displays with our gratis customizable Manufacturing Cost Analysis KPI Dashboard Automating Production Process Strategy SS V. These are great for business strategies, office conferences, capital raising or task suggestions. If you desire to acquire more customers for your tech business and ensure they stay satisfied, create your own sales presentation with these plain slides. The following slide highlights manufacturing costs assessment KPI dashboard to track and minimize expenses. It includes elements such as return on assets, maintenance costs, unit costs etc.
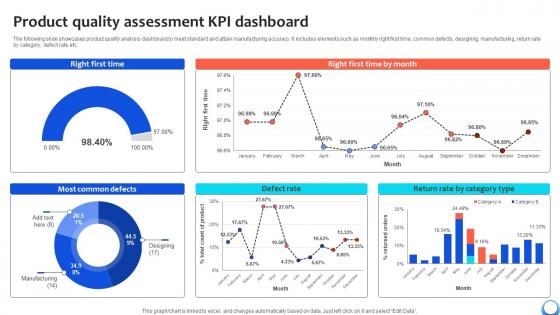
Product Quality Assessment KPI Dashboard Automating Production Process Strategy SS V
The following slide showcases product quality analysis dashboard to meet standard and attain manufacturing accuracy. It includes elements such as monthly right first time, common defects, designing, manufacturing, return rate by category, defect rate etc. Take your projects to the next level with our ultimate collection of Product Quality Assessment KPI Dashboard Automating Production Process Strategy SS V. Slidegeeks has designed a range of layouts that are perfect for representing task or activity duration, keeping track of all your deadlines at a glance. Tailor these designs to your exact needs and give them a truly corporate look with your own brand colors they will make your projects stand out from the rest The following slide showcases product quality analysis dashboard to meet standard and attain manufacturing accuracy. It includes elements such as monthly right first time, common defects, designing, manufacturing, return rate by category, defect rate etc.

Analysing Impact Of Customer Support Boosting Customer Retention Rate With Live Chat
The following slide depicts graphs to evaluate impact of implementing strategies for optimizing customer support. It includes elements such as customer satisfaction score CSAT , net promotor score NPS along with key insights. Create an editable Analysing Impact Of Customer Support Boosting Customer Retention Rate With Live Chat that communicates your idea and engages your audience. Whether you are presenting a business or an educational presentation, pre-designed presentation templates help save time. Analysing Impact Of Customer Support Boosting Customer Retention Rate With Live Chat is highly customizable and very easy to edit, covering many different styles from creative to business presentations. Slidegeeks has creative team members who have crafted amazing templates. So, go and get them without any delay. The following slide depicts graphs to evaluate impact of implementing strategies for optimizing customer support. It includes elements such as customer satisfaction score CSAT , net promotor score NPS along with key insights.
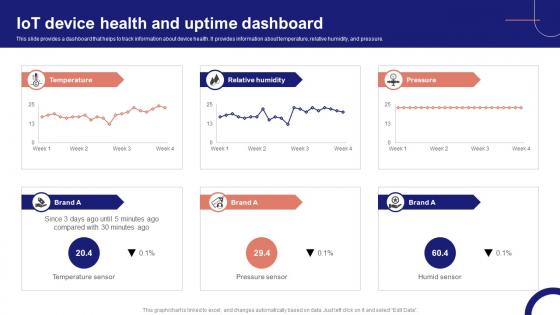
IoT Device Management Fundamentals IoT Device Health And Uptime Dashboard IoT Ss V
This slide provides a dashboard that helps to track information about device health. It provides information about temperature, relative humidity, and pressure. Take your projects to the next level with our ultimate collection of IoT Device Management Fundamentals IoT Device Health And Uptime Dashboard IoT SS V. Slidegeeks has designed a range of layouts that are perfect for representing task or activity duration, keeping track of all your deadlines at a glance. Tailor these designs to your exact needs and give them a truly corporate look with your own brand colors they will make your projects stand out from the rest This slide provides a dashboard that helps to track information about device health. It provides information about temperature, relative humidity, and pressure.
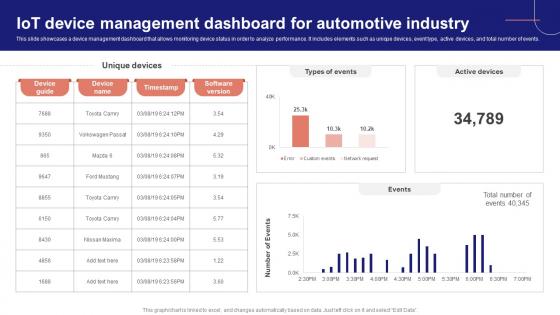
IoT Device Management Fundamentals IoT Device Management Dashboard For Automotive IoT Ss V
This slide showcases a device management dashboard that allows monitoring device status in order to analyze performance. It includes elements such as unique devices, event type, active devices, and total number of events. Create an editable IoT Device Management Fundamentals IoT Device Management Dashboard For Automotive IoT SS V that communicates your idea and engages your audience. Whether you are presenting a business or an educational presentation, pre-designed presentation templates help save time. IoT Device Management Fundamentals IoT Device Management Dashboard For Automotive IoT SS V is highly customizable and very easy to edit, covering many different styles from creative to business presentations. Slidegeeks has creative team members who have crafted amazing templates. So, go and get them without any delay. This slide showcases a device management dashboard that allows monitoring device status in order to analyze performance. It includes elements such as unique devices, event type, active devices, and total number of events.
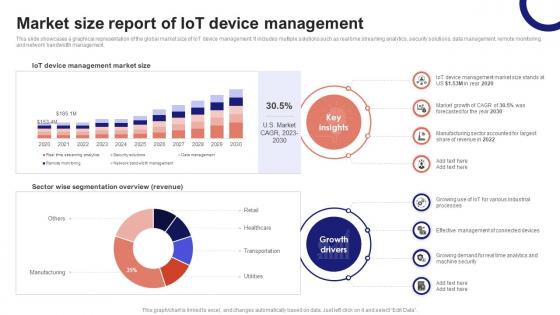
IoT Device Management Fundamentals Market Size Report Of IoT Device Management IoT Ss V
This slide showcases a graphical representation of the global market size of IoT device management. It includes multiple solutions such as real time streaming analytics, security solutions, data management, remote monitoring, and network bandwidth management. Slidegeeks has constructed IoT Device Management Fundamentals Market Size Report Of IoT Device Management IoT SS V after conducting extensive research and examination. These presentation templates are constantly being generated and modified based on user preferences and critiques from editors. Here, you will find the most attractive templates for a range of purposes while taking into account ratings and remarks from users regarding the content. This is an excellent jumping-off point to explore our content and will give new users an insight into our top-notch PowerPoint Templates. This slide showcases a graphical representation of the global market size of IoT device management. It includes multiple solutions such as real time streaming analytics, security solutions, data management, remote monitoring, and network bandwidth management.
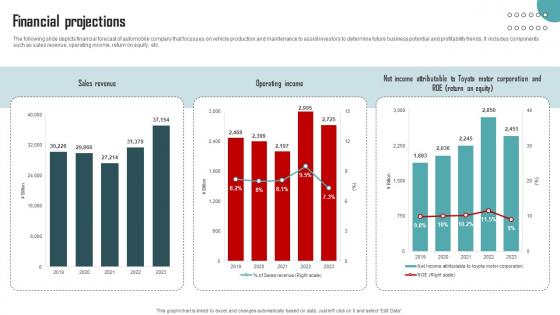
Financial Projections Vehicle Company Capital Funding Pitch Deck
The following slide depicts financial forecast of automobile company that focusses on vehicle production and maintenance to assist investors to determine future business potential and profitability trends. It includes components such as sales revenue, operating income, return on equity, etc. Present like a pro with Financial Projections Vehicle Company Capital Funding Pitch Deck. Create beautiful presentations together with your team, using our easy-to-use presentation slides. Share your ideas in real-time and make changes on the fly by downloading our templates. So whether you are in the office, on the go, or in a remote location, you can stay in sync with your team and present your ideas with confidence. With Slidegeeks presentation got a whole lot easier. Grab these presentations today. The following slide depicts financial forecast of automobile company that focusses on vehicle production and maintenance to assist investors to determine future business potential and profitability trends. It includes components such as sales revenue, operating income, return on equity, etc.
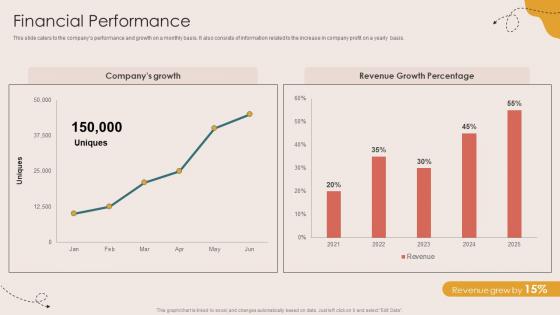
Financial Performance Children Events Listing Investor Funding Elevator Pitch Deck
This slide caters to the companys performance and growth on a monthly basis. It also consists of information related to the increase in company profit on a yearly basis. Present like a pro with Financial Performance Children Events Listing Investor Funding Elevator Pitch Deck. Create beautiful presentations together with your team, using our easy-to-use presentation slides. Share your ideas in real-time and make changes on the fly by downloading our templates. So whether you are in the office, on the go, or in a remote location, you can stay in sync with your team and present your ideas with confidence. With Slidegeeks presentation got a whole lot easier. Grab these presentations today. This slide caters to the companys performance and growth on a monthly basis. It also consists of information related to the increase in company profit on a yearly basis.
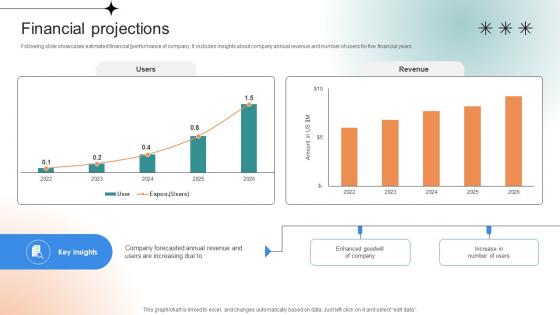
Financial Projections Professional Learning Platform Funding Pitch Deck
Following slide showcases estimated financial performance of company. It includes insights about company annual revenue and number of users for five financial years. Present like a pro with Financial Projections Professional Learning Platform Funding Pitch Deck. Create beautiful presentations together with your team, using our easy-to-use presentation slides. Share your ideas in real-time and make changes on the fly by downloading our templates. So whether you are in the office, on the go, or in a remote location, you can stay in sync with your team and present your ideas with confidence. With Slidegeeks presentation got a whole lot easier. Grab these presentations today. Following slide showcases estimated financial performance of company. It includes insights about company annual revenue and number of users for five financial years.
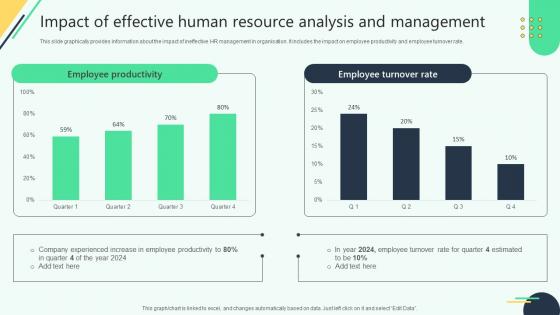
Impact Of Effective Human Resource Analysis And Analysing Hr Data For Effective Decision Making
This slide graphically provides information about the impact of ineffective HR management in organisation. It includes the impact on employee productivity and employee turnover rate. Slidegeeks has constructed Impact Of Effective Human Resource Analysis And Analysing Hr Data For Effective Decision Making after conducting extensive research and examination. These presentation templates are constantly being generated and modified based on user preferences and critiques from editors. Here, you will find the most attractive templates for a range of purposes while taking into account ratings and remarks from users regarding the content. This is an excellent jumping-off point to explore our content and will give new users an insight into our top-notch PowerPoint Templates. This slide graphically provides information about the impact of ineffective HR management in organisation. It includes the impact on employee productivity and employee turnover rate.
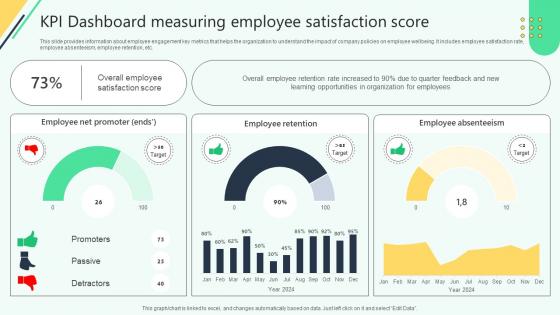
Kpi Dashboard Measuring Employee Satisfaction Score Analysing Hr Data For Effective Decision Making
This slide provides information about employee engagement key metrics that helps the organization to understand the impact of company policies on employee wellbeing. It includes employee satisfaction rate, employee absenteeism, employee retention, etc. Create an editable Kpi Dashboard Measuring Employee Satisfaction Score Analysing Hr Data For Effective Decision Making that communicates your idea and engages your audience. Whether you are presenting a business or an educational presentation, pre-designed presentation templates help save time. Kpi Dashboard Measuring Employee Satisfaction Score Analysing Hr Data For Effective Decision Making is highly customizable and very easy to edit, covering many different styles from creative to business presentations. Slidegeeks has creative team members who have crafted amazing templates. So, go and get them without any delay. This slide provides information about employee engagement key metrics that helps the organization to understand the impact of company policies on employee wellbeing. It includes employee satisfaction rate, employee absenteeism, employee retention, etc.
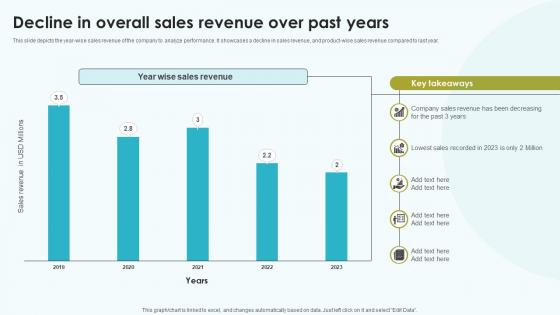
Elevating Sales Networks Decline In Overall Sales Revenue Over Past Years SA SS V
This slide depicts the year-wise sales revenue of the company to analyze performance. It showcases a decline in sales revenue, and product-wise sales revenue compared to last year. Slidegeeks is here to make your presentations a breeze with Elevating Sales Networks Decline In Overall Sales Revenue Over Past Years SA SS V With our easy-to-use and customizable templates, you can focus on delivering your ideas rather than worrying about formatting. With a variety of designs to choose from, you are sure to find one that suits your needs. And with animations and unique photos, illustrations, and fonts, you can make your presentation pop. So whether you are giving a sales pitch or presenting to the board, make sure to check out Slidegeeks first This slide depicts the year-wise sales revenue of the company to analyze performance. It showcases a decline in sales revenue, and product-wise sales revenue compared to last year.
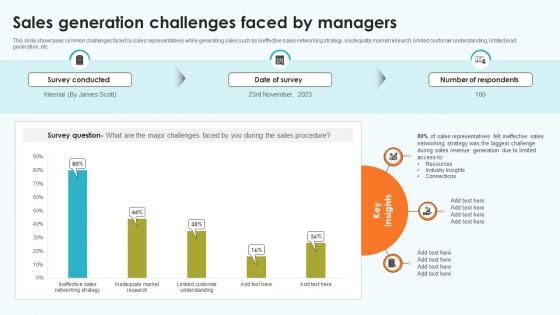
Elevating Sales Networks Sales Generation Challenges Faced By Managers SA SS V
This slide showcases common challenges faced by sales representatives while generating sales such as ineffective sales networking strategy, inadequate market research, limited customer understanding, limited lead generation, etc. Get a simple yet stunning designed Elevating Sales Networks Sales Generation Challenges Faced By Managers SA SS V. It is the best one to establish the tone in your meetings. It is an excellent way to make your presentations highly effective. So, download this PPT today from Slidegeeks and see the positive impacts. Our easy-to-edit Elevating Sales Networks Sales Generation Challenges Faced By Managers SA SS V can be your go-to option for all upcoming conferences and meetings. So, what are you waiting for Grab this template today. This slide showcases common challenges faced by sales representatives while generating sales such as ineffective sales networking strategy, inadequate market research, limited customer understanding, limited lead generation, etc.
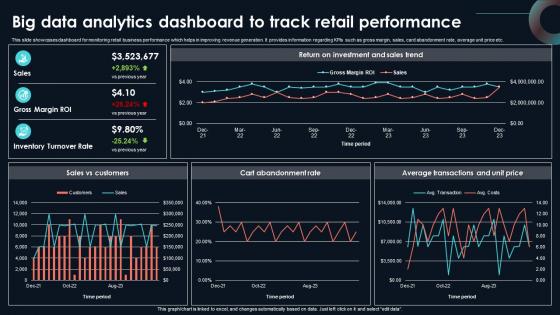
Big Data Analytics Dashboard To Track Developing Strategic Insights Using Big Data Analytics SS V
This slide showcases dashboard for monitoring retail business performance which helps in improving revenue generation. It provides information regarding KPIs such as gross margin, sales, card abandonment rate, average unit price etc. If your project calls for a presentation, then Slidegeeks is your go-to partner because we have professionally designed, easy-to-edit templates that are perfect for any presentation. After downloading, you can easily edit Big Data Analytics Dashboard To Track Developing Strategic Insights Using Big Data Analytics SS V and make the changes accordingly. You can rearrange slides or fill them with different images. Check out all the handy templates This slide showcases dashboard for monitoring retail business performance which helps in improving revenue generation. It provides information regarding KPIs such as gross margin, sales, card abandonment rate, average unit price etc.
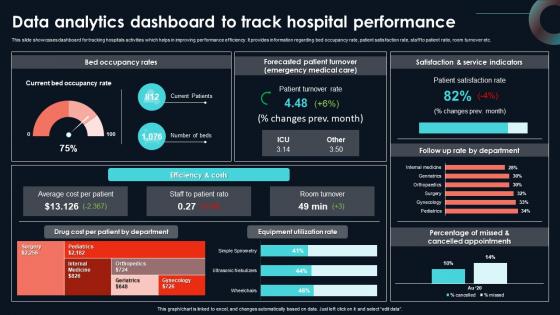
Data Analytics Dashboard To Track Hospital Developing Strategic Insights Using Big Data Analytics SS V
This slide showcases dashboard for tracking hospitals activities which helps in improving performance efficiency. It provides information regarding bed occupancy rate, patient satisfaction rate, staff to patient ratio, room turnover etc. The best PPT templates are a great way to save time, energy, and resources. Slidegeeks have 100 percent editable powerpoint slides making them incredibly versatile. With these quality presentation templates, you can create a captivating and memorable presentation by combining visually appealing slides and effectively communicating your message. Download Data Analytics Dashboard To Track Hospital Developing Strategic Insights Using Big Data Analytics SS V from Slidegeeks and deliver a wonderful presentation. This slide showcases dashboard for tracking hospitals activities which helps in improving performance efficiency. It provides information regarding bed occupancy rate, patient satisfaction rate, staff to patient ratio, room turnover etc.
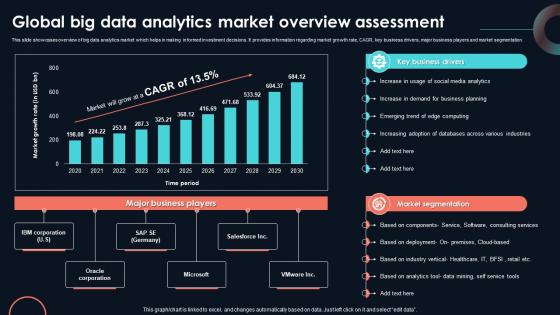
Global Big Data Analytics Market Developing Strategic Insights Using Big Data Analytics SS V
This slide showcases overview of big data analytics market which helps in making informed investment decisions. It provides information regarding market growth rate, CAGR, key business drivers, major business players and market segmentation. Slidegeeks has constructed Global Big Data Analytics Market Developing Strategic Insights Using Big Data Analytics SS V after conducting extensive research and examination. These presentation templates are constantly being generated and modified based on user preferences and critiques from editors. Here, you will find the most attractive templates for a range of purposes while taking into account ratings and remarks from users regarding the content. This is an excellent jumping-off point to explore our content and will give new users an insight into our top-notch PowerPoint Templates. This slide showcases overview of big data analytics market which helps in making informed investment decisions. It provides information regarding market growth rate, CAGR, key business drivers, major business players and market segmentation.
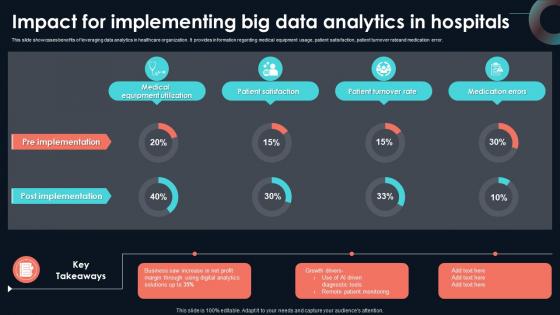
Impact For Implementing Big Data Analytics Developing Strategic Insights Using Big Data Analytics SS V
This slide showcases benefits of leveraging data analytics in healthcare organization. It provides information regarding medical equipment usage, patient satisfaction, patient turnover rateand medication error. Take your projects to the next level with our ultimate collection of Impact For Implementing Big Data Analytics Developing Strategic Insights Using Big Data Analytics SS V. Slidegeeks has designed a range of layouts that are perfect for representing task or activity duration, keeping track of all your deadlines at a glance. Tailor these designs to your exact needs and give them a truly corporate look with your own brand colors they will make your projects stand out from the rest This slide showcases benefits of leveraging data analytics in healthcare organization. It provides information regarding medical equipment usage, patient satisfaction, patient turnover rateand medication error.
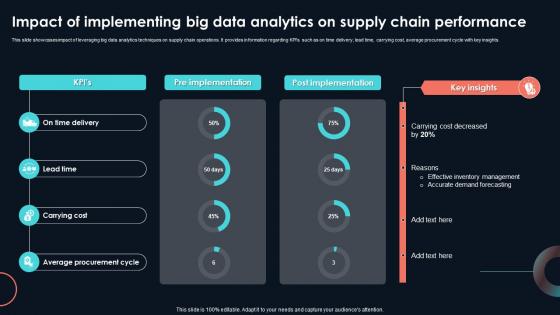
Impact Of Implementing Big Data Analytics On Developing Strategic Insights Using Big Data Analytics SS V
This slide showcases impact of leveraging big data analytics techniques on supply chain operations. It provides information regarding KPIs such as on time delivery, lead time, carrying cost, average procurement cycle with key insights. Boost your pitch with our creative Impact Of Implementing Big Data Analytics On Developing Strategic Insights Using Big Data Analytics SS V. Deliver an awe-inspiring pitch that will mesmerize everyone. Using these presentation templates you will surely catch everyones attention. You can browse the ppts collection on our website. We have researchers who are experts at creating the right content for the templates. So you do not have to invest time in any additional work. Just grab the template now and use them. This slide showcases impact of leveraging big data analytics techniques on supply chain operations. It provides information regarding KPIs such as on time delivery, lead time, carrying cost, average procurement cycle with key insights.
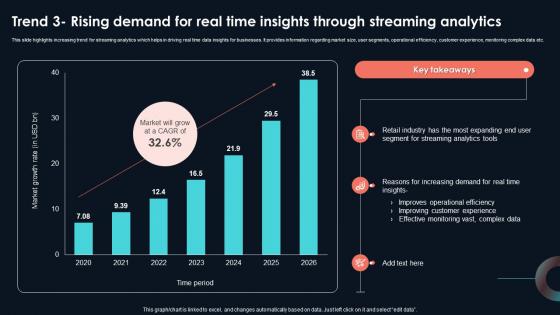
Trend 3 Rising Demand For Real Time Insights Developing Strategic Insights Using Big Data Analytics SS V
This slide highlights increasing trend for streaming analytics which helps in driving real time data insights for businesses. It provides information regarding market size, user segments, operational efficiency, customer experience, monitoring complex data etc. Take your projects to the next level with our ultimate collection of Trend 3 Rising Demand For Real Time Insights Developing Strategic Insights Using Big Data Analytics SS V. Slidegeeks has designed a range of layouts that are perfect for representing task or activity duration, keeping track of all your deadlines at a glance. Tailor these designs to your exact needs and give them a truly corporate look with your own brand colors they will make your projects stand out from the rest This slide highlights increasing trend for streaming analytics which helps in driving real time data insights for businesses. It provides information regarding market size, user segments, operational efficiency, customer experience, monitoring complex data etc.
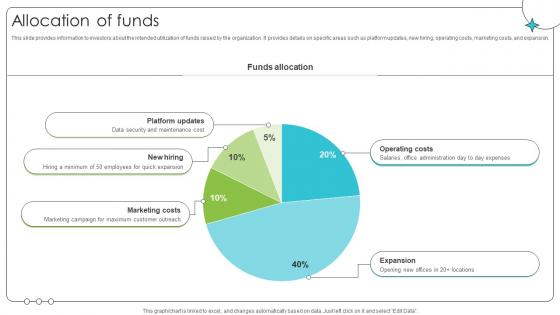
Allocation Of Funds Investor Oriented Urbanlogiq Fundraising Deck
This slide provides information to investors about the intended utilization of funds raised by the organization. It provides details on specific areas such as platform updates, new hiring, operating costs, marketing costs, and expansion. Find a pre-designed and impeccable Allocation Of Funds Investor Oriented Urbanlogiq Fundraising Deck. The templates can ace your presentation without additional effort. You can download these easy-to-edit presentation templates to make your presentation stand out from others. So, what are you waiting for Download the template from Slidegeeks today and give a unique touch to your presentation. This slide provides information to investors about the intended utilization of funds raised by the organization. It provides details on specific areas such as platform updates, new hiring, operating costs, marketing costs, and expansion.
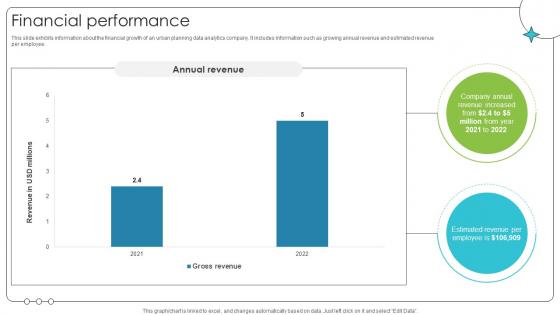
Financial Performance Investor Oriented Urbanlogiq Fundraising Deck
This slide exhibits information about the financial growth of an urban planning data analytics company. It includes information such as growing annual revenue and estimated revenue per employee. Present like a pro with Financial Performance Investor Oriented Urbanlogiq Fundraising Deck. Create beautiful presentations together with your team, using our easy-to-use presentation slides. Share your ideas in real-time and make changes on the fly by downloading our templates. So whether you are in the office, on the go, or in a remote location, you can stay in sync with your team and present your ideas with confidence. With Slidegeeks presentation got a whole lot easier. Grab these presentations today. This slide exhibits information about the financial growth of an urban planning data analytics company. It includes information such as growing annual revenue and estimated revenue per employee.
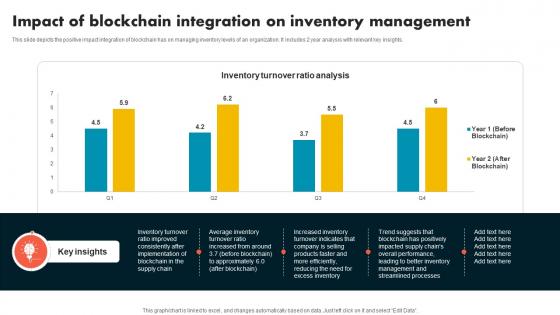
Impact Of Blockchain Integration On Inventory Supply Chain Evolution Harnessing The Power BCT SS V
This slide depicts the positive impact integration of blockchain has on managing inventory levels of an organization. It includes 2 year analysis with relevant key insights. Boost your pitch with our creative Impact Of Blockchain Integration On Inventory Supply Chain Evolution Harnessing The Power BCT SS V. Deliver an awe-inspiring pitch that will mesmerize everyone. Using these presentation templates you will surely catch everyones attention. You can browse the ppts collection on our website. We have researchers who are experts at creating the right content for the templates. So you do not have to invest time in any additional work. Just grab the template now and use them. This slide depicts the positive impact integration of blockchain has on managing inventory levels of an organization. It includes 2 year analysis with relevant key insights.
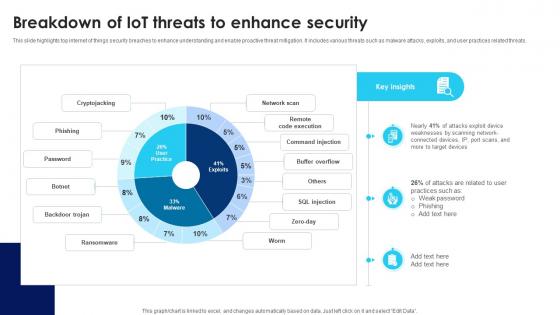
Building Trust With IoT Security Breakdown Of IoT Threats To Enhance Security IoT SS V
This slide highlights top internet of things security breaches to enhance understanding and enable proactive threat mitigation. It includes various threats such as malware attacks, exploits, and user practices related threats. Present like a pro with Building Trust With IoT Security Breakdown Of IoT Threats To Enhance Security IoT SS V. Create beautiful presentations together with your team, using our easy-to-use presentation slides. Share your ideas in real-time and make changes on the fly by downloading our templates. So whether you are in the office, on the go, or in a remote location, you can stay in sync with your team and present your ideas with confidence. With Slidegeeks presentation got a whole lot easier. Grab these presentations today. This slide highlights top internet of things security breaches to enhance understanding and enable proactive threat mitigation. It includes various threats such as malware attacks, exploits, and user practices related threats.
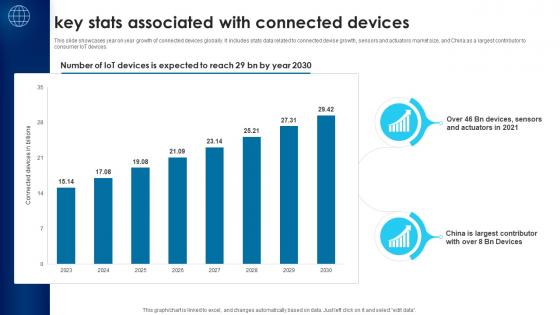
Building Trust With IoT Security Key Stats Associated With Connected Devices IoT SS V
This slide showcases year on year growth of connected devices globally. It includes stats data related to connected devise growth, sensors and actuators market size, and China as a largest contributor to consumer IoT devices. Find a pre-designed and impeccable Building Trust With IoT Security Key Stats Associated With Connected Devices IoT SS V. The templates can ace your presentation without additional effort. You can download these easy-to-edit presentation templates to make your presentation stand out from others. So, what are you waiting for Download the template from Slidegeeks today and give a unique touch to your presentation. This slide showcases year on year growth of connected devices globally. It includes stats data related to connected devise growth, sensors and actuators market size, and China as a largest contributor to consumer IoT devices.

Empowering The Future Smart Meters Dashboard For Effective Energy IoT SS V
This slide exhibits a dashboard that provides real-time energy specific information from multiple smart meters. It includes elements such as voltage, energy consumption, energy meters, alarms alert, and amperage Welcome to our selection of the Empowering The Future Smart Meters Dashboard For Effective Energy IoT SS V. These are designed to help you showcase your creativity and bring your sphere to life. Planning and Innovation are essential for any business that is just starting out. This collection contains the designs that you need for your everyday presentations. All of our PowerPoints are 100Percent editable, so you can customize them to suit your needs. This multi-purpose template can be used in various situations. Grab these presentation templates today. This slide exhibits a dashboard that provides real-time energy specific information from multiple smart meters. It includes elements such as voltage, energy consumption, energy meters, alarms alert, and amperage
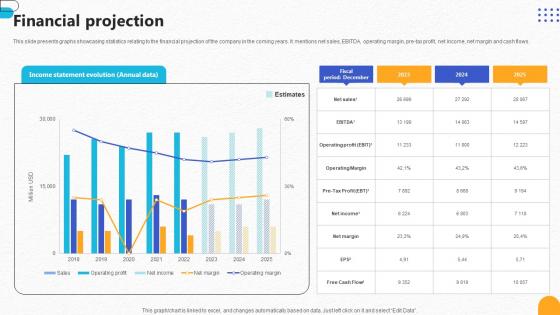
Financial Projection Pharmaceutical R And D Company Pitch Deck
This slide presents graphs showcasing statistics relating to the financial projection of the company in the coming years. It mentions net sales, EBITDA, operating margin, pre-tax profit, net income, net margin and cash flows. Slidegeeks is here to make your presentations a breeze with Financial Projection Pharmaceutical R And D Company Pitch Deck With our easy-to-use and customizable templates, you can focus on delivering your ideas rather than worrying about formatting. With a variety of designs to choose from, you are sure to find one that suits your needs. And with animations and unique photos, illustrations, and fonts, you can make your presentation pop. So whether you are giving a sales pitch or presenting to the board, make sure to check out Slidegeeks first This slide presents graphs showcasing statistics relating to the financial projection of the company in the coming years. It mentions net sales, EBITDA, operating margin, pre-tax profit, net income, net margin and cash flows.
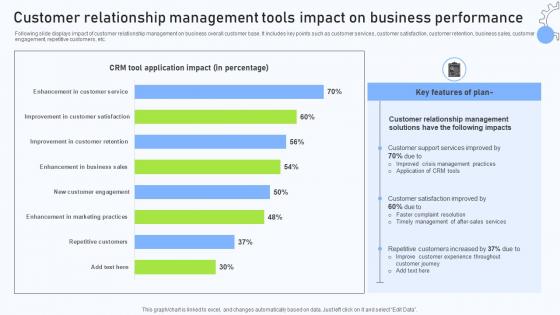
A84 Relationship Management Automation Customer Relationship Management Tools Impact
Following slide displays impact of customer relationship management on business overall customer base. It includes key points such as customer services, customer satisfaction, customer retention, business sales, customer engagement, repetitive customers, etc. Boost your pitch with our creative A84 Relationship Management Automation Customer Relationship Management Tools Impact. Deliver an awe-inspiring pitch that will mesmerize everyone. Using these presentation templates you will surely catch everyones attention. You can browse the ppts collection on our website. We have researchers who are experts at creating the right content for the templates. So you do not have to invest time in any additional work. Just grab the template now and use them. Following slide displays impact of customer relationship management on business overall customer base. It includes key points such as customer services, customer satisfaction, customer retention, business sales, customer engagement, repetitive customers, etc.
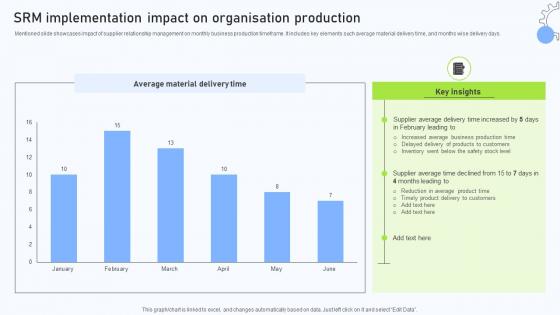
Relationship Management Automation SRM Implementation Impact On Organisation Production
Mentioned slide showcases impact of supplier relationship management on monthly business production timeframe. It includes key elements such average material delivery time, and months wise delivery days. From laying roadmaps to briefing everything in detail, our templates are perfect for you. You can set the stage with your presentation slides. All you have to do is download these easy-to-edit and customizable templates. Relationship Management Automation SRM Implementation Impact On Organisation Production will help you deliver an outstanding performance that everyone would remember and praise you for. Do download this presentation today. Mentioned slide showcases impact of supplier relationship management on monthly business production timeframe. It includes key elements such average material delivery time, and months wise delivery days.
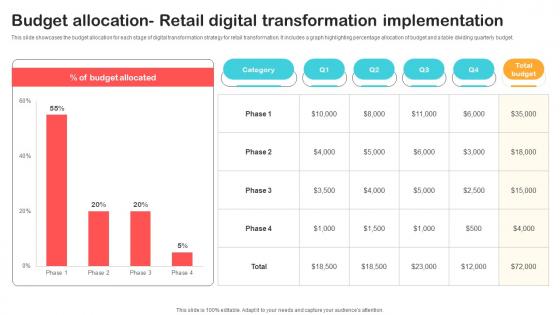
Budget Allocation Retail Digital Transformation Optimizing Retail Operations With Digital DT SS V
This slide showcases the budget allocation for each stage of digital transformation strategy for retail transformation. It includes a graph highlighting percentage allocation of budget and a table dividing quarterly budget.From laying roadmaps to briefing everything in detail, our templates are perfect for you. You can set the stage with your presentation slides. All you have to do is download these easy-to-edit and customizable templates. Budget Allocation Retail Digital Transformation Optimizing Retail Operations With Digital DT SS V will help you deliver an outstanding performance that everyone would remember and praise you for. Do download this presentation today. This slide showcases the budget allocation for each stage of digital transformation strategy for retail transformation. It includes a graph highlighting percentage allocation of budget and a table dividing quarterly budget.
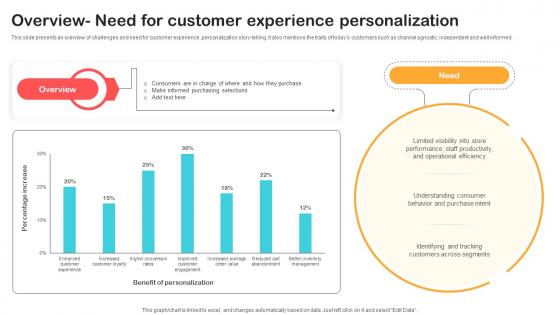
Overview Need For Customer Experience Personalization Optimizing Retail Operations With Digital DT SS V
This slide presents an overview of challenges and need for customer experience ,personalization story-telling. It also mentions the traits of todays customers such as channel agnostic, independent and well informed.Make sure to capture your audiences attention in your business displays with our gratis customizable Overview Need For Customer Experience Personalization Optimizing Retail Operations With Digital DT SS V. These are great for business strategies, office conferences, capital raising or task suggestions. If you desire to acquire more customers for your tech business and ensure they stay satisfied, create your own sales presentation with these plain slides. This slide presents an overview of challenges and need for customer experience ,personalization story-telling. It also mentions the traits of todays customers such as channel agnostic, independent and well informed.
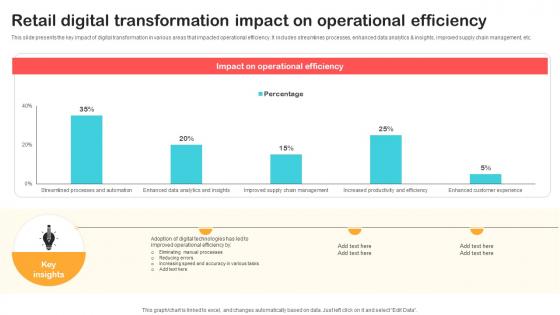
Retail Digital Transformation Impact On Operational Optimizing Retail Operations With Digital DT SS V
This slide presents the key impact of digital transformation in various areas that impacted operational efficiency. It includes streamlines processes, enhanced data analytics and insights, improved supply chain management, etc.Explore a selection of the finest Retail Digital Transformation Impact On Operational Optimizing Retail Operations With Digital DT SS V here. With a plethora of professionally designed and pre-made slide templates, you can quickly and easily find the right one for your upcoming presentation. You can use our Retail Digital Transformation Impact On Operational Optimizing Retail Operations With Digital DT SS V to effectively convey your message to a wider audience. Slidegeeks has done a lot of research before preparing these presentation templates. The content can be personalized and the slides are highly editable. Grab templates today from Slidegeeks. This slide presents the key impact of digital transformation in various areas that impacted operational efficiency. It includes streamlines processes, enhanced data analytics and insights, improved supply chain management, etc.
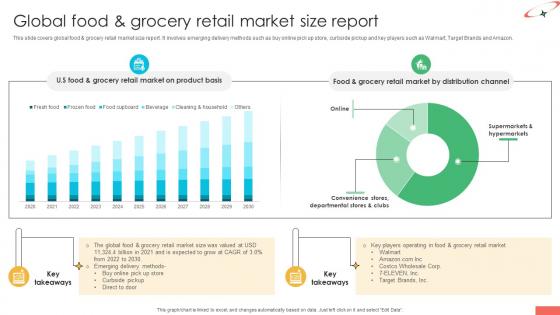
Marketing Strategies For Effective Global Food And Grocery Retail Market Size Report
This slide covers global food and grocery retail market size report. It involves emerging delivery methods such as buy online pick up store, curbside pickup and key players such as Walmart, Target Brands and Amazon. If your project calls for a presentation, then Slidegeeks is your go-to partner because we have professionally designed, easy-to-edit templates that are perfect for any presentation. After downloading, you can easily edit Marketing Strategies For Effective Global Food And Grocery Retail Market Size Report and make the changes accordingly. You can rearrange slides or fill them with different images. Check out all the handy templates This slide covers global food and grocery retail market size report. It involves emerging delivery methods such as buy online pick up store, curbside pickup and key players such as Walmart, Target Brands and Amazon.
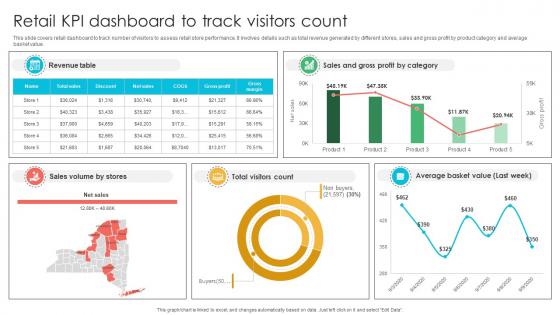
Marketing Strategies For Effective Retail KPI Dashboard To Track Visitors Count
This slide covers retail dashboard to track number of visitors to assess retail store performance. It involves details such as total revenue generated by different stores, sales and gross profit by product category and average basket value. Want to ace your presentation in front of a live audience Our Marketing Strategies For Effective Retail KPI Dashboard To Track Visitors Count can help you do that by engaging all the users towards you. Slidegeeks experts have put their efforts and expertise into creating these impeccable powerpoint presentations so that you can communicate your ideas clearly. Moreover, all the templates are customizable, and easy-to-edit and downloadable. Use these for both personal and commercial use. This slide covers retail dashboard to track number of visitors to assess retail store performance. It involves details such as total revenue generated by different stores, sales and gross profit by product category and average basket value.
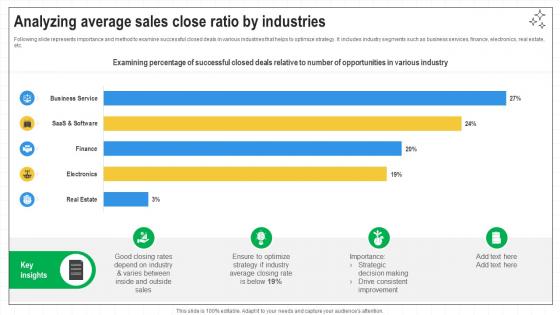
Closing Techniques To Seal Analyzing Average Sales Close Ratio By Industries SA SS V
Following slide represents importance and method to examine successful closed deals in various industries that helps to optimize strategy. It includes industry segments such as business services, finance, electronics, real estate, etc. Create an editable Closing Techniques To Seal Analyzing Average Sales Close Ratio By Industries SA SS V that communicates your idea and engages your audience. Whether you are presenting a business or an educational presentation, pre-designed presentation templates help save time. Closing Techniques To Seal Analyzing Average Sales Close Ratio By Industries SA SS V is highly customizable and very easy to edit, covering many different styles from creative to business presentations. Slidegeeks has creative team members who have crafted amazing templates. So, go and get them without any delay. Following slide represents importance and method to examine successful closed deals in various industries that helps to optimize strategy. It includes industry segments such as business services, finance, electronics, real estate, etc.
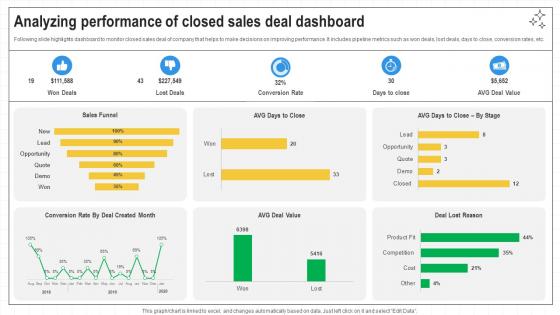
Closing Techniques To Seal Analyzing Performance Of Closed Sales Deal Dashboard SA SS V
Following slide highlights dashboard to monitor closed sales deal of company that helps to make decisions on improving performance. It includes pipeline metrics such as won deals, lost deals, days to close, conversion rates, etc. Want to ace your presentation in front of a live audience Our Closing Techniques To Seal Analyzing Performance Of Closed Sales Deal Dashboard SA SS V can help you do that by engaging all the users towards you. Slidegeeks experts have put their efforts and expertise into creating these impeccable powerpoint presentations so that you can communicate your ideas clearly. Moreover, all the templates are customizable, and easy-to-edit and downloadable. Use these for both personal and commercial use. Following slide highlights dashboard to monitor closed sales deal of company that helps to make decisions on improving performance. It includes pipeline metrics such as won deals, lost deals, days to close, conversion rates, etc.
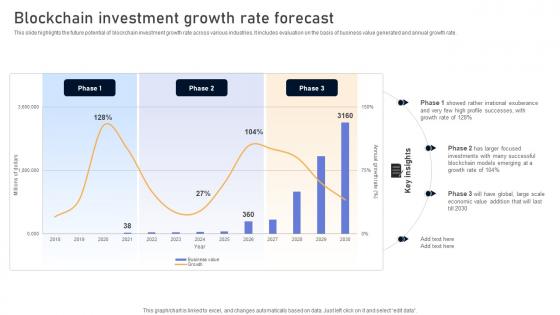
Comprehensive Look At Blockchain Investment Growth Rate Forecast BCT SS V
This slide highlights the future potential of blockchain investment growth rate across various industries. It includes evaluation on the basis of business value generated and annual growth rate. Slidegeeks has constructed Comprehensive Look At Blockchain Investment Growth Rate Forecast BCT SS V after conducting extensive research and examination. These presentation templates are constantly being generated and modified based on user preferences and critiques from editors. Here, you will find the most attractive templates for a range of purposes while taking into account ratings and remarks from users regarding the content. This is an excellent jumping-off point to explore our content and will give new users an insight into our top-notch PowerPoint Templates. This slide highlights the future potential of blockchain investment growth rate across various industries. It includes evaluation on the basis of business value generated and annual growth rate.

Global Market Size Of E Waste Management System Implementation Of E Waste Guidelines
This slide exhibits a graphical representation of the global market size of smart waste management systems. It includes key growth drivers such as rapid urbanisation and industrialization, increased smart city initiatives, etc. If your project calls for a presentation, then Slidegeeks is your go-to partner because we have professionally designed, easy-to-edit templates that are perfect for any presentation. After downloading, you can easily edit Global Market Size Of E Waste Management System Implementation Of E Waste Guidelines and make the changes accordingly. You can rearrange slides or fill them with different images. Check out all the handy templates This slide exhibits a graphical representation of the global market size of smart waste management systems. It includes key growth drivers such as rapid urbanisation and industrialization, increased smart city initiatives, etc.
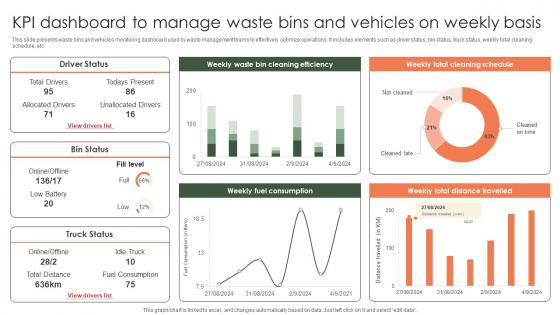
Kpi Dashboard To Manage Waste Bins And Vehicles On Weekly Implementation Of E Waste Guidelines
This slide presents waste bins and vehicles monitoring dashboard used by waste management teams to effectively optimize operations. It includes elements such as driver status, bin status, truck status, weekly total cleaning schedule, etc. Welcome to our selection of the Kpi Dashboard To Manage Waste Bins And Vehicles On Weekly Implementation Of E Waste Guidelines. These are designed to help you showcase your creativity and bring your sphere to life. Planning and Innovation are essential for any business that is just starting out. This collection contains the designs that you need for your everyday presentations. All of our PowerPoints are 100 percent editable, so you can customize them to suit your needs. This multi-purpose template can be used in various situations. Grab these presentation templates today. This slide presents waste bins and vehicles monitoring dashboard used by waste management teams to effectively optimize operations. It includes elements such as driver status, bin status, truck status, weekly total cleaning schedule, etc.
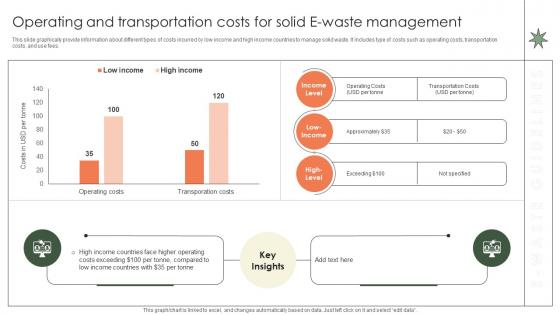
Operating And Transportation Costs For Solid E Waste Implementation Of E Waste Guidelines
This slide graphically provide information about different types of costs incurred by low income and high income countries to manage solid waste. It includes type of costs such as operating costs, transportation costs, and use fees. The best PPT templates are a great way to save time, energy, and resources. Slidegeeks have 100 percent editable powerpoint slides making them incredibly versatile. With these quality presentation templates, you can create a captivating and memorable presentation by combining visually appealing slides and effectively communicating your message. Download Operating And Transportation Costs For Solid E Waste Implementation Of E Waste Guidelines from Slidegeeks and deliver a wonderful presentation. This slide graphically provide information about different types of costs incurred by low income and high income countries to manage solid waste. It includes type of costs such as operating costs, transportation costs, and use fees.
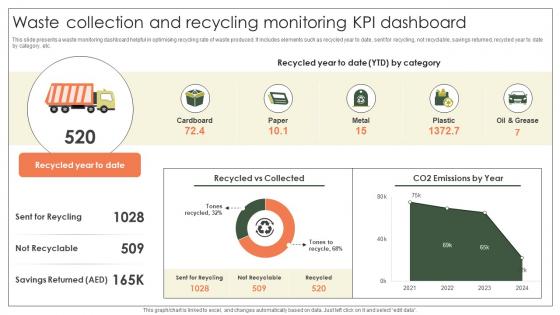
Waste Collection And Recycling Monitoring Kpi Dashboard Implementation Of E Waste Guidelines
This slide presents a waste monitoring dashboard helpful in optimising recycling rate of waste produced. It includes elements such as recycled year to date, sent for recycling, not recyclable, savings returned, recycled year to date by category, etc. From laying roadmaps to briefing everything in detail, our templates are perfect for you. You can set the stage with your presentation slides. All you have to do is download these easy-to-edit and customizable templates. Waste Collection And Recycling Monitoring Kpi Dashboard Implementation Of E Waste Guidelines will help you deliver an outstanding performance that everyone would remember and praise you for. Do download this presentation today. This slide presents a waste monitoring dashboard helpful in optimising recycling rate of waste produced. It includes elements such as recycled year to date, sent for recycling, not recyclable, savings returned, recycled year to date by category, etc.
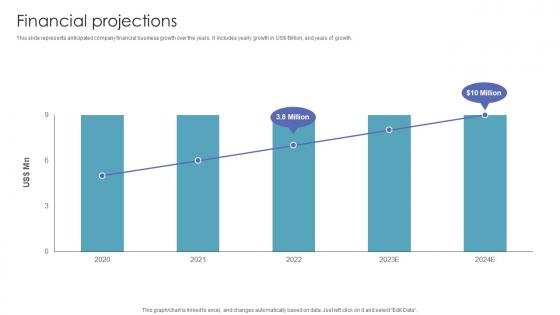
Financial Projections Investor Funding Pitch Deck For Automated Ar Platform
This slide represents anticipated company financial business growth over the years. It includes yearly growth in US dollar Billion, and years of growth.Slidegeeks is here to make your presentations a breeze with Financial Projections Investor Funding Pitch Deck For Automated Ar Platform With our easy-to-use and customizable templates, you can focus on delivering your ideas rather than worrying about formatting. With a variety of designs to choose from, you are sure to find one that suits your needs. And with animations and unique photos, illustrations, and fonts, you can make your presentation pop. So whether you are giving a sales pitch or presenting to the board, make sure to check out Slidegeeks first This slide represents anticipated company financial business growth over the years. It includes yearly growth in US dollar Billion, and years of growth.
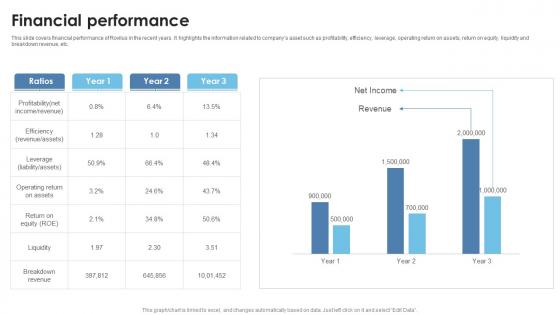
Financial Performance Thermal Battery Packs Manufacturer Investor Funding Elevator Pitch Deck
This slide covers financial performance of Rovilus in the recent years. It highlights the information related to companys asset such as profitability, efficiency, leverage, operating return on assets, return on equity, liquidity and breakdown revenue, etc. From laying roadmaps to briefing everything in detail, our templates are perfect for you. You can set the stage with your presentation slides. All you have to do is download these easy-to-edit and customizable templates. Financial Performance Thermal Battery Packs Manufacturer Investor Funding Elevator Pitch Deck will help you deliver an outstanding performance that everyone would remember and praise you for. Do download this presentation today. This slide covers financial performance of Rovilus in the recent years. It highlights the information related to companys asset such as profitability, efficiency, leverage, operating return on assets, return on equity, liquidity and breakdown revenue, etc.
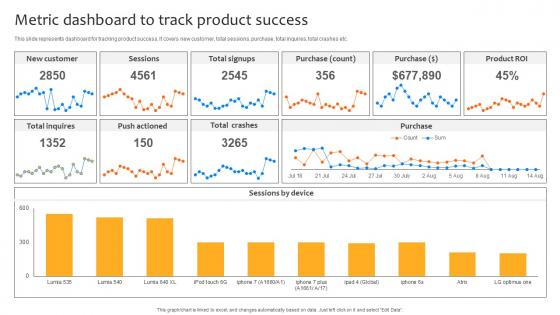
Deploying Strategies For Business Metric Dashboard To Track Product Success Strategy SS V
This slide represents dashboard for tracking product success. It covers new customer, total sessions, purchase, total inquires, total crashes etc. Explore a selection of the finest Deploying Strategies For Business Metric Dashboard To Track Product Success Strategy SS V here. With a plethora of professionally designed and pre-made slide templates, you can quickly and easily find the right one for your upcoming presentation. You can use our Deploying Strategies For Business Metric Dashboard To Track Product Success Strategy SS V to effectively convey your message to a wider audience. Slidegeeks has done a lot of research before preparing these presentation templates. The content can be personalized and the slides are highly editable. Grab templates today from Slidegeeks. This slide represents dashboard for tracking product success. It covers new customer, total sessions, purchase, total inquires, total crashes etc.
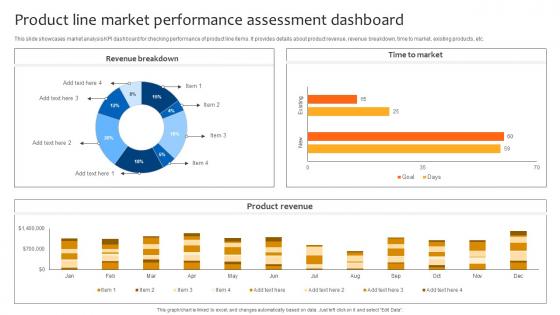
Deploying Strategies For Business Product Line Market Performance Assessment Dashboard Strategy SS V
This slide showcases market analysis KPI dashboard for checking performance of product line items. It provides details about product revenue, revenue breakdown, time to market, existing products, etc. Take your projects to the next level with our ultimate collection of Deploying Strategies For Business Product Line Market Performance Assessment Dashboard Strategy SS V. Slidegeeks has designed a range of layouts that are perfect for representing task or activity duration, keeping track of all your deadlines at a glance. Tailor these designs to your exact needs and give them a truly corporate look with your own brand colors they will make your projects stand out from the rest This slide showcases market analysis KPI dashboard for checking performance of product line items. It provides details about product revenue, revenue breakdown, time to market, existing products, etc.
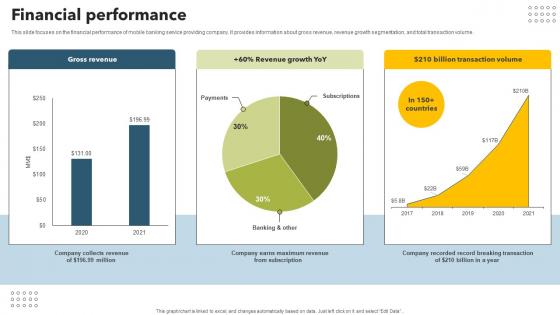
Financial Performance Mobile Banking App Investor Funding Elevator Pitch Deck
This slide focuses on the financial performance of mobile banking service providing company. It provides information about gross revenue, revenue growth segmentation, and total transaction volume. Present like a pro with Financial Performance Mobile Banking App Investor Funding Elevator Pitch Deck Create beautiful presentations together with your team, using our easy to use presentation slides. Share your ideas in real time and make changes on the fly by downloading our templates. So whether you are in the office, on the go, or in a remote location, you can stay in sync with your team and present your ideas with confidence. With Slidegeeks presentation got a whole lot easier. Grab these presentations today. This slide focuses on the financial performance of mobile banking service providing company. It provides information about gross revenue, revenue growth segmentation, and total transaction volume.
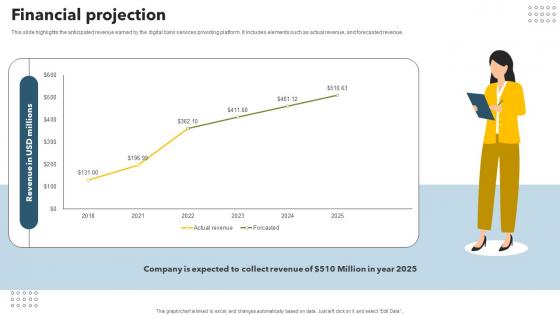
Financial Projection Mobile Banking App Investor Funding Elevator Pitch Deck
This slide highlights the anticipated revenue earned by the digital bank services providing platform. It includes elements such as actual revenue, and forecasted revenue. Slidegeeks is here to make your presentations a breeze with Financial Projection Mobile Banking App Investor Funding Elevator Pitch Deck With our easy to use and customizable templates, you can focus on delivering your ideas rather than worrying about formatting. With a variety of designs to choose from, you are sure to find one that suits your needs. And with animations and unique photos, illustrations, and fonts, you can make your presentation pop. So whether you are giving a sales pitch or presenting to the board, make sure to check out Slidegeeks first This slide highlights the anticipated revenue earned by the digital bank services providing platform. It includes elements such as actual revenue, and forecasted revenue.
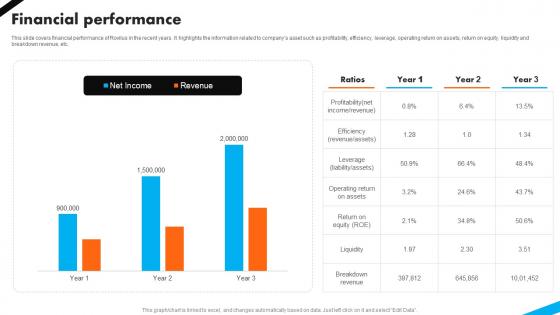
Financial Performance Automotive Battery Manufacturer Investor Funding Elevator Pitch Deck
This slide covers financial performance of Rovilus in the recent years. It highlights the information related to companys asset such as profitability, efficiency, leverage, operating return on assets, return on equity, liquidity and breakdown revenue, etc.From laying roadmaps to briefing everything in detail, our templates are perfect for you. You can set the stage with your presentation slides. All you have to do is download these easy-to-edit and customizable templates. Financial Performance Automotive Battery Manufacturer Investor Funding Elevator Pitch Deck will help you deliver an outstanding performance that everyone would remember and praise you for. Do download this presentation today. This slide covers financial performance of Rovilus in the recent years. It highlights the information related to companys asset such as profitability, efficiency, leverage, operating return on assets, return on equity, liquidity and breakdown revenue, etc.

 Home
Home