Software Icon

Freight Shipping Company Profile CSR Support For Sustainable Growth Portrait PDF
The slide highlights the CSR support for society and spend distribution for current year. It depicts poverty support, quench hunger, health support, quality education, clean drinking water, gender equality, others, clean energy, global warming and clean ocean drive.Deliver and pitch your topic in the best possible manner with this Freight Shipping Company Profile CSR Support For Sustainable Growth Portrait PDF. Use them to share invaluable insights on Quench Hunger, Health Support, Quality Education and impress your audience. This template can be altered and modified as per your expectations. So, grab it now.
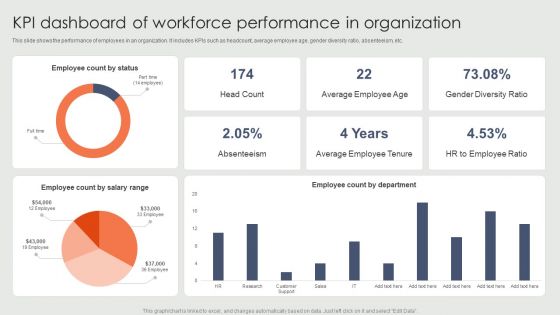
KPI Dashboard Of Workforce Performance In Organization Ppt Gallery Portfolio PDF
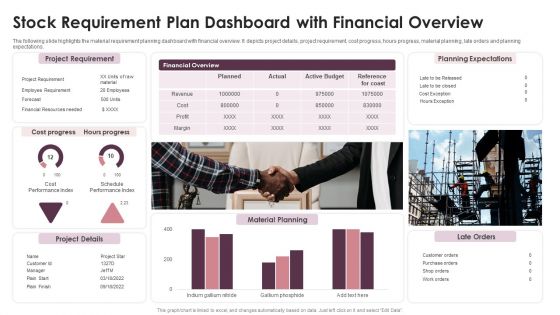
Stock Requirement Plan Dashboard With Financial Overview Formats PDF
The following slide highlights the material requirement planning dashboard with financial overview. It depicts project details, project requirement, cost progress, hours progress, material planning, late orders and planning expectations. Showcasing this set of slides titled Stock Requirement Plan Dashboard With Financial Overview Formats PDF. The topics addressed in these templates are Project Requirement, Planning Expectations, Project Details. All the content presented in this PPT design is completely editable. Download it and make adjustments in color, background, font etc. as per your unique business setting.
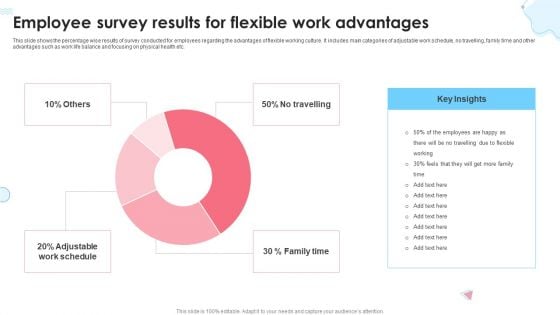
Employee Survey Results For Flexible Work Advantages Ppt Infographic Template Guidelines PDF
This slide shows the percentage wise results of survey conducted for employees regarding the advantages of flexible working culture. It includes main categories of adjustable work schedule, no travelling, family time and other advantages such as work life balance and focusing on physical health etc. Pitch your topic with ease and precision using this Employee Survey Results For Flexible Work Advantages Ppt Infographic Template Guidelines PDF. This layout presents information on Key Insights, Family Time, Adjustable Work Schedule, No Travelling. It is also available for immediate download and adjustment. So, changes can be made in the color, design, graphics or any other component to create a unique layout.
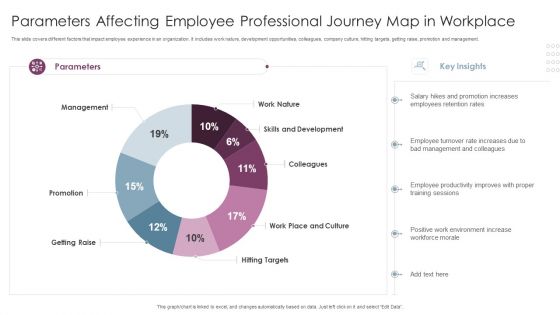
Parameters Affecting Employee Professional Journey Map In Workplace Download PDF
This slide covers different factors that impact employee experience in an organization. It includes work nature, development opportunities, colleagues, company culture, hitting targets, getting raise, promotion and management. Pitch your topic with ease and precision using this Parameters Affecting Employee Professional Journey Map In Workplace Download PDF. This layout presents information on Management, Promotion, Getting Raise, Hitting Targets. It is also available for immediate download and adjustment. So, changes can be made in the color, design, graphics or any other component to create a unique layout.

Logistics KPI Status Dashboard With Monthly KPI Ppt Infographic Template Layout PDF
The following slide highlights the transportation status dashboard with monthly KPI illustrating order status with customer, order date and delivery date. It shows financial performance for four quarters as well as todays order, inventory and monthly KPI with Inventory, shipping cost for past 30 days. Pitch your topic with ease and precision using this Logistics KPI Status Dashboard With Monthly KPI Ppt Infographic Template Layout PDF. This layout presents information on Order Status, Today Order, Inventory, Monthly KPI. It is also available for immediate download and adjustment. So, changes can be made in the color, design, graphics or any other component to create a unique layout.
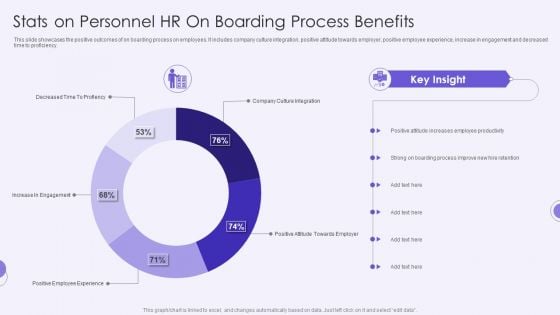
Stats On Personnel HR On Boarding Process Benefits Mockup PDF
This slide showcases the positive outcomes of on boarding process on employees. It includes company culture integration, positive attitude towards employer, positive employee experience, increase in engagement and decreased time to proficiency.Showcasing this set of slides titled Stats On Personnel HR On Boarding Process Benefits Mockup PDF. The topics addressed in these templates are Positive Attitude, Increases Employee, Boarding Process. All the content presented in this PPT design is completely editable. Download it and make adjustments in color, background, font etc. as per your unique business setting.
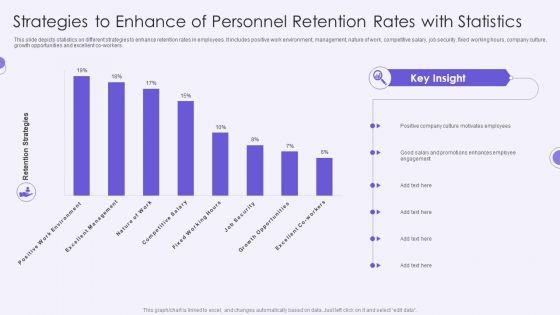
Strategies To Enhance Of Personnel Retention Rates With Statistics Summary PDF
This slide depicts statistics on different strategies to enhance retention rates in employees. It includes positive work environment, management, nature of work, competitive salary, job security, fixed working hours, company culture, growth opportunities and excellent co-workers.Pitch your topic with ease and precision using this Strategies To Enhance Of Personnel Retention Rates With Statistics Summary PDF. This layout presents information on Positive Company, Culture Motivates, Employees Promotions . It is also available for immediate download and adjustment. So, changes can be made in the color, design, graphics or any other component to create a unique layout.
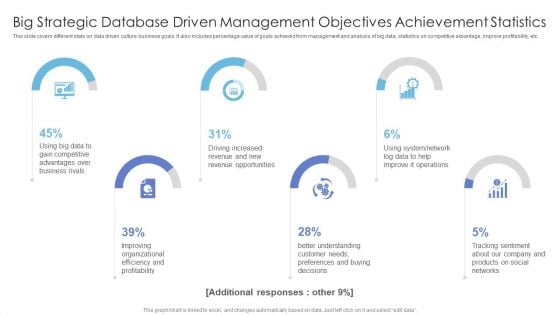
Big Strategic Database Driven Management Objectives Achievement Statistics Professional PDF
This slide covers different stats on data driven culture business goals. It also includes percentage value of goals achieved from management and analysis of big data, statistics on competitive advantage, improve profitability, etc.Showcasing this set of slides titled Big Strategic Database Driven Management Objectives Achievement Statistics Professional PDF. The topics addressed in these templates are Gain Competitive, Driving Increased, Revenue Opportunities. All the content presented in this PPT design is completely editable. Download it and make adjustments in color, background, font etc. as per your unique business setting.
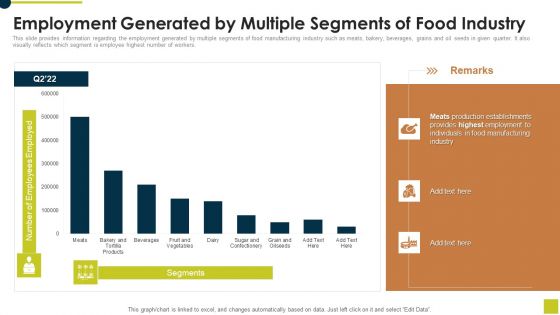
Employment Generated By Multiple Segments Of Food Industry Ppt Layouts Designs Download PDF
This slide provides information regarding the employment generated by multiple segments of food manufacturing industry such as meats, bakery, beverages, grains and oil seeds in given quarter. It also visually reflects which segment is employee highest number of workers. Deliver an awe inspiring pitch with this creative Employment Generated By Multiple Segments Of Food Industry Ppt Layouts Designs Download PDF bundle. Topics like Meats Production Establishments, Provides Highest Employment, Food Manufacturing Industry can be discussed with this completely editable template. It is available for immediate download depending on the needs and requirements of the user.
Global Exports Of Processed Food Commodities By USA Ppt Ideas Picture PDF
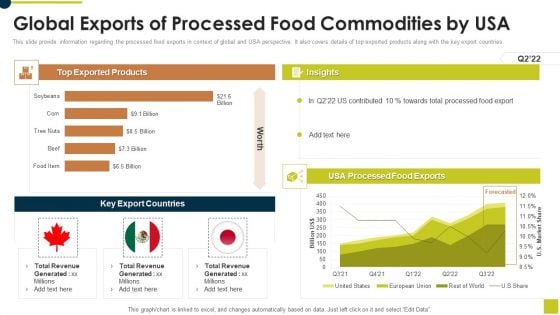
This slide provide information regarding the processed food exports in context of global and USA perspective. It also covers details of top exported products along with the key export countries. Deliver and pitch your topic in the best possible manner with this Global Exports Of Processed Food Commodities By USA Ppt Ideas Picture PDF. Use them to share invaluable insights on Top Exported Products, Insights, USA Processed, Food Exports and impress your audience. This template can be altered and modified as per your expectations. So, grab it now.
KPI Dashboard For Tracking Supply Chain Costs Ppt Summary Templates PDF
This slide represents the KPI dashboard to track the multiple cost associated with supply chain in food manufacturing industry. It includes information regarding cash to cash cycle in days, carry cost of inventory along with details of net sales. Deliver an awe inspiring pitch with this creative KPI Dashboard For Tracking Supply Chain Costs Ppt Summary Templates PDF bundle. Topics like Supply Chain, Costs vs Sales, Carrying Costs Inventory, Supply Chain Costs can be discussed with this completely editable template. It is available for immediate download depending on the needs and requirements of the user.
Website And Social Media Digital Audit Dashboard Highlighting Website Visitors With Device Rules PDF
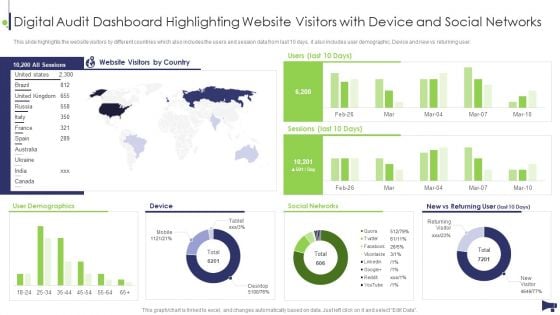
This slide highlights the website visitors by different countries which also includes the users and session data from last 10 days, it also includes user demographic. Device and new vs returning user. Deliver an awe inspiring pitch with this creative Website And Social Media Digital Audit Dashboard Highlighting Website Visitors With Device Rules PDF bundle. Topics like Website Visitors Country, User Demographics, Social Networks can be discussed with this completely editable template. It is available for immediate download depending on the needs and requirements of the user.
Information Security Risk Evaluation Cyber Attacks Faced By Organization In Previous Financial Year Template PDF
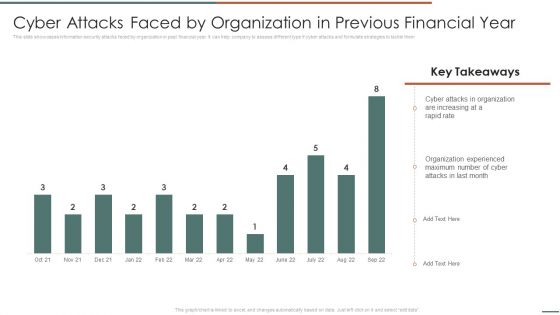
This slide showcases information security attacks faced by organization in past financial year. It can help company to assess different type if cyber attacks and formulate strategies to tackle them.Deliver and pitch your topic in the best possible manner with this Information Security Risk Evaluation Cyber Attacks Faced By Organization In Previous Financial Year Template PDF. Use them to share invaluable insights on Attacks In Organization, Organization Experienced, Attacks Last and impress your audience. This template can be altered and modified as per your expectations. So, grab it now.
Information Security Risk Evaluation Market Growth Of Information Security Industry Infographics PDF
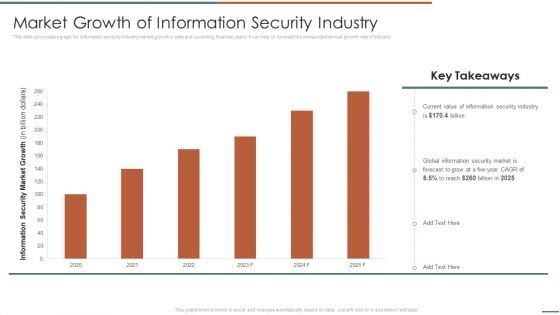
This slide showcases graph for information security industry market growth in past and upcoming financial years. It can help to forecast the compunded annual growth rate of industry .Deliver and pitch your topic in the best possible manner with this Information Security Risk Evaluation Market Growth Of Information Security Industry Infographics PDF. Use them to share invaluable insights on Information Security, Global Information, Security Market and impress your audience. This template can be altered and modified as per your expectations. So, grab it now.
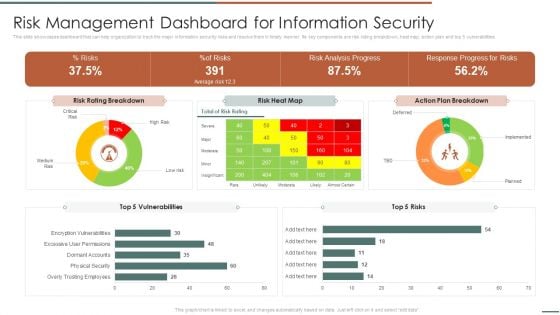
Information Security Risk Evaluation Risk Management Dashboard For Information Security Summary PDF
This slide showcases dashboard that can help organization to track the major information security risks and resolve them in timely manner. Its key components are risk rating breakdown, heat map, action plan and top 5 vulnerabilities.Deliver and pitch your topic in the best possible manner with this Information Security Risk Evaluation Risk Management Dashboard For Information Security Summary PDF. Use them to share invaluable insights on Rating Breakdown, Vulnerabilities, Response Progress and impress your audience. This template can be altered and modified as per your expectations. So, grab it now.
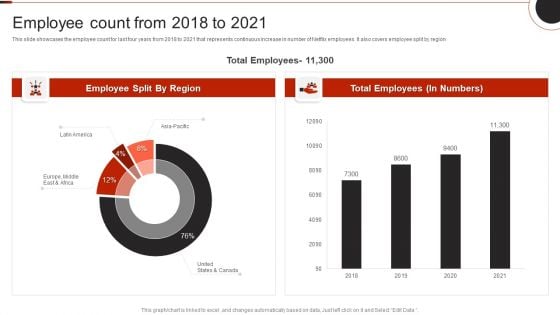
Netflix Company Outline Employee Count From 2018 To 2021 Information PDF
This slide showcases the employee count for last four years from 2018 to 2021 that represents continuous increase in number of Netflix employees. It also covers employee split by region.Deliver and pitch your topic in the best possible manner with this Netflix Company Outline Employee Count From 2018 To 2021 Information PDF. Use them to share invaluable insights on Employee Split, Total Employees, Europe Middle and impress your audience. This template can be altered and modified as per your expectations. So, grab it now.
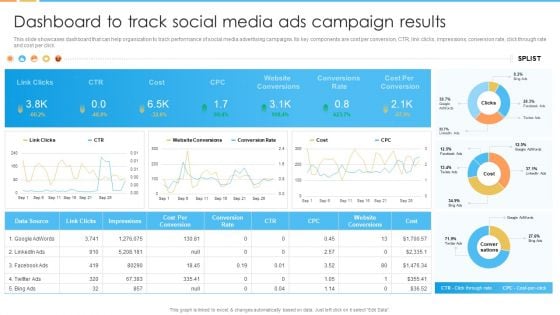
Digital Marketing Guide For B2B Firms Dashboard To Track Social Media Ads Campaign Results Topics PDF
This slide showcases dashboard that can help organization to track performance of social media advertising campaigns. Its key components are cost per conversion, CTR, link clicks, impressions, conversion rate, click through rate and cost per click.Deliver and pitch your topic in the best possible manner with this Digital Marketing Guide For B2B Firms Dashboard To Track Social Media Ads Campaign Results Topics PDF. Use them to share invaluable insights on Website Conversions, Conversions Rate, Cost Per Conversion and impress your audience. This template can be altered and modified as per your expectations. So, grab it now.
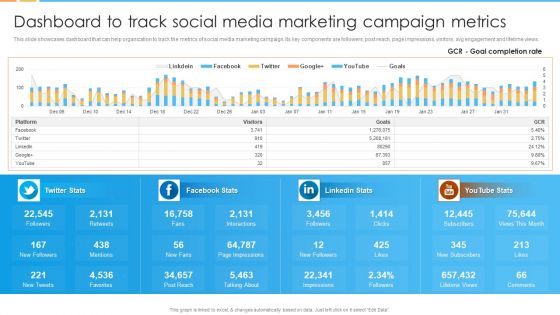
Digital Marketing Guide For B2B Firms Dashboard To Track Social Media Marketing Campaign Metrics Demonstration PDF
This slide showcases dashboard that can help organization to track the metrics of social media marketing campaign. Its key components are followers, post reach, page impressions, visitors, avg engagement and lifetime views.Deliver an awe inspiring pitch with this creative Digital Marketing Guide For B2B Firms Dashboard To Track Social Media Marketing Campaign Metrics Demonstration PDF bundle. Topics like Page Impressions, New Followers, Talking About can be discussed with this completely editable template. It is available for immediate download depending on the needs and requirements of the user.
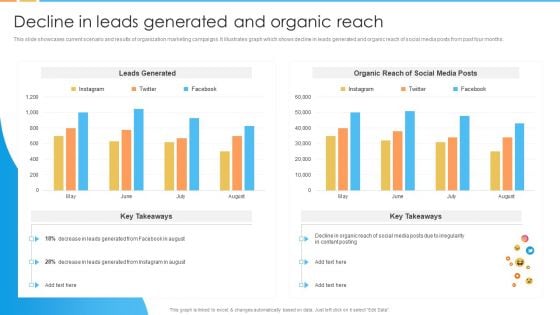
Digital Marketing Guide For B2B Firms Decline In Leads Generated And Organic Reach Pictures PDF
This slide showcases current scenario and results of organization marketing campaigns. It illustrates graph which shows decline in leads generated and organic reach of social media posts from past four months.Deliver and pitch your topic in the best possible manner with this Digital Marketing Guide For B2B Firms Decline In Leads Generated And Organic Reach Pictures PDF. Use them to share invaluable insights on Leads Generated, Organic Reach, Leads Generated and impress your audience. This template can be altered and modified as per your expectations. So, grab it now.
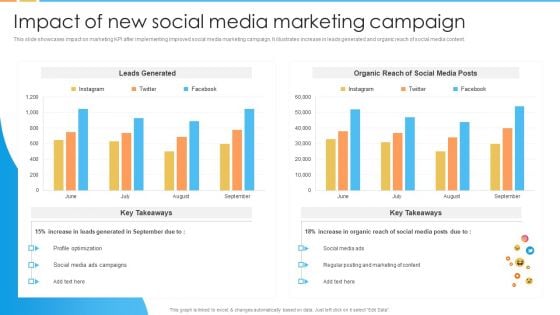
Digital Marketing Guide For B2B Firms Impact Of New Social Media Marketing Campaign Guidelines PDF
This slide showcases impact on marketing KPI after implementing improved social media marketing campaign. It illustrates increase in leads generated and organic reach of social media content.Deliver and pitch your topic in the best possible manner with this Digital Marketing Guide For B2B Firms Impact Of New Social Media Marketing Campaign Guidelines PDF. Use them to share invaluable insights on Profile Optimization, Organic Reach, Regular Posting and impress your audience. This template can be altered and modified as per your expectations. So, grab it now.
Effective Company Event Communication Tactics Dashboard For Tracking Active Number Of Attendances Demonstration PDF
This slide covers metrics for analyzing the number of most active event participants. It includes KPIs such as check-in status, contract roles, top industries, contract by country, top 5 job functions, etc. Deliver and pitch your topic in the best possible manner with this Effective Company Event Communication Tactics Dashboard For Tracking Active Number Of Attendances Demonstration PDF. Use them to share invaluable insights on Attendance, Exhibitors, Management and impress your audience. This template can be altered and modified as per your expectations. So, grab it now.
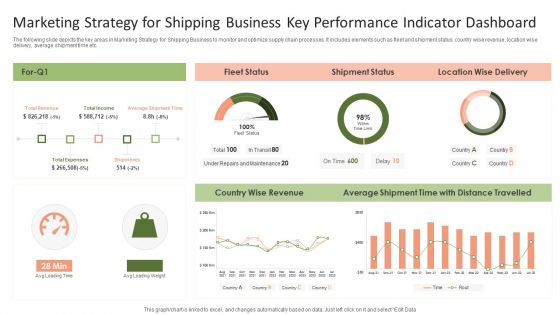
Marketing Strategy For Shipping Business Key Performance Indicator Dashboard Graphics PDF
The following slide depicts the key areas in Marketing Strategy for Shipping Business to monitor and optimize supply chain processes. It includes elements such as fleet and shipment status, country wise revenue, location wise delivery, average shipment time etc.Pitch your topic with ease and precision using this Marketing Strategy For Shipping Business Key Performance Indicator Dashboard Graphics PDF. This layout presents information on Shipment Status, Average Shipment, Wise Revenue. It is also available for immediate download and adjustment. So, changes can be made in the color, design, graphics or any other component to create a unique layout.
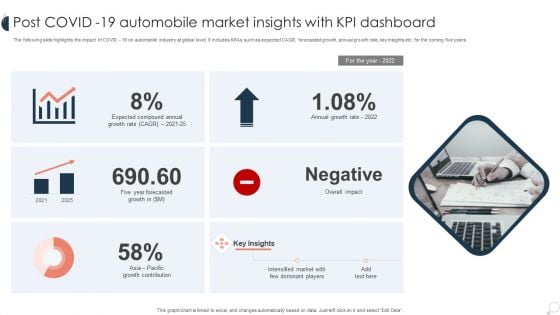
Post COVID 19 Automobile Market Insights With KPI Dashboard Ppt PowerPoint Presentation Slides Background Images PDF
The following slide highlights the impact of COVID 19 on automobile industry at global level. It includes KPAs such as expected CAGR, forecasted growth, annual growth rate, key insights etc. for the coming five years. Showcasing this set of slides titled Post COVID 19 Automobile Market Insights With KPI Dashboard Ppt PowerPoint Presentation Slides Background Images PDF. The topics addressed in these templates are Expected Compound, Annual Growth, Overall Impact. All the content presented in this PPT design is completely editable. Download it and make adjustments in color, background, font etc. as per your unique business setting.
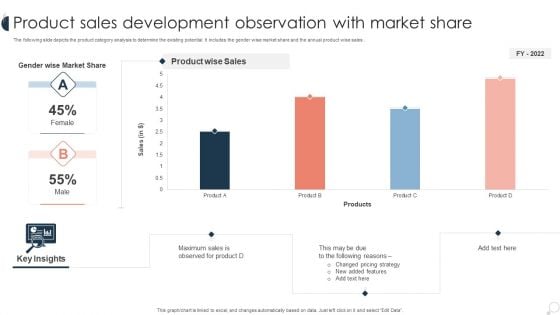
Product Sales Development Observation With Market Share Ppt PowerPoint Presentation Infographic Template Guide PDF
The following slide depicts the product category analysis to determine the existing potential. It includes the gender wise market share and the annual product wise sales . Pitch your topic with ease and precision using this Product Sales Development Observation With Market Share Ppt PowerPoint Presentation Infographic Template Guide PDF. This layout presents information on Changed Pricing, Observed For Product, Product Wise. It is also available for immediate download and adjustment. So, changes can be made in the color, design, graphics or any other component to create a unique layout.
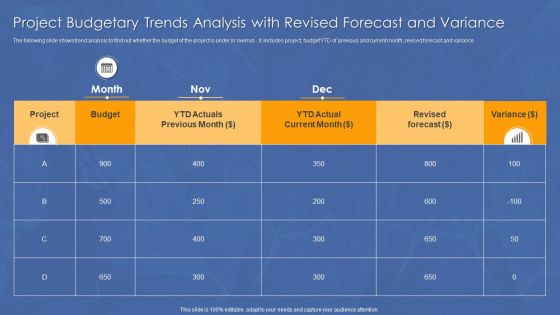
Project Budgetary Trends Analysis With Revised Forecast And Variance Elements PDF
The following slide shows trend analysis to find out whether the budget of the project is under or overrun . It includes project, budget YTD of previous and current month, revised forecast and variance.Showcasing this set of slides titled Project Budgetary Trends Analysis With Revised Forecast And Variance Elements PDF. The topics addressed in these templates are Current Month, Previous Month, Revised Forecast. All the content presented in this PPT design is completely editable. Download it and make adjustments in color, background, font etc. as per your unique business setting.
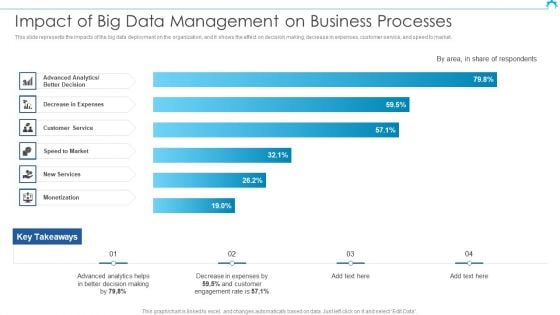
Big Data Architect Impact Of Big Data Management On Business Processes Designs PDF
This slide represents the impacts of the big data deployment on the organization, and it shows the effect on decision making, decrease in expenses, customer service, and speed to market.Deliver and pitch your topic in the best possible manner with this Big Data Architect Impact Of Big Data Management On Business Processes Designs PDF. Use them to share invaluable insights on Advanced Analytics, Better Decision, Decrease Expenses and impress your audience. This template can be altered and modified as per your expectations. So, grab it now.
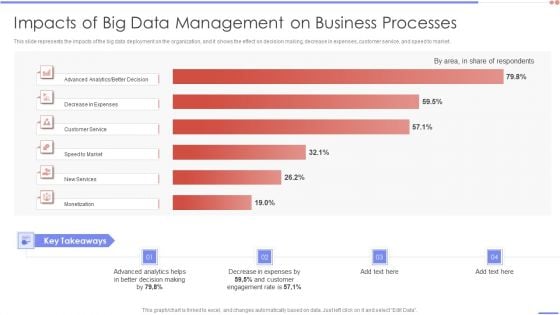
Data Analytics Management Impacts Of Big Data Management On Business Processes Sample PDF
This slide represents the impacts of the big data deployment on the organization, and it shows the effect on decision making, decrease in expenses, customer service, and speed to market.Deliver and pitch your topic in the best possible manner with this Data Analytics Management Impacts Of Big Data Management On Business Processes Sample PDF. Use them to share invaluable insights on Advanced Analytics, Decrease Expenses, Customer Service and impress your audience. This template can be altered and modified as per your expectations. So, grab it now.
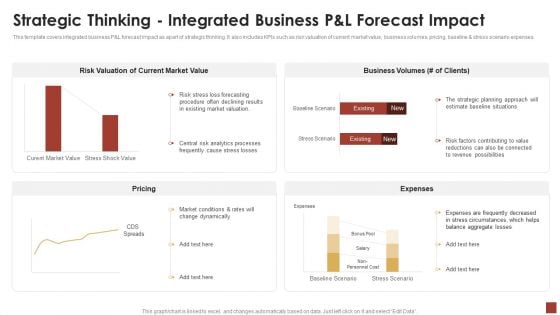
Strategical And Tactical Planning Strategic Thinking Integrated Business Pandl Forecast Impact Pictures PDF
This template covers integrated business P and L forecast impact as apart of strategic thinking. It also includes KPIs such as risk valuation of current market value, business volumes, pricing, baseline and stress scenario expenses. Deliver and pitch your topic in the best possible manner with this Strategical And Tactical Planning Strategic Thinking Integrated Business Pandl Forecast Impact Pictures PDF. Use them to share invaluable insights on Risk Valuation, Current Market Value, Business Volumes and impress your audience. This template can be altered and modified as per your expectations. So, grab it now.
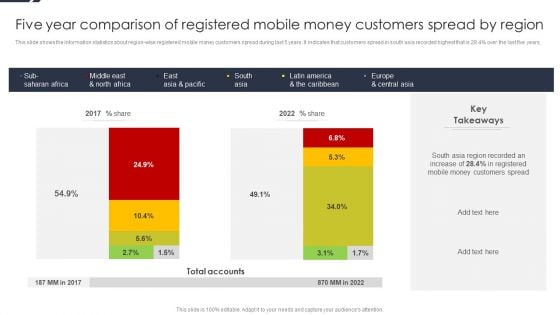
Five Year Comparison Of Registered Mobile Money Customers Spread By Region Introduction PDF
This slide shows the information statistics about region wise registered mobile money customers spread during last 5 years. It indicates that customers spread in south asia recorded highest that is 28.4persent over the last five years.Deliver and pitch your topic in the best possible manner with this Five Year Comparison Of Registered Mobile Money Customers Spread By Region Introduction PDF. Use them to share invaluable insights on Region Recorded, Mobile Money, Customers Spread and impress your audience. This template can be altered and modified as per your expectations. So, grab it now.
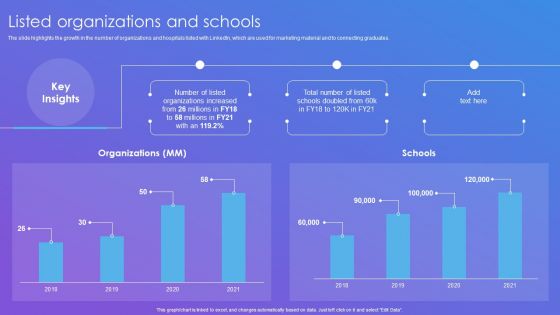
Linkedin Company Outline Listed Organizations And Schools Rules PDF
The slide showcases company revenue for last six years along with forecasted revenue for Q4F Y22. It also depicts CAGR and key insights for revenue analysis.The slide highlights the growth in the number of organizations and hospitals listed with LinkedIn, which are used for marketing material and to connecting graduates. Deliver an awe inspiring pitch with this creative Linkedin Company Outline Listed Organizations And Schools Rules PDF bundle. Topics like Organizations Increased, Schools Doubled, Organizations can be discussed with this completely editable template. It is available for immediate download depending on the needs and requirements of the user.
Online Customer Interaction Dashboard For Tracking Customer Service Team Performance Infographics PDF
This slide covers the KPI dashboard for analyzing the performance of client support department. It includes metrics such as first call resolution, unresolved calls, average response rate, the best day to call, average time to solve issues, etc. Deliver and pitch your topic in the best possible manner with this Online Customer Interaction Dashboard For Tracking Customer Service Team Performance Infographics PDF. Use them to share invaluable insights on Response Time, Issue Solving, Call Resolution and impress your audience. This template can be altered and modified as per your expectations. So, grab it now.
Online Customer Interaction Online Ad Campaign Performance Tracking Dashboard Demonstration PDF
This slide covers the KPI dashboard for measuring digital campaign results. It includes metrics such as Ad cost, clicks, impressions, CTR, cost per click, conversions, conversion rate, cost per click, cost per thousand impressions, etc. Deliver and pitch your topic in the best possible manner with this Online Customer Interaction Online Ad Campaign Performance Tracking Dashboard Demonstration PDF. Use them to share invaluable insights on Conversations, Impressions, Conversation Rate and impress your audience. This template can be altered and modified as per your expectations. So, grab it now.
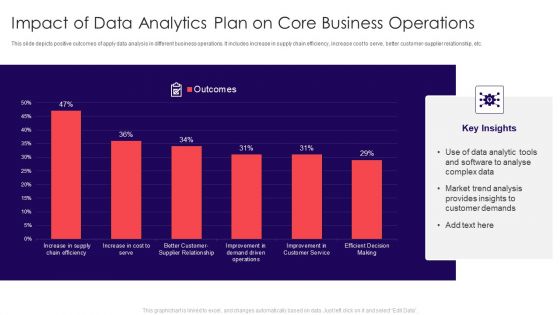
Impact Of Data Analytics Plan On Core Business Operations Summary PDF
This slide depicts positive outcomes of apply data analysis in different business operations. It includes increase in supply chain efficiency, increase cost to serve, better customer-supplier relationship, etc. Showcasing this set of slides titled Impact Of Data Analytics Plan On Core Business Operations Summary PDF. The topics addressed in these templates are Customer Demands, Market Trend Analysis, Complex Data. All the content presented in this PPT design is completely editable. Download it and make adjustments in color, background, font etc. as per your unique business setting.
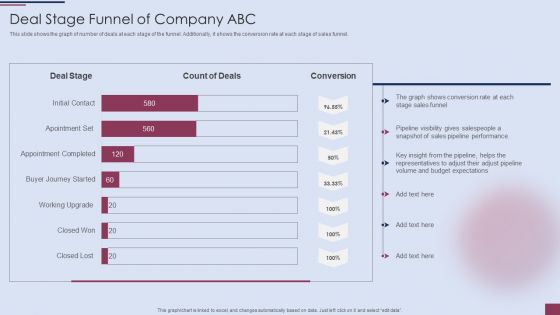
Sales Process Management To Boost Business Effectiveness Deal Stage Funnel Of Company ABC Mockup PDF
This slide shows the graph of number of deals at each stage of the funnel. Additionally, it shows the conversion rate at each stage of sales funnel.Deliver and pitch your topic in the best possible manner with this Sales Process Management To Boost Business Effectiveness Deal Stage Funnel Of Company ABC Mockup PDF. Use them to share invaluable insights on Shows Conversion, Sales Funnel, Pipeline Performance and impress your audience. This template can be altered and modified as per your expectations. So, grab it now.
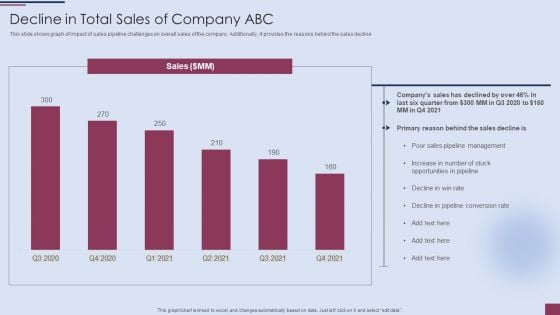
Sales Process Management To Boost Business Effectiveness Decline In Total Sales Of Company ABC Template PDF
This slide shows graph of impact of sales pipeline challenges on overall sales of the company. Additionally, it provides the reasons behind the sales decline.Deliver and pitch your topic in the best possible manner with this Sales Process Management To Boost Business Effectiveness Decline In Total Sales Of Company ABC Template PDF. Use them to share invaluable insights on Pipeline Management, Opportunities In Pipeline, Decline In Pipeline and impress your audience. This template can be altered and modified as per your expectations. So, grab it now.
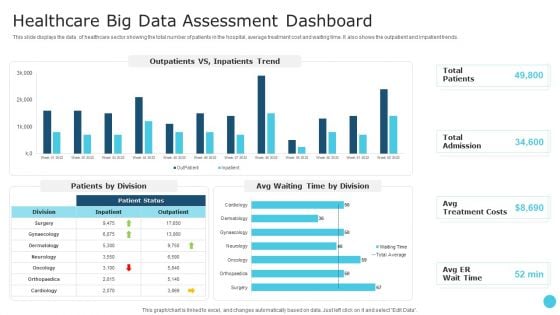
Healthcare Big Data Assessment Dashboard Portrait PDF
This slide displays the data of healthcare sector showing the total number of patients in the hospital, average treatment cost and waiting time. It also shows the outpatient and impatient trends. Pitch your topic with ease and precision using this Healthcare Big Data Assessment Dashboard Portrait PDF. This layout presents information on Patient Status, Treatment Costs. It is also available for immediate download and adjustment. So, changes can be made in the color, design, graphics or any other component to create a unique layout.

Content Freelance Marketing Metrics With Total Visits And Bounce Rate Slides PDF
The following slide highlights the content freelance marketing metrics with total visits and bounce rate. It showcases total visits, average visit per day, page overview, page engagement, unique visits, bounce rate, retention rate and top content Pitch your topic with ease and precision using this Content Freelance Marketing Metrics With Total Visits And Bounce Rate Slides PDF. This layout presents information on Average, Page Engagement, Bounce Rate. It is also available for immediate download and adjustment. So, changes can be made in the color, design, graphics or any other component to create a unique layout.
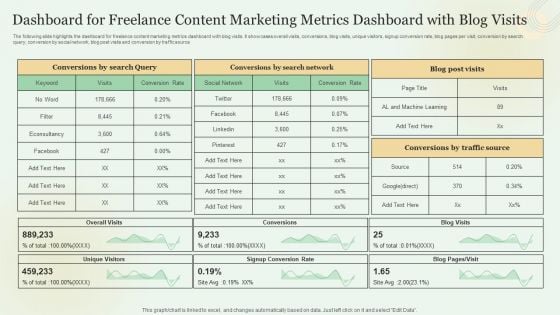
Dashboard For Freelance Content Marketing Metrics Dashboard With Blog Visits Guidelines PDF
Showcasing this set of slides titled Dashboard For Freelance Content Marketing Metrics Dashboard With Blog Visits Guidelines PDF. The topics addressed in these templates are Traffic Source, Signup Conversion Rate, Search Network. All the content presented in this PPT design is completely editable. Download it and make adjustments in color, background, font etc. as per your unique business setting. The following slide highlights the dashboard for freelance content marketing metrics dashboard with blog visits. It showcases overall visits, conversions, blog visits, unique visitors, signup conversion rate, blog pages per visit, conversion by search query, conversion by social network, blog post visits and conversion by traffic source

Freelance Content Marketing Dashboard With Metrics Demonstration PDF
The following slide highlights the freelance content marketing dashboard with metrics illustrating most visited content, monthly total visit, average content score. It depicts key metrics which includes content reach, unique visits, organic ranking, number of shares, rating, session time and repeat visitors. Showcasing this set of slides titled Freelance Content Marketing Dashboard With Metrics Demonstration PDF. The topics addressed in these templates are Organic Ranking, Manufacturing, Average Content Score. All the content presented in this PPT design is completely editable. Download it and make adjustments in color, background, font etc. as per your unique business setting.
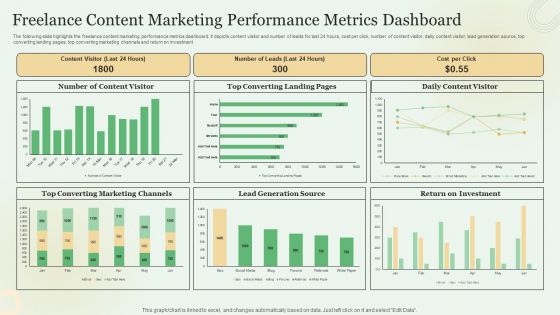
Freelance Content Marketing Performance Metrics Dashboard Elements PDF
The following slide highlights the freelance content marketing performance metrics dashboard. It depicts content visitor and number of leads for last 24 hours, cost per click, number of content visitor, daily content visitor, lead generation source, top converting landing pages, top converting marketing channels and return on investment. Showcasing this set of slides titled Freelance Content Marketing Performance Metrics Dashboard Elements PDF. The topics addressed in these templates are Lead Generation Source, Return On Investment, Converting Marketing Channels. All the content presented in this PPT design is completely editable. Download it and make adjustments in color, background, font etc. as per your unique business setting.
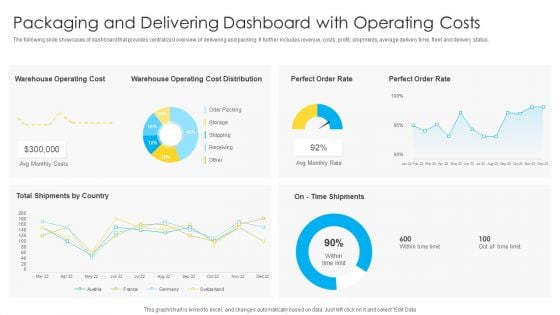
Packaging And Delivering Dashboard With Operating Costs Topics PDF
The following slide showcases of dashboard that provides centralized overview of delivering and packing. It further includes revenue, costs, profit, shipments, average delivery time, fleet and delivery status. Showcasing this set of slides titled Packaging And Delivering Dashboard With Operating Costs Topics PDF. The topics addressed in these templates are Warehouse Operating Cost, Perfect Order Rate, Avg Monthly Costs. All the content presented in this PPT design is completely editable. Download it and make adjustments in color, background, font etc. as per your unique business setting.
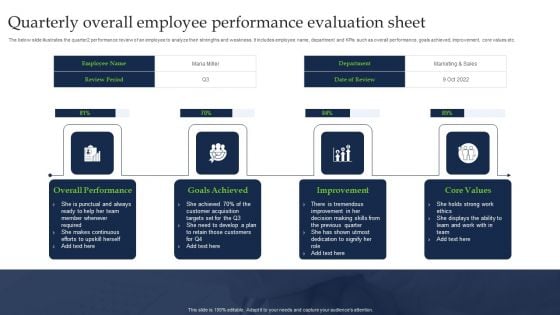
Quarterly Overall Employee Performance Evaluation Sheet Sample PDF
The below slide illustrates the quarter2 performance review of an employee to analyze their strengths and weakness. It includes employee name, department and KPIs such as overall performance, goals achieved, improvement, core values etc. Showcasing this set of slides titled Quarterly Overall Employee Performance Evaluation Sheet Sample PDF. The topics addressed in these templates are Overall Performance, Goals Achieved, Improvement. All the content presented in this PPT design is completely editable. Download it and make adjustments in color, background, font etc. as per your unique business setting.
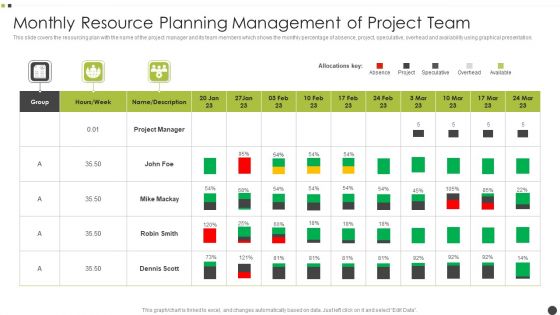
Monthly Resource Planning Management Of Project Team Demonstration PDF
This slide covers the resourcing plan with the name of the project manager and its team members which shows the monthly percentage of absence, project, speculative, overhead and availability using graphical presentation. Showcasing this set of slides titled Monthly Resource Planning Management Of Project Team Demonstration PDF. The topics addressed in these templates are Project Team, Resource Planning Management. All the content presented in this PPT design is completely editable. Download it and make adjustments in color, background, font etc. as per your unique business setting.

6 Year Revenue Declining Graph Ppt PowerPoint Presentation Outline Sample PDF
This slide shows the revenues of the company over the last years to have a clear idea of organization growth and financial status . It includes the 6 year 2017 to 2022 revenue earned by the company.Showcasing this set of slides titled 6 Year Revenue Declining Graph Ppt PowerPoint Presentation Outline Sample PDF. The topics addressed in these templates are Revenue Company, Highest Comparison, Conditions Restrictions. All the content presented in this PPT design is completely editable. Download it and make adjustments in color, background, font etc. as per your unique business setting.
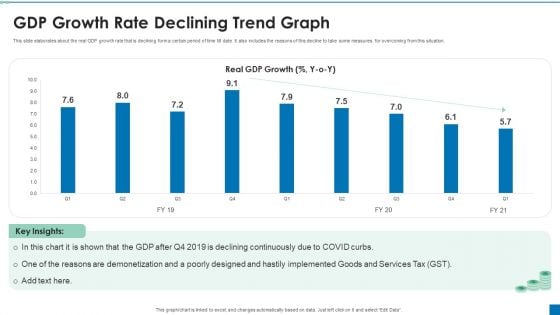
GDP Growth Rate Declining Trend Graph Ppt PowerPoint Presentation Slides Professional PDF
This slide elaborates about the real GDP growth rate that is declining form a certain period of time till date. It also includes the reasons of this decline to take some measures for overcoming from this situation. Showcasing this set of slides titled GDP Growth Rate Declining Trend Graph Ppt PowerPoint Presentation Slides Professional PDF. The topics addressed in these templates are Declining Continuously, Poorly Designed, Reasons Demonetization. All the content presented in this PPT design is completely editable. Download it and make adjustments in color, background, font etc. as per your unique business setting.
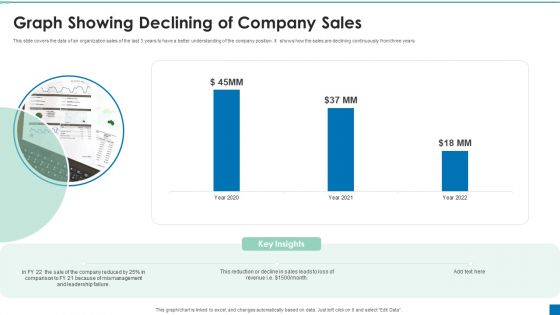
Graph Showing Declining Of Company Sales Ppt PowerPoint Presentation Portfolio Graphics Example PDF
This slide covers the data of an organization sales of the last 3 years to have a better understanding of the company position. It shows how the sales are declining continuously from three years.Pitch your topic with ease and precision using this Graph Showing Declining Of Company Sales Ppt PowerPoint Presentation Portfolio Graphics Example PDF. This layout presents information on Reduction Decline, Comparison, Mismanagement. It is also available for immediate download and adjustment. So, changes can be made in the color, design, graphics or any other component to create a unique layout.
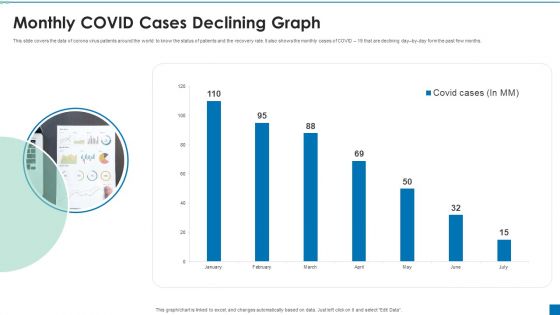
Monthly COVID Cases Declining Graph Ppt PowerPoint Presentation Ideas Slide Portrait PDF
This slide covers the data of corona virus patients around the world to know the status of patients and the recovery rate. It also shows the monthly cases of COVID 19 that are declining day by day form the past few months.Showcasing this set of slides titled Monthly COVID Cases Declining Graph Ppt PowerPoint Presentation Ideas Slide Portrait PDF. The topics addressed in these templates are Monthly Covid Cases, Declining Graph. All the content presented in this PPT design is completely editable. Download it and make adjustments in color, background, font etc. as per your unique business setting.
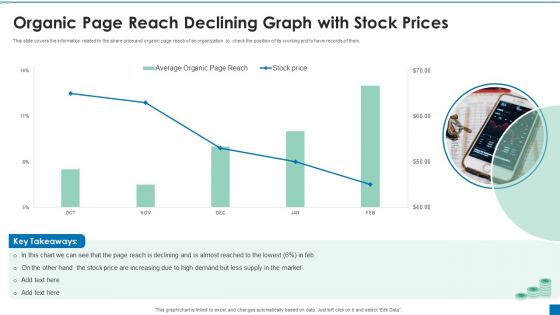
Organic Page Reach Declining Graph With Stock Prices Ppt PowerPoint Presentation Ideas Styles PDF
This slide covers the information related to the share price and organic page reach of an organization to check the position of its working and to have records of them.Pitch your topic with ease and precision using this Organic Page Reach Declining Graph With Stock Prices Ppt PowerPoint Presentation Ideas Styles PDF. This layout presents information on Increasing High, Reach Declining, Supply Market. It is also available for immediate download and adjustment. So, changes can be made in the color, design, graphics or any other component to create a unique layout.
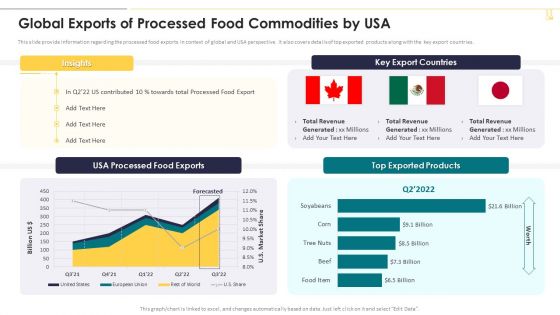
Global Exports Of Processed Food Commodities By Usa Graphics PDF
This slide provide information regarding the processed food exports in context of global and USA perspective. It also covers details of top exported products along with the key export countries. Deliver and pitch your topic in the best possible manner with this Global Exports Of Processed Food Commodities By Usa Graphics PDF. Use them to share invaluable insights on Top Exported Products, Key Export Countries, Total Revenue and impress your audience. This template can be altered and modified as per your expectations. So, grab it now.
KPI Dashboard For Tracking Supply Chain Costs Inspiration PDF
This slide represents the KPI dashboard to track the multiple cost associated with supply chain in food manufacturing industry. It includes information regarding cash to cash cycle in days, carry cost of inventory along with details of net sales. Deliver an awe inspiring pitch with this creative KPI Dashboard For Tracking Supply Chain Costs Inspiration PDF bundle. Topics like Supply Chain Costs, Average Cash, Service can be discussed with this completely editable template. It is available for immediate download depending on the needs and requirements of the user.
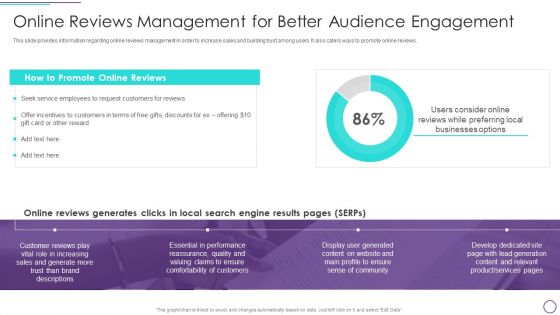
Franchise Marketing Plan Playbook Online Reviews Management For Better Audience Engagement Mockup PDF
This slide provides information regarding online reviews management in order to increase sales and building trust among users. It also caters ways to promote online reviews. Deliver and pitch your topic in the best possible manner with this Franchise Marketing Plan Playbook Online Reviews Management For Better Audience Engagement Mockup PDF. Use them to share invaluable insights on Customers For Reviews, Service Employees, Businesses Options and impress your audience. This template can be altered and modified as per your expectations. So, grab it now.
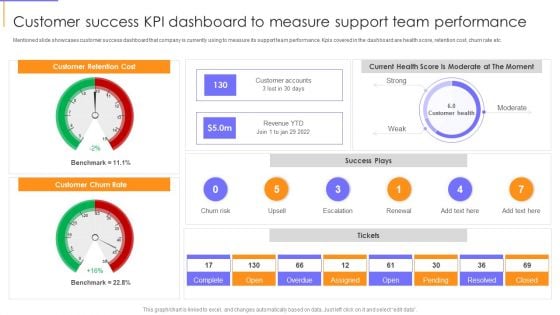
Guide To Client Success Customer Success KPI Dashboard To Measure Support Team Performance Topics PDF
Mentioned slide showcases customer success dashboard that company is currently using to measure its support team performance. Kpis covered in the dashboard are health score, retention cost, churn rate etc. Deliver an awe inspiring pitch with this creative Guide To Client Success Customer Success KPI Dashboard To Measure Support Team Performance Topics PDF bundle. Topics like Customer Churn Rate, Customer Retention Cost, Revenue can be discussed with this completely editable template. It is available for immediate download depending on the needs and requirements of the user.
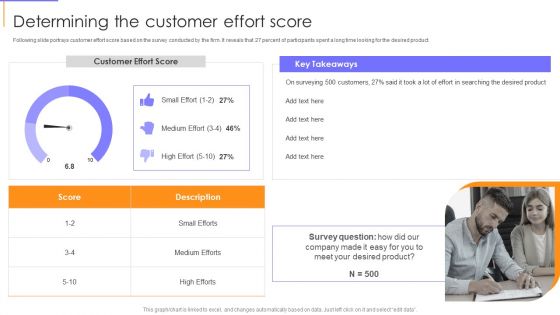
Guide To Client Success Determining The Customer Effort Score Microsoft PDF
Following slide portrays customer effort score based on the survey conducted by the firm. It reveals that 27 percent of participants spent a long time looking for the desired product. Deliver and pitch your topic in the best possible manner with this Guide To Client Success Determining The Customer Effort Score Microsoft PDF. Use them to share invaluable insights on Survey Question, Desired Product, Customer Effort Score and impress your audience. This template can be altered and modified as per your expectations. So, grab it now.
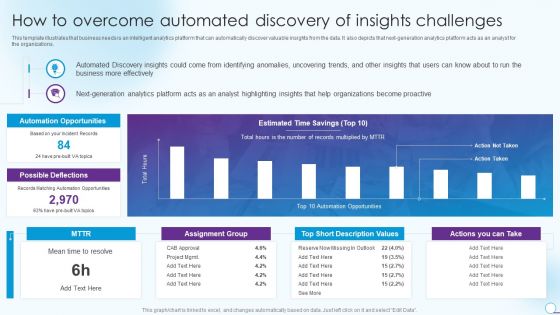
Information Analytics And Ml Strategy Playbook How To Overcome Automated Discovery Of Insights Challenges Information PDF
This template illustrates that business needs is an intelligent analytics platform that can automatically discover valuable insights from the data. It also depicts that next-generation analytics platform acts as an analyst for the organizations. Deliver an awe inspiring pitch with this creative Information Analytics And Ml Strategy Playbook How To Overcome Automated Discovery Of Insights Challenges Information PDF bundle. Topics like Organizations, Automation Opportunities, Description Values can be discussed with this completely editable template. It is available for immediate download depending on the needs and requirements of the user.
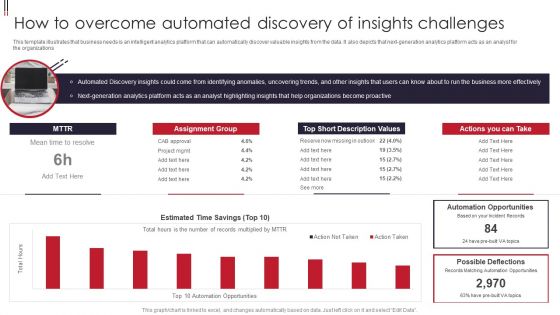
Information Visualizations Playbook How To Overcome Automated Discovery Of Insights Challenges Designs PDF
This template illustrates that business needs is an intelligent analytics platform that can automatically discover valuable insights from the data. It also depicts that next-generation analytics platform acts as an analyst for the organizations. Deliver and pitch your topic in the best possible manner with this Information Visualizations Playbook How To Overcome Automated Discovery Of Insights Challenges Designs PDF. Use them to share invaluable insights on Short Description Values, Automation Opportunities, Short Description Values, Analytics Platform and impress your audience. This template can be altered and modified as per your expectations. So, grab it now.
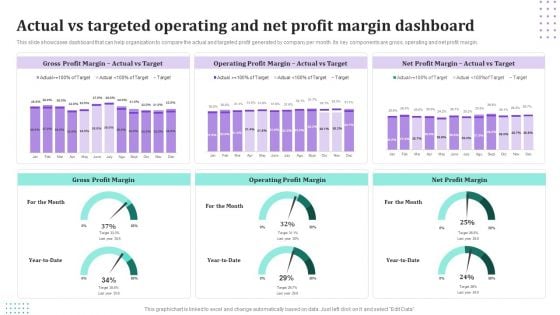
Actual Vs Targeted Operating And Net Profit Margin Dashboard Information PDF
This slide showcases dashboard that can help organization to compare the actual and targeted profit generated by company per month. Its key components are gross, operating and net profit margin. Showcasing this set of slides titled Actual Vs Targeted Operating And Net Profit Margin Dashboard Information PDF. The topics addressed in these templates are Gross Profit Margin, Operating Profit Margin, Net Profit Margin. All the content presented in this PPT design is completely editable. Download it and make adjustments in color, background, font etc. as per your unique business setting.
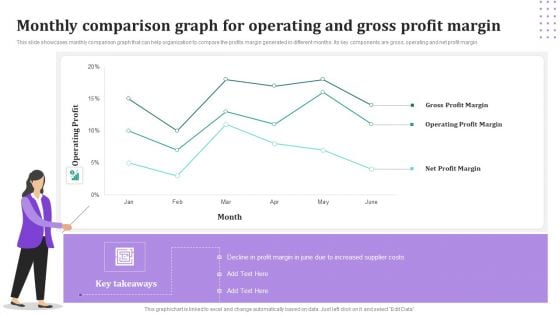
Monthly Comparison Graph For Operating And Gross Profit Margin Pictures PDF
This slide showcases monthly comparison graph that can help organization to compare the profits margin generated in different months. Its key components are gross, operating and net profit margin. Showcasing this set of slides titled Monthly Comparison Graph For Operating And Gross Profit Margin Pictures PDF. The topics addressed in these templates are Gross Profit Margin, Operating Profit Margin, Net Profit Margin. All the content presented in this PPT design is completely editable. Download it and make adjustments in color, background, font etc. as per your unique business setting.
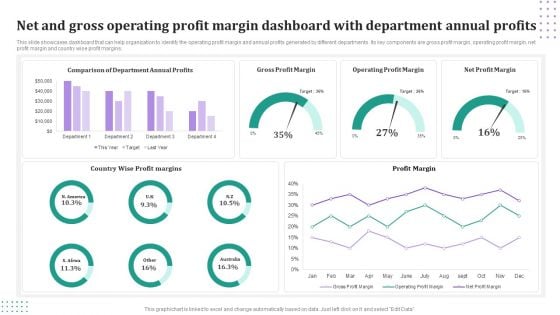
Net And Gross Operating Profit Margin Dashboard With Department Annual Profits Mockup PDF
This slide showcases dashboard that can help organization to identify the operating profit margin and annual profits generated by different departments. Its key components are gross profit margin, operating profit margin, net profit margin and country wise profit margins. Pitch your topic with ease and precision using this Net And Gross Operating Profit Margin Dashboard With Department Annual Profits Mockup PDF. This layout presents information on Gross Profit Margin, Operating Profit Margin, Net Profit Margin. It is also available for immediate download and adjustment. So, changes can be made in the color, design, graphics or any other component to create a unique layout.
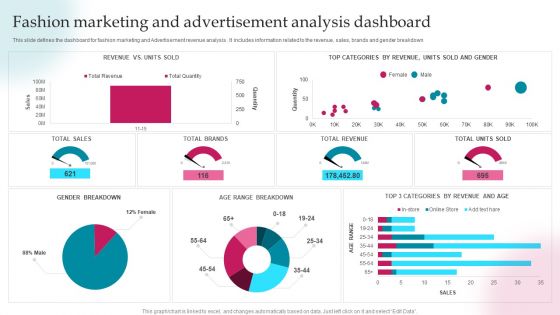
Fashion Marketing And Advertisement Analysis Dashboard Ppt PowerPoint Presentation Gallery Topics PDF
This slide defines the dashboard for fashion marketing and Advertisement revenue analysis . It includes information related to the revenue, sales, brands and gender breakdown. Pitch your topic with ease and precision using this Fashion Marketing And Advertisement Analysis Dashboard Ppt PowerPoint Presentation Gallery Topics PDF. This layout presents information on Total Revenue, Total Brands, Total Sales. It is also available for immediate download and adjustment. So, changes can be made in the color, design, graphics or any other component to create a unique layout.

 Home
Home