Software Icon
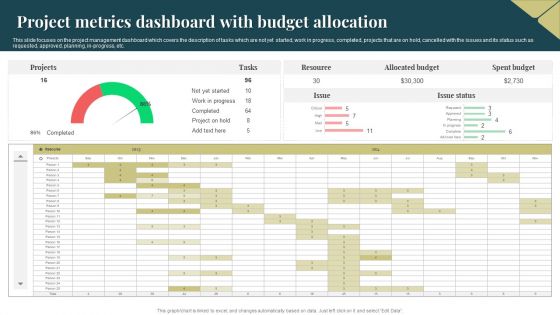
Project Metrics Dashboard With Budget Allocation Portrait PDF
This slide focuses on the project management dashboard which covers the description of tasks which are not yet started, work in progress, completed, projects that are on hold, cancelled with the issues and its status such as requested, approved, planning, in progress, etc. Showcasing this set of slides titled Project Metrics Dashboard With Budget Allocation Portrait PDF. The topics addressed in these templates are Projects, Resource, Allocated Budget. All the content presented in this PPT design is completely editable. Download it and make adjustments in color, background, font etc. as per your unique business setting.
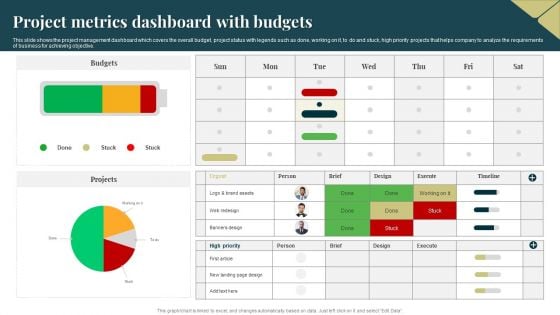
Project Metrics Dashboard With Budgets Topics PDF
This slide shows the project management dashboard which covers the overall budget, project status with legends such as done, working on it, to do and stuck, high priority projects that helps company to analyze the requirements of business for achieving objective. Pitch your topic with ease and precision using this Project Metrics Dashboard With Budgets Topics PDF. This layout presents information on Budgets, Projects, Banners Design. It is also available for immediate download and adjustment. So, changes can be made in the color, design, graphics or any other component to create a unique layout.
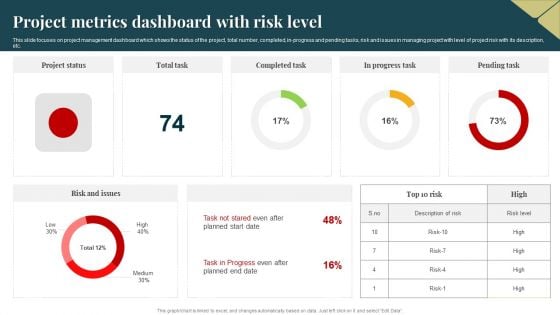
Project Metrics Dashboard With Risk Level Guidelines PDF
This slide focuses on project management dashboard which shows the status of the project, total number, completed, in progress and pending tasks, risk and issues in managing project with level of project risk with its description, etc. Pitch your topic with ease and precision using this Project Metrics Dashboard With Risk Level Guidelines PDF. This layout presents information on Project Metrics Dashboard, Risk Level. It is also available for immediate download and adjustment. So, changes can be made in the color, design, graphics or any other component to create a unique layout.
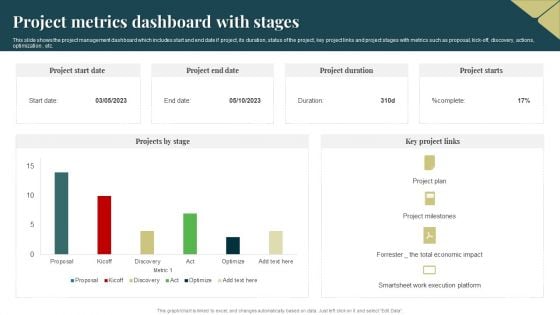
Project Metrics Dashboard With Stages Download PDF
This slide shows the project management dashboard which includes start and end date if project, its duration, status of the project, key project links and project stages with metrics such as proposal, kick off, discovery, actions, optimization , etc. Pitch your topic with ease and precision using this Project Metrics Dashboard With Stages Download PDF. This layout presents information on Economic, Project Plan, Execution. It is also available for immediate download and adjustment. So, changes can be made in the color, design, graphics or any other component to create a unique layout.
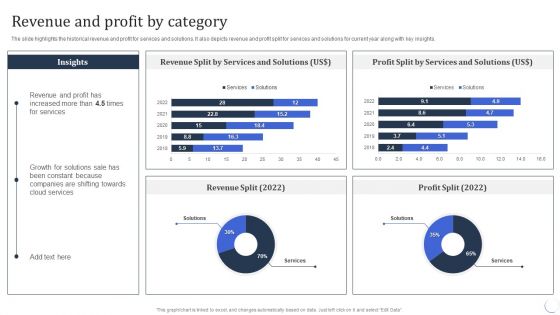
Infotech Solutions Research And Development Company Summary Revenue And Profit By Category Clipart PDF
The slide highlights the historical revenue and profit for services and solutions. It also depicts revenue and profit split for services and solutions for current year along with key insights. Deliver and pitch your topic in the best possible manner with this Infotech Solutions Research And Development Company Summary Revenue And Profit By Category Clipart PDF. Use them to share invaluable insights on Growth, Cloud Services, Revenue And Profit and impress your audience. This template can be altered and modified as per your expectations. So, grab it now.
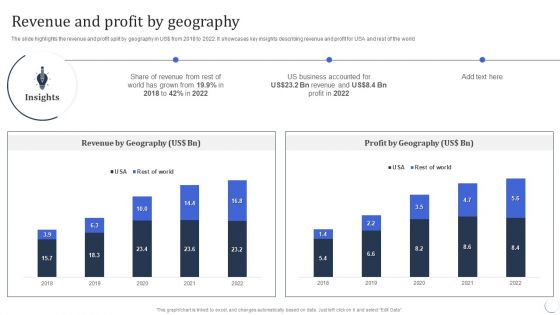
Infotech Solutions Research And Development Company Summary Revenue And Profit By Geography Introduction PDF
The slide highlights the revenue and profit split by geography in US dollar from 2018 to 2022. It showcases key insights describing revenue and profit for USA and rest of the world Deliver an awe inspiring pitch with this creative Infotech Solutions Research And Development Company Summary Revenue And Profit By Geography Introduction PDF bundle. Topics like Revenue, Profit By Geography can be discussed with this completely editable template. It is available for immediate download depending on the needs and requirements of the user.
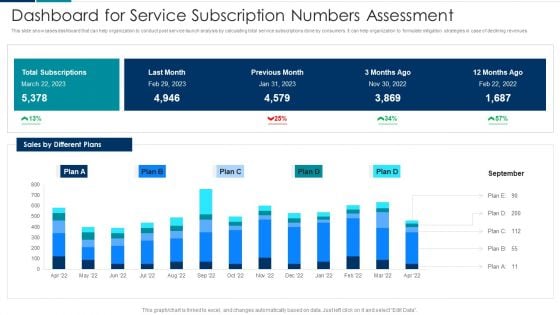
Managing New Service Roll Out And Marketing Procedure Dashboard For Service Subscription Numbers Assessment Clipart PDF
This slide showcases dashboard that can help organization to conduct post service launch analysis by calculating total service subscriptions done by consumers. It can help organization to formulate mitigation strategies in case of declining revenues. Deliver an awe inspiring pitch with this creative Managing New Service Roll Out And Marketing Procedure Dashboard For Service Subscription Numbers Assessment Clipart PDF bundle. Topics like Dashboard For Service, Subscription Numbers Assessment can be discussed with this completely editable template. It is available for immediate download depending on the needs and requirements of the user.
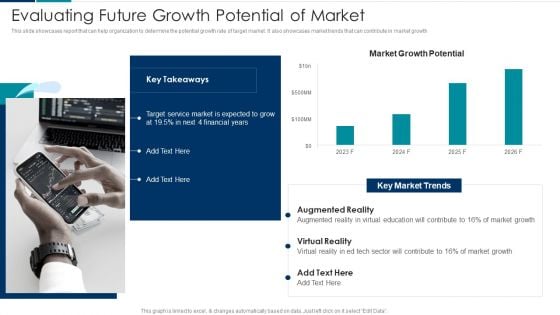
Managing New Service Roll Out And Marketing Procedure Evaluating Future Growth Potential Of Market Introduction PDF
This slide showcases report that can help organization to determine the potential growth rate of target market. It also showcases market trends that can contribute in market growth. Deliver and pitch your topic in the best possible manner with this Managing New Service Roll Out And Marketing Procedure Evaluating Future Growth Potential Of Market Introduction PDF. Use them to share invaluable insights on Target Service Market, Market Growth Potential, Virtual Reality and impress your audience. This template can be altered and modified as per your expectations. So, grab it now.
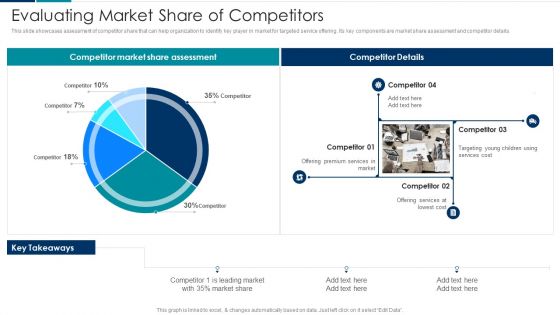
Managing New Service Roll Out And Marketing Procedure Evaluating Market Share Of Competitors Inspiration PDF
This slide showcases assessment of competitor share that can help organization to identify key player in market for targeted service offering. Its key components are market share assessment and competitor details. Deliver an awe inspiring pitch with this creative Managing New Service Roll Out And Marketing Procedure Evaluating Market Share Of Competitors Inspiration PDF bundle. Topics like Services Cost, Evaluating Market Share can be discussed with this completely editable template. It is available for immediate download depending on the needs and requirements of the user.
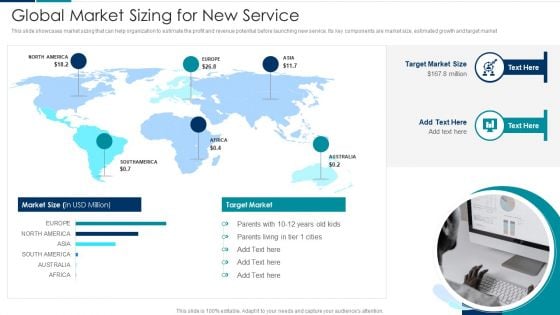
Managing New Service Roll Out And Marketing Procedure Global Market Sizing For New Service Inspiration PDF
This slide showcases market sizing that can help organization to estimate the profit and revenue potential before launching new service. Its key components are market size, estimated growth and target market. Deliver an awe inspiring pitch with this creative Managing New Service Roll Out And Marketing Procedure Global Market Sizing For New Service Inspiration PDF bundle. Topics like Market Size, Target Market, Global can be discussed with this completely editable template. It is available for immediate download depending on the needs and requirements of the user.
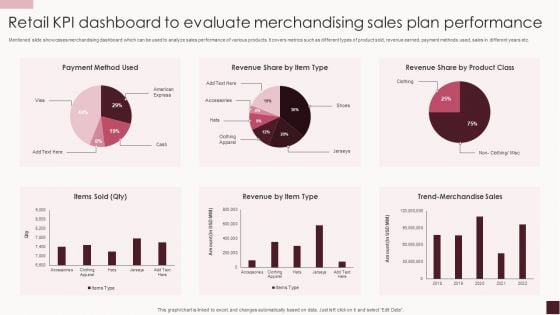
Retail KPI Dashboard To Evaluate Merchandising Sales Plan Performance Rules PDF
Mentioned slide showcases merchandising dashboard which can be used to analyze sales performance of various products. It covers metrics such as different types of product sold, revenue earned, payment methods used, sales in different years etc.Showcasing this set of slides titled Retail KPI Dashboard To Evaluate Merchandising Sales Plan Performance Rules PDF. The topics addressed in these templates are Clothing Apparel, Trend Merchandise, Items Sold. All the content presented in this PPT design is completely editable. Download it and make adjustments in color, background, font etc. as per your unique business setting.
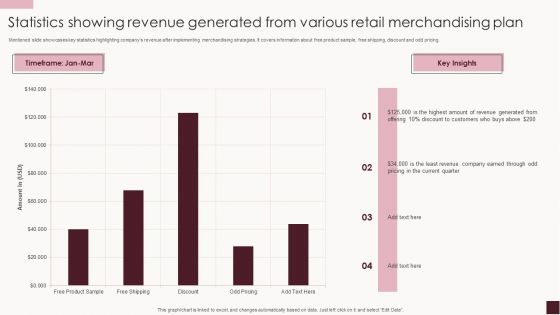
Statistics Showing Revenue Generated From Various Retail Merchandising Plan Background PDF
Mentioned slide showcases key statistics highlighting companys revenue after implementing merchandising strategies. It covers information about free product sample, free shipping, discount and odd pricing. Pitch your topic with ease and precision using this Statistics Showing Revenue Generated From Various Retail Merchandising Plan Background PDF. This layout presents information on Highest Amount, Discount Customers, Revenue Generated. It is also available for immediate download and adjustment. So, changes can be made in the color, design, graphics or any other component to create a unique layout.
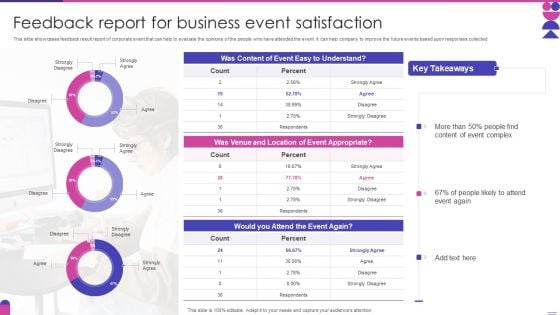
Feedback Report For Business Event Satisfaction Topics PDF
This slide showcases feedback result report of corporate event that can help to evaluate the opinions of the people who have attended the event. It can help company to improve the future events based upon responses collected. Showcasing this set of slides titled Feedback Report For Business Event Satisfaction Topics PDF. The topics addressed in these templates are Feedback Report, Business Event Satisfaction. All the content presented in this PPT design is completely editable. Download it and make adjustments in color, background, font etc. as per your unique business setting.
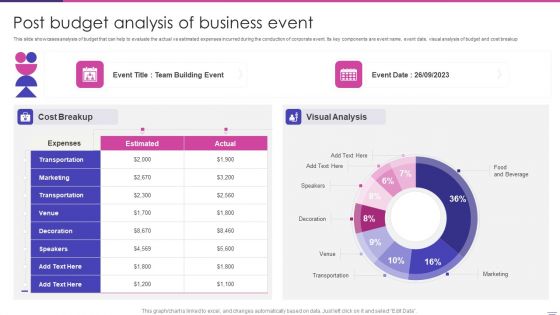
Post Budget Analysis Of Business Event Elements PDF
This slide showcases analysis of budget that can help to evaluate the actual vs estimated expenses incurred during the conduction of corporate event. Its key components are event name, event date, visual analysis of budget and cost breakup. Showcasing this set of slides titled Post Budget Analysis Of Business Event Elements PDF. The topics addressed in these templates are Marketing, Visual Analysis, Team Building Event. All the content presented in this PPT design is completely editable. Download it and make adjustments in color, background, font etc. as per your unique business setting.
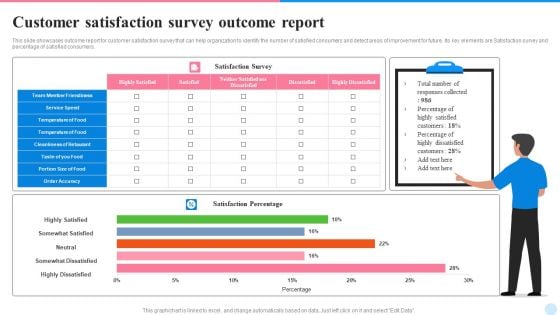
Customer Satisfaction Survey Outcome Report Template PDF
This slide showcases outcome report for customer satisfaction survey that can help organization to identify the number of satisfied consumers and detect areas of improvement for future. Its key elements are Satisfaction survey and percentage of satisfied consumers. Showcasing this set of slides titled Customer Satisfaction Survey Outcome Report Template PDF. The topics addressed in these templates are Customers, Satisfaction Survey, Service Speed. All the content presented in this PPT design is completely editable. Download it and make adjustments in color, background, font etc. as per your unique business setting.
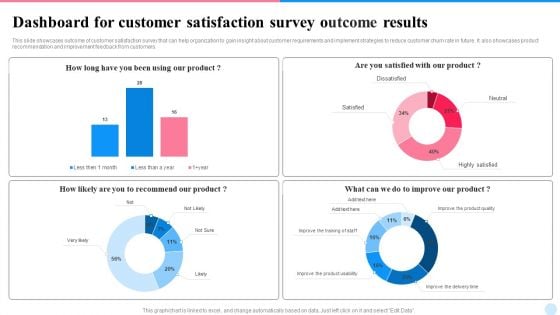
Dashboard For Customer Satisfaction Survey Outcome Results Topics PDF
This slide showcases outcome of customer satisfaction survey that can help organization to gain insight about customer requirements and implement strategies to reduce customer churn rate in future. It also showcases product recommendation and improvement feedback from customers. Pitch your topic with ease and precision using this Dashboard For Customer Satisfaction Survey Outcome Results Topics PDF. This layout presents information on Dashboard, Customer Satisfaction, Survey Outcome Results. It is also available for immediate download and adjustment. So, changes can be made in the color, design, graphics or any other component to create a unique layout.
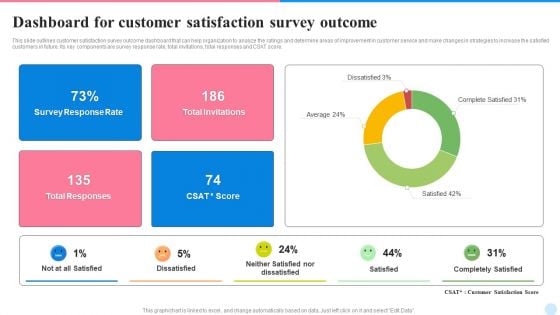
Dashboard For Customer Satisfaction Survey Outcome Demonstration PDF
This slide outlines customer satisfaction survey outcome dashboard that can help organization to analyze the ratings and determine areas of improvement in customer service and make changes in strategies to increase the satisfied customers in future. Its key components are survey response rate, total invitations, total responses and CSAT score. Showcasing this set of slides titled Dashboard For Customer Satisfaction Survey Outcome Demonstration PDF. The topics addressed in these templates are Total Invitations, Survey Response Rate, Total Responses. All the content presented in this PPT design is completely editable. Download it and make adjustments in color, background, font etc. as per your unique business setting.
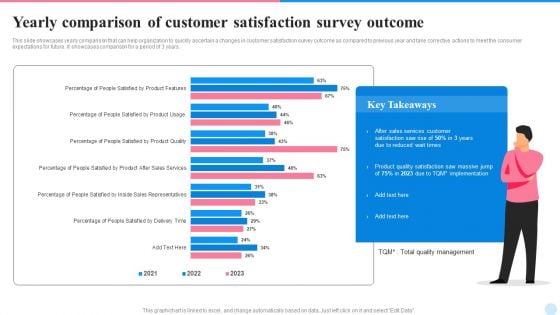
Yearly Comparison Of Customer Satisfaction Survey Outcome Demonstration PDF
This slide showcases yearly comparison that can help organization to quickly ascertain a changes in customer satisfaction survey outcome as compared to previous year and take corrective actions to meet the consumer expectations for future. It showcases comparison for a period of 3 years. Showcasing this set of slides titled Yearly Comparison Of Customer Satisfaction Survey Outcome Demonstration PDF. The topics addressed in these templates are Sales Services Customer, Implementation, Product Quality Satisfaction. All the content presented in this PPT design is completely editable. Download it and make adjustments in color, background, font etc. as per your unique business setting.

Customer Grievance Call Handling Dashboard With Abandon Rate Introduction PDF
This slide showcases dashboard that can help organization to identify the resolution time and average abandon rate of customer grievance calls. Its key components are average answer speed, avg calls or minute and overall satisfaction score. Showcasing this set of slides titled Customer Grievance Call Handling Dashboard With Abandon Rate Introduction PDF. The topics addressed in these templates are Customer Grievance Call Handling, Dashboard With Abandon Rate. All the content presented in this PPT design is completely editable. Download it and make adjustments in color, background, font etc. as per your unique business setting.
Weekly Customer Grievance Tracking Dashboard Designs PDF
This slide showcases dashboard that can help organization to identify the open and overdue status of customer grievance . It can guide managers to resolve the complaints and issues within stipulated time for customer satisfaction. Pitch your topic with ease and precision using this Weekly Customer Grievance Tracking Dashboard Designs PDF. This layout presents information on Average, Traffic Analysis, Customer Satisfaction Ratings. It is also available for immediate download and adjustment. So, changes can be made in the color, design, graphics or any other component to create a unique layout.
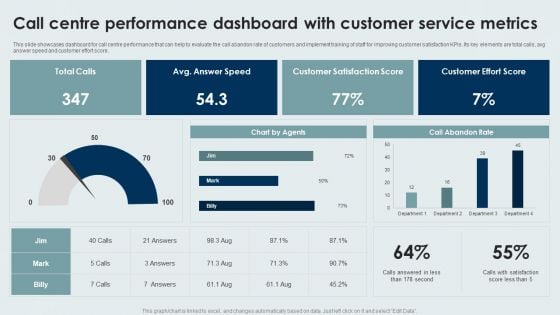
Call Centre Performance Dashboard With Customer Service Metrics Background PDF
This slide showcases dashboard for call centre performance that can help to evaluate the call abandon rate of customers and implement training of staff for improving customer satisfaction KPIs. Its key elements are total calls, avg answer speed and customer effort score. Showcasing this set of slides titled Call Centre Performance Dashboard With Customer Service Metrics Background PDF. The topics addressed in these templates are Call Centre Performance Dashboard, Customer Service Metrics. All the content presented in this PPT design is completely editable. Download it and make adjustments in color, background, font etc. as per your unique business setting.
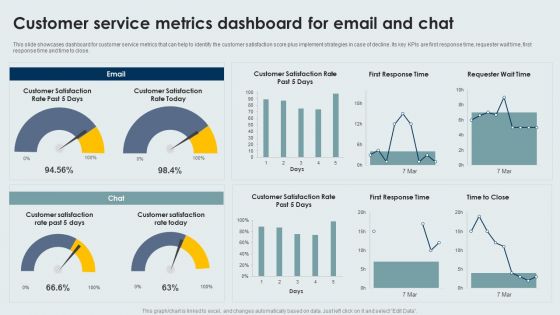
Customer Service Metrics Dashboard For Email And Chat Infographics PDF
This slide showcases dashboard for customer service metrics that can help to identify the customer satisfaction score plus implement strategies in case of decline. Its key KPIs are first response time, requester wait time, first response time and time to close. Pitch your topic with ease and precision using this Customer Service Metrics Dashboard For Email And Chat Infographics PDF. This layout presents information on Customer Service, Metrics Dashboard, Email And Chat. It is also available for immediate download and adjustment. So, changes can be made in the color, design, graphics or any other component to create a unique layout.
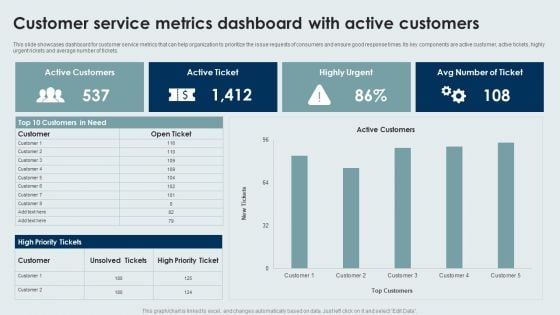
Customer Service Metrics Dashboard With Active Customers Ideas PDF
This slide showcases dashboard for customer service metrics that can help organization to prioritize the issue requests of consumers and ensure good response times. Its key components are active customer, active tickets, highly urgent rickets and average number of tickets. Showcasing this set of slides titled Customer Service Metrics Dashboard With Active Customers Ideas PDF. The topics addressed in these templates are Customer Service, Metrics Dashboard, Active Customers. All the content presented in this PPT design is completely editable. Download it and make adjustments in color, background, font etc. as per your unique business setting.
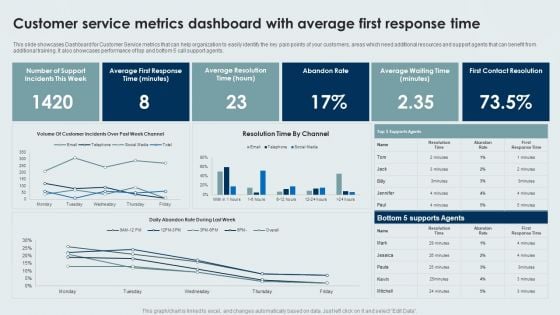
Customer Service Metrics Dashboard With Average First Response Time Background PDF
This slide showcases Dashboard for Customer Service metrics that can help organization to easily identify the key pain points of your customers, areas which need additional resources and support agents that can benefit from additional training. It also showcases performance of top and bottom 5 call support agents. Pitch your topic with ease and precision using this Customer Service Metrics Dashboard With Average First Response Time Background PDF. This layout presents information on Average, Abandon Rate, Contact Resolution. It is also available for immediate download and adjustment. So, changes can be made in the color, design, graphics or any other component to create a unique layout.
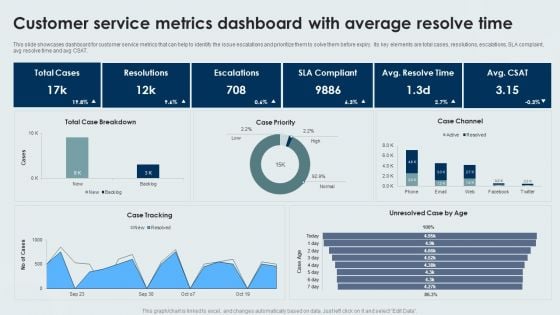
Customer Service Metrics Dashboard With Average Resolve Time Sample PDF
This slide showcases dashboard for customer service metrics that can help to identify the issue escalations and prioritize them to solve them before expiry. Its key elements are total cases, resolutions, escalations, SLA complaint, avg resolve time and avg CSAT. Showcasing this set of slides titled Customer Service Metrics Dashboard With Average Resolve Time Sample PDF. The topics addressed in these templates are Customer Service, Metrics Dashboard, Average Resolve Time. All the content presented in this PPT design is completely editable. Download it and make adjustments in color, background, font etc. as per your unique business setting.
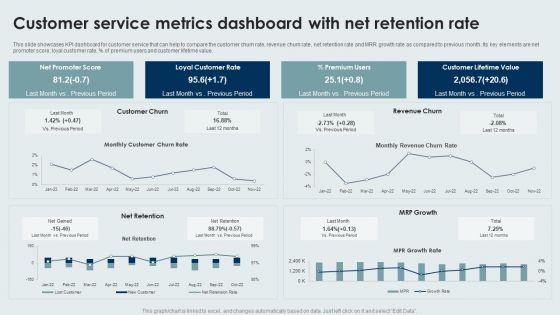
Customer Service Metrics Dashboard With Net Retention Rate Sample PDF
This slide showcases KPI dashboard for customer service that can help to compare the customer churn rate, revenue churn rate, net retention rate and MRR growth rate as compared to previous month. Its key elements are net promoter score, loyal customer rate, percentage of premium users and customer lifetime value. Pitch your topic with ease and precision using this Customer Service Metrics Dashboard With Net Retention Rate Sample PDF. This layout presents information on Loyal Customer Rate, Premium Users, Customer Lifetime Value. It is also available for immediate download and adjustment. So, changes can be made in the color, design, graphics or any other component to create a unique layout.
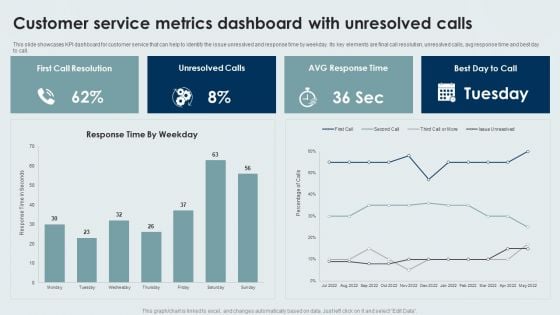
Customer Service Metrics Dashboard With Unresolved Calls Designs PDF
This slide showcases KPI dashboard for customer service that can help to identify the issue unresolved and response time by weekday. Its key elements are final call resolution, unresolved calls, avg response time and best day to call. Showcasing this set of slides titled Customer Service Metrics Dashboard With Unresolved Calls Designs PDF. The topics addressed in these templates are Customer Service, Metrics Dashboard, Unresolved Calls. All the content presented in this PPT design is completely editable. Download it and make adjustments in color, background, font etc. as per your unique business setting.
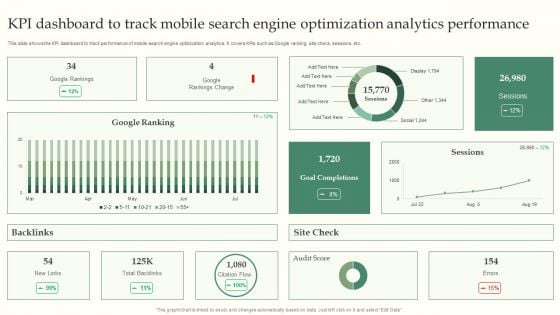
KPI Dashboard To Track Mobile Search Engine Optimization Analytics Performance Introduction PDF
This slide shows the KPI dashboard to track performance of mobile search engine optimization analytics. It covers KPIs such as Google ranking, site check, sessions, etc. Showcasing this set of slides titled KPI Dashboard To Track Mobile Search Engine Optimization Analytics Performance Introduction PDF. The topics addressed in these templates are KPI Dashboard, Search Engine Optimization, Analytics Performance. All the content presented in this PPT design is completely editable. Download it and make adjustments in color, background, font etc. as per your unique business setting.
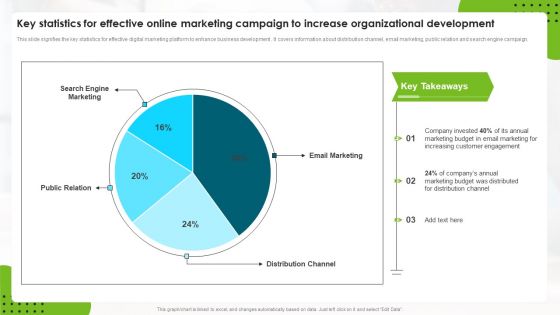
Key Statistics For Effective Online Marketing Campaign To Increase Organizational Development Formats PDF
This slide signifies the key statistics for effective digital marketing platform to enhance business development . It covers information about distribution channel, email marketing, public relation and search engine campaign. Showcasing this set of slides titled Key Statistics For Effective Online Marketing Campaign To Increase Organizational Development Formats PDF. The topics addressed in these templates are Marketing Budget, Email Marketing, Customer Engagement. All the content presented in this PPT design is completely editable. Download it and make adjustments in color, background, font etc. as per your unique business setting.
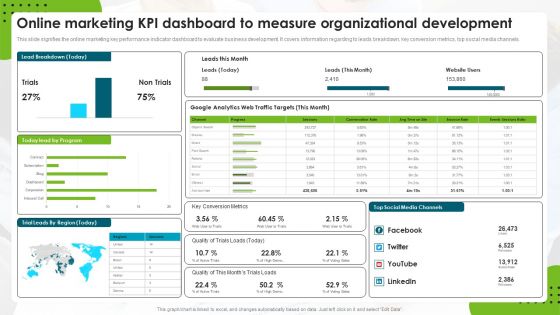
Online Marketing Kpi Dashboard To Measure Organizational Development Rules PDF
This slide signifies the online marketing key performance indicator dashboard to evaluate business development. It covers information regarding to leads breakdown, key conversion metrics, top social media channels. Pitch your topic with ease and precision using this Online Marketing Kpi Dashboard To Measure Organizational Development Rules PDF. This layout presents information on Web Traffic Targets, Google Analytics, Social Media Channels. It is also available for immediate download and adjustment. So, changes can be made in the color, design, graphics or any other component to create a unique layout.
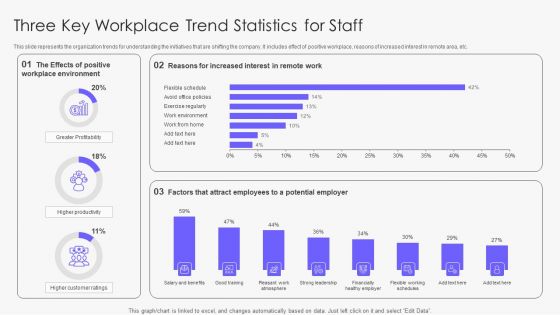
Three Key Workplace Trend Statistics For Staff Slides PDF
This slide represents the organization trends for understanding the initiatives that are shifting the company. It includes effect of positive workplace, reasons of increased interest in remote area, etc. Pitch your topic with ease and precision using this Three Key Workplace Trend Statistics For Staff Slides PDF. This layout presents information on Workplace Environment, Greater Profitability, Customer. It is also available for immediate download and adjustment. So, changes can be made in the color, design, graphics or any other component to create a unique layout.
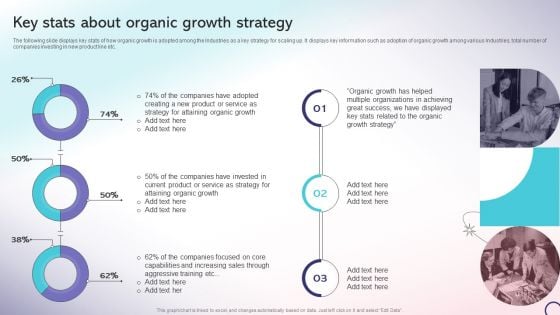
Key Stats About Organic Growth Strategy Strategic Playbook For Internal Sales Advancement Infographics PDF
The following slide displays key stats of how organic growth is adopted among the Industries as a key strategy for scaling up. It displays key information such as adoption of organic growth among various Industries, total number of companies investing in new product line etc. Deliver and pitch your topic in the best possible manner with this Key Stats About Organic Growth Strategy Strategic Playbook For Internal Sales Advancement Infographics PDF. Use them to share invaluable insights on Attaining Organic, Companies Invested, Service Strategy and impress your audience. This template can be altered and modified as per your expectations. So, grab it now.
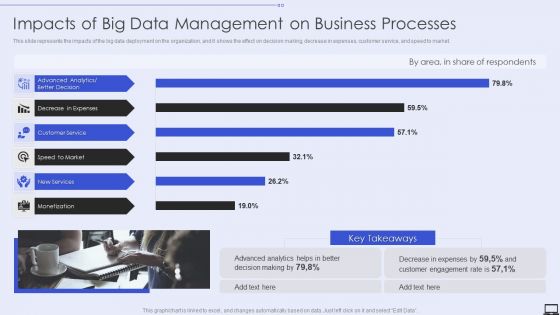
Impacts Of Big Data Management On Business Processes Ppt PowerPoint Presentation File Infographics PDF
This slide represents the impacts of the big data deployment on the organization, and it shows the effect on decision making, decrease in expenses, customer service, and speed to market. Deliver and pitch your topic in the best possible manner with this Impacts Of Big Data Management On Business Processes Ppt PowerPoint Presentation File Infographics PDF. Use them to share invaluable insights on Decision Making, Expenses, Customer Engagement Rate and impress your audience. This template can be altered and modified as per your expectations. So, grab it now.
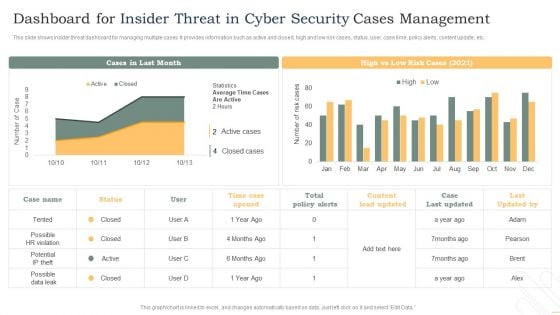
Dashboard For Insider Threat In Cyber Security Cases Management Background PDF
This slide shows insider threat dashboard for managing multiple cases. It provides information such as active and closed, high and low risk cases, status, user, case time, policy alerts, content update, etc. Showcasing this set of slides titled Dashboard For Insider Threat In Cyber Security Cases Management Background PDF. The topics addressed in these templates are Total Policy Alerts, High, Low, Time Case Opened. All the content presented in this PPT design is completely editable. Download it and make adjustments in color, background, font etc. as per your unique business setting.

Impact Of Insider Threat In Cyber Security On Business Operations Microsoft PDF
This slide shows impact of insider threat on business operations. It contains information about operational disruption, damaging brand image, loss of sensitive information, market value, etc. Pitch your topic with ease and precision using this Impact Of Insider Threat In Cyber Security On Business Operations Microsoft PDF. This layout presents information on Operational Disruption Or Outage, Brand Damage, Loss Critical Data. It is also available for immediate download and adjustment. So, changes can be made in the color, design, graphics or any other component to create a unique layout.
Insider Threat In Cyber Security Tracking Dashboard With User Details Portrait PDF
This slide shows user details tracked by insider threat dashboard. It provides information such as exposure events, file activity, archive, document, image, pdf, ppt, scripts, etc. Pitch your topic with ease and precision using this Insider Threat In Cyber Security Tracking Dashboard With User Details Portrait PDF. This layout presents information on Private Data, Exposure Events, User Activity, File Activity, Over Time. It is also available for immediate download and adjustment. So, changes can be made in the color, design, graphics or any other component to create a unique layout.
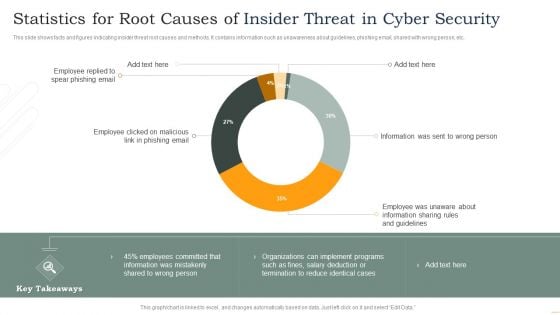
Statistics For Root Causes Of Insider Threat In Cyber Security Inspiration PDF
This slide shows facts and figures indicating insider threat root causes and methods. It contains information such as unawareness about guidelines, phishing email, shared with wrong person, etc. Showcasing this set of slides titled Statistics For Root Causes Of Insider Threat In Cyber Security Inspiration PDF. The topics addressed in these templates are Employee Replied, Spear Phishing Email, Employee Clicked, Phishing Email. All the content presented in this PPT design is completely editable. Download it and make adjustments in color, background, font etc. as per your unique business setting.
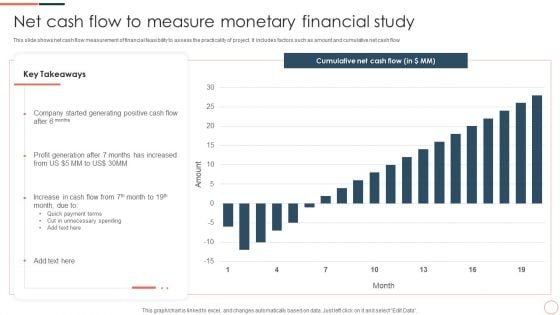
Net Cash Flow To Measure Monetary Financial Study Ppt Layouts Clipart Images PDF
This slide shows net cash flow measurement of financial feasibility to assess the practicality of project. It includes factors such as amount and cumulative net cash flow. Pitch your topic with ease and precision using this Net Cash Flow To Measure Monetary Financial Study Ppt Layouts Clipart Images PDF. This layout presents information on Cash Flow, Profit Generation, Quick Payment Terms. It is also available for immediate download and adjustment. So, changes can be made in the color, design, graphics or any other component to create a unique layout.
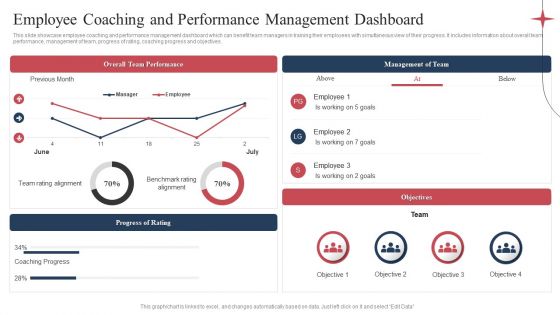
Employee Coaching And Performance Management Dashboard Microsoft PDF
This slide showcase employee coaching and performance management dashboard which can benefit team managers in training their employees with simultaneous view of their progress. It includes information about overall team performance, management of team, progress of rating, coaching progress and objectives. Showcasing this set of slides titled Employee Coaching And Performance Management Dashboard Microsoft PDF. The topics addressed in these templates are Overall Team Performance, Management Of Team, Objectives, Progress Of Rating. All the content presented in this PPT design is completely editable. Download it and make adjustments in color, background, font etc. as per your unique business setting.
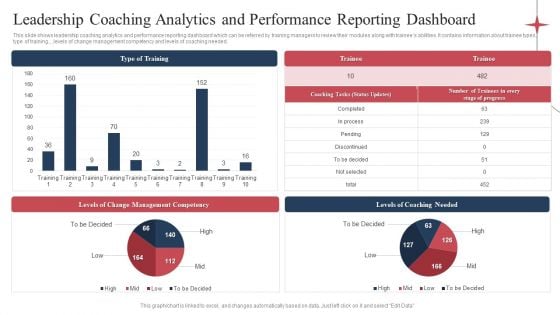
Leadership Coaching Analytics And Performance Reporting Dashboard Demonstration PDF
This slide shows leadership coaching analytics and performance reporting dashboard which can be referred by training managers to review their modules along with trainees abilities. It contains information about trainee types, type of training., ,levels of change management competency and levels of coaching needed. Pitch your topic with ease and precision using this Leadership Coaching Analytics And Performance Reporting Dashboard Demonstration PDF. This layout presents information on Levels Coaching Needed, Levels Change Management, Type Training. It is also available for immediate download and adjustment. So, changes can be made in the color, design, graphics or any other component to create a unique layout.
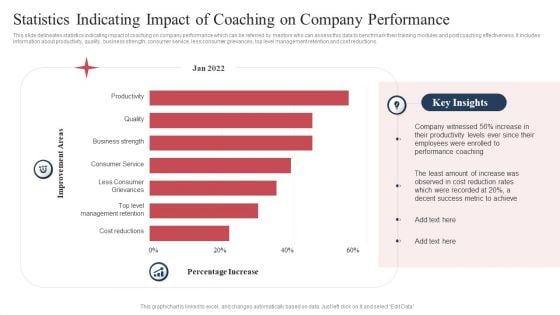
Statistics Indicating Impact Of Coaching On Company Performance Formats PDF
This slide delineates statistics indicating impact of coaching on company performance which can be referred by mentors who can assess this data to benchmark their training modules and post coaching effectiveness. It includes information about productivity, quality, business strength, consumer service, less consumer grievances, top level management retention and cost reductions. Pitch your topic with ease and precision using this Statistics Indicating Impact Of Coaching On Company Performance Formats PDF. This layout presents information on Productivity, Quality, Business Strength. It is also available for immediate download and adjustment. So, changes can be made in the color, design, graphics or any other component to create a unique layout.
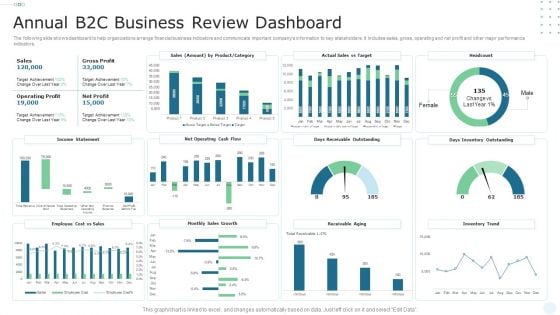
Annual B2C Business Review Dashboard Microsoft PDF
The following slide shows dashboard to help organizations arrange financial business indicators and communicate important companys information to key stakeholders. It includes sales, gross, operating and net profit and other major performance indicators. Showcasing this set of slides titled Annual B2C Business Review Dashboard Microsoft PDF. The topics addressed in these templates are Gross Profit, Sales, Operating Profit. All the content presented in this PPT design is completely editable. Download it and make adjustments in color, background, font etc. as per your unique business setting.
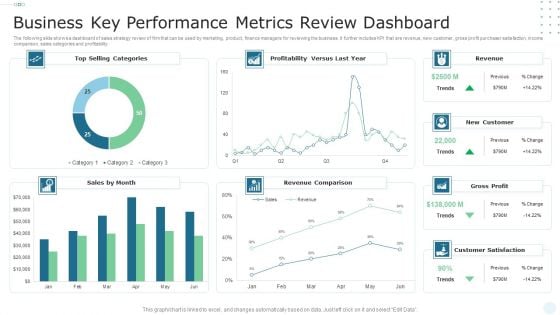
Business Key Performance Metrics Review Dashboard Portrait PDF
The following slide shows a dashboard of sales strategy review of firm that can be used by marketing, product, finance managers for reviewing the business. It further includes KPI that are revenue, new customer, gross profit purchaser satisfaction, income comparison, sales categories and profitability. Showcasing this set of slides titled Business Key Performance Metrics Review Dashboard Portrait PDF. The topics addressed in these templates are Sales, Revenue Comparison, Profitability. All the content presented in this PPT design is completely editable. Download it and make adjustments in color, background, font etc. as per your unique business setting.
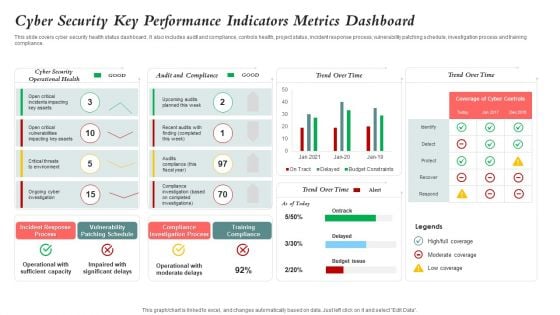
Cyber Security Key Performance Indicators Metrics Dashboard Mockup PDF
This slide covers cyber security health status dashboard . It also includes audit and compliance, controls health, project status, incident response process, vulnerability patching schedule, investigation process and training compliance. Pitch your topic with ease and precision using this Cyber Security Key Performance Indicators Metrics Dashboard Mockup PDF. This layout presents information on Cyber Security, Vulnerability Patching Schedule, Compliance Investigation Process. It is also available for immediate download and adjustment. So, changes can be made in the color, design, graphics or any other component to create a unique layout.
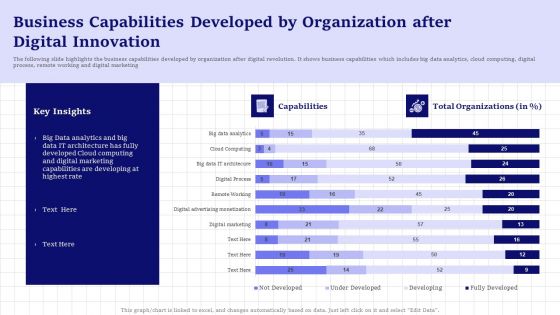
Business Capabilities Developed By Organization After Digital Innovation Information PDF
The following slide highlights the business capabilities developed by organization after digital revolution. It shows business capabilities which includes big data analytics, cloud computing, digital process, remote working and digital marketing Showcasing this set of slides titled Business Capabilities Developed By Organization After Digital Innovation Information PDF. The topics addressed in these templates are Capabilities, Highest Rate, Digital Marketing. All the content presented in this PPT design is completely editable. Download it and make adjustments in color, background, font etc. as per your unique business setting.
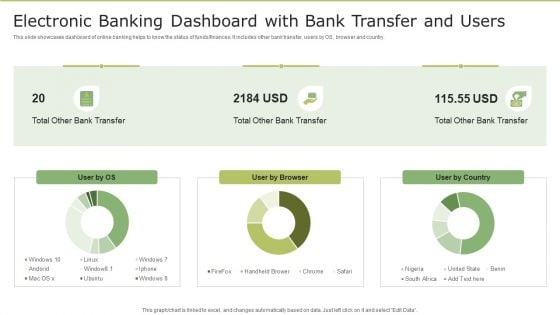
Electronic Banking Dashboard With Bank Transfer And Users Background PDF
This slide showcases dashboard of online banking helps to know the status of funds or finances. It includes other bank transfer, users by OS, browser and country. Pitch your topic with ease and precision using this Electronic Banking Dashboard With Bank Transfer And Users Background PDF. This layout presents information on Electronic Banking Dashboard, Bank Transfer And Users. It is also available for immediate download and adjustment. So, changes can be made in the color, design, graphics or any other component to create a unique layout.
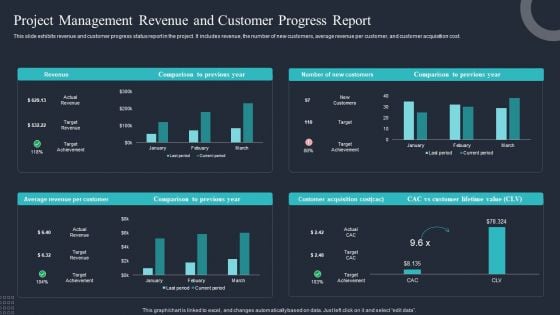
Project Management Revenue And Customer Progress Report Clipart PDF
This slide exhibits revenue and customer progress status report in the project. It includes revenue, the number of new customers, average revenue per customer, and customer acquisition cost. Pitch your topic with ease and precision using this Project Management Revenue And Customer Progress Report Clipart PDF. This layout presents information on Customer Acquisition Cost, Average Revenue, Per Customer. It is also available for immediate download and adjustment. So, changes can be made in the color, design, graphics or any other component to create a unique layout.
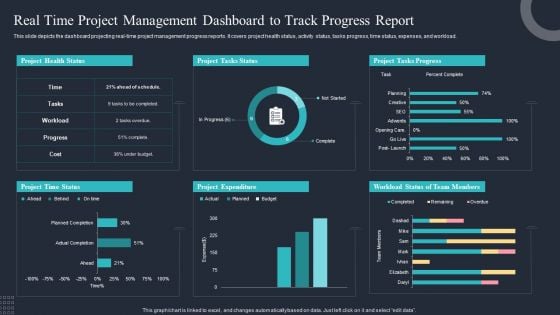
Real Time Project Management Dashboard To Track Progress Report Clipart PDF
This slide depicts the dashboard projecting real-time project management progress reports. It covers project health status, activity status, tasks progress, time status, expenses, and workload. Showcasing this set of slides titled Real Time Project Management Dashboard To Track Progress Report Clipart PDF. The topics addressed in these templates are Project Health Status, Project Tasks Status, Project Tasks Progress. All the content presented in this PPT design is completely editable. Download it and make adjustments in color, background, font etc. as per your unique business setting.
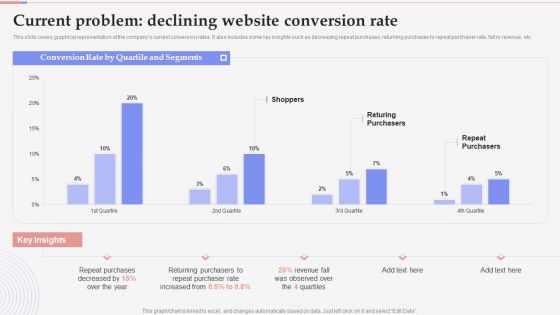
Consumer Retargeting Techniques Current Problem Declining Website Conversion Rate Topics PDF
This slide covers graphical representation of the companys current conversion rates. It also includes some key insights such as decreasing repeat purchases, returning purchases to repeat purchaser rate, fall in revenue, etc. Deliver and pitch your topic in the best possible manner with this Consumer Retargeting Techniques Current Problem Declining Website Conversion Rate Topics PDF. Use them to share invaluable insights on Repeat Purchases, Returning Purchasers, Quartile Segments and impress your audience. This template can be altered and modified as per your expectations. So, grab it now.
Consumer Retargeting Techniques Dashboard For Tracking Facebook Retargeting Campaign Ideas PDF
This slide covers metrics for analysing the results of Facebook retargeting campaign. It includes KPIs such as ad spend, cost per click, click-through rate, ad reach, post engagement, ad clicks, ad impressions, link clicks, etc. Deliver an awe inspiring pitch with this creative Consumer Retargeting Techniques Dashboard For Tracking Facebook Retargeting Campaign Ideas PDF bundle. Topics like Cost Thousand, Cost Per, Through Rate can be discussed with this completely editable template. It is available for immediate download depending on the needs and requirements of the user.
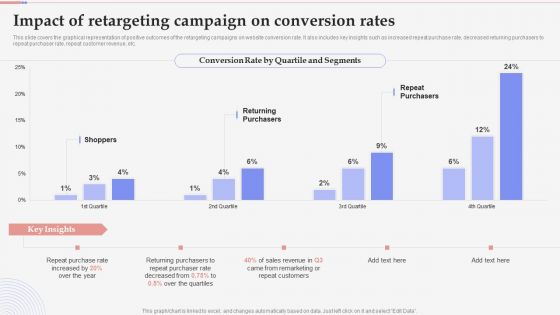
Consumer Retargeting Techniques Impact Of Retargeting Campaign On Conversion Rates Portrait PDF
This slide covers the graphical representation of positive outcomes of the retargeting campaigns on website conversion rate. It also includes key insights such as increased repeat purchase rate, decreased returning purchasers to repeat purchaser rate, repeat customer revenue, etc. Deliver and pitch your topic in the best possible manner with this Consumer Retargeting Techniques Impact Of Retargeting Campaign On Conversion Rates Portrait PDF. Use them to share invaluable insights on Returning Purchasers, Repeat Purchaser, Repeat Customers and impress your audience. This template can be altered and modified as per your expectations. So, grab it now.
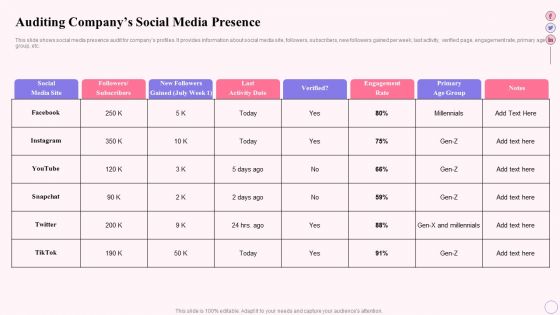
Integrating Social Media Tactics Auditing Companys Social Media Presence Clipart PDF
This slide shows social media presence audit for companys profiles. It provides information about social media site, followers, subscribers, new followers gained per week, last activity, verified page, engagement rate, primary age group, etc. Deliver and pitch your topic in the best possible manner with this Integrating Social Media Tactics Auditing Companys Social Media Presence Clipart PDF. Use them to share invaluable insights on Social Media Site, Facebook, Instagram and impress your audience. This template can be altered and modified as per your expectations. So, grab it now.
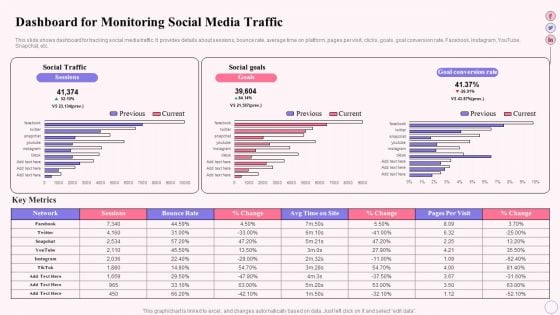
Integrating Social Media Tactics Dashboard For Monitoring Social Media Traffic Ideas PDF
This slide shows dashboard for tracking social media traffic. It provides details about sessions, bounce rate, average time on platform, pages per visit, clicks, goals, goal conversion rate, Facebook, Instagram, YouTube, Snapchat, etc. Deliver and pitch your topic in the best possible manner with this Integrating Social Media Tactics Dashboard For Monitoring Social Media Traffic Ideas PDF. Use them to share invaluable insights on Social Traffic, Social Goals, Goal Conversion Rate and impress your audience. This template can be altered and modified as per your expectations. So, grab it now.
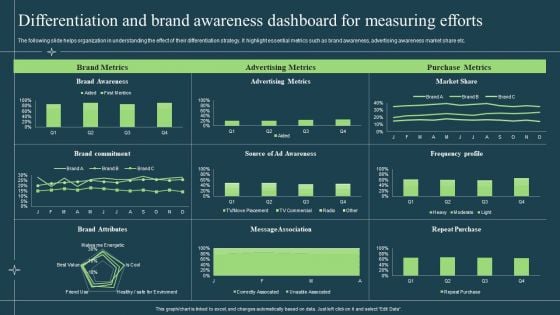
Differentiation Techniques Ways To Surpass Competitors Differentiation And Brand Awareness Dashboard For Measuring Efforts Template PDF
The following slide helps organization in understanding the effect of their differentiation strategy. It highlight essential metrics such as brand awareness, advertising awareness market share etc. Deliver and pitch your topic in the best possible manner with this Differentiation Techniques Ways To Surpass Competitors Differentiation And Brand Awareness Dashboard For Measuring Efforts Template PDF. Use them to share invaluable insights on Brand Awareness, Brand Metrics, Advertising Metrics and impress your audience. This template can be altered and modified as per your expectations. So, grab it now.
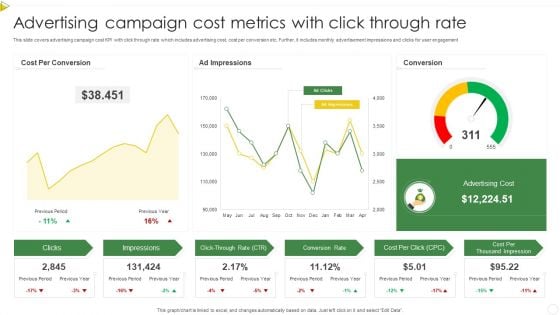
Advertising Campaign Cost Metrics With Click Through Rate Pictures PDF
This slide covers advertising campaign cost KPI with click through rate which includes advertising cost, cost per conversion etc. Further, it includes monthly advertisement impressions and clicks for user engagement. Showcasing this set of slides titled Advertising Campaign Cost Metrics With Click Through Rate Pictures PDF. The topics addressed in these templates are Conversion Rate, Cost Per Click, Advertising Cost. All the content presented in this PPT design is completely editable. Download it and make adjustments in color, background, font etc. as per your unique business setting.
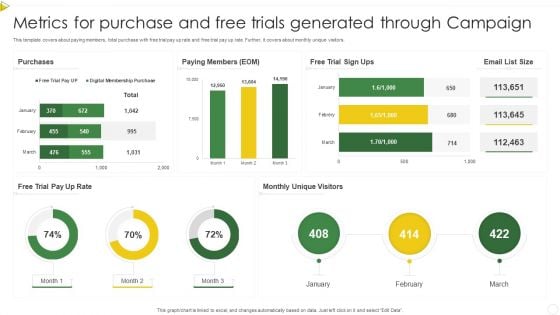
Metrics For Purchase And Free Trials Generated Through Campaign Slides PDF
This template covers about paying members, total purchase with free trial pay up rate and free trial pay up rate. Further, it covers about monthly unique visitors. Showcasing this set of slides titled Metrics For Purchase And Free Trials Generated Through Campaign Slides PDF. The topics addressed in these templates are Metrics For Purchase, Generated Through Campaign. All the content presented in this PPT design is completely editable. Download it and make adjustments in color, background, font etc. as per your unique business setting.
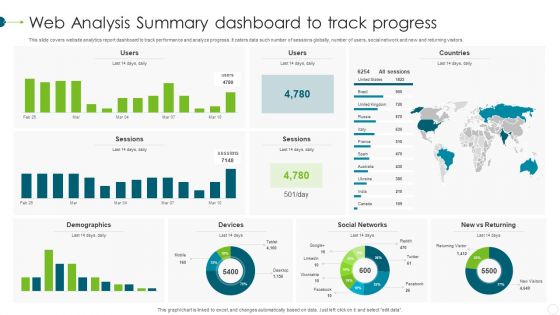
Web Analysis Summary Dashboard To Track Progress Elements PDF
This slide covers website analytics report dashboard to track performance and analyze progress. It caters data such number of sessions globally, number of users, social network and new and returning visitors. Showcasing this set of slides titled Web Analysis Summary Dashboard To Track Progress Elements PDF. The topics addressed in these templates are Demographics, Devices, Social Networks. All the content presented in this PPT design is completely editable. Download it and make adjustments in color, background, font etc. as per your unique business setting.
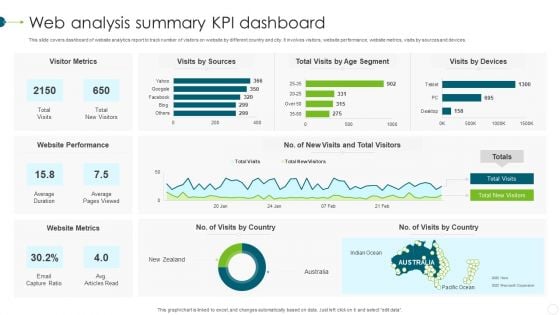
Web Analysis Summary KPI Dashboard Template PDF
This slide covers dashboard of website analytics report to track number of visitors on website by different country and city. It involves visitors, website performance, website metrics, visits by sources and devices. Showcasing this set of slides titled Web Analysis Summary KPI Dashboard Template PDF. The topics addressed in these templates are Website Metrics, Website Performance, Visitor Metrics. All the content presented in this PPT design is completely editable. Download it and make adjustments in color, background, font etc. as per your unique business setting.
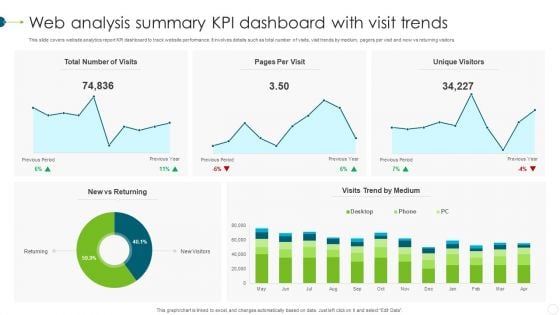
Web Analysis Summary KPI Dashboard With Visit Trends Professional PDF
This slide covers website analytics report KPI dashboard to track website performance. It involves details such as total number of visits, visit trends by medium, pagers per visit and new vs returning visitors. Pitch your topic with ease and precision using this Web Analysis Summary KPI Dashboard With Visit Trends Professional PDF. This layout presents information on Web Analysis Summary, KPI Dashboard, Visit Trends. It is also available for immediate download and adjustment. So, changes can be made in the color, design, graphics or any other component to create a unique layout.
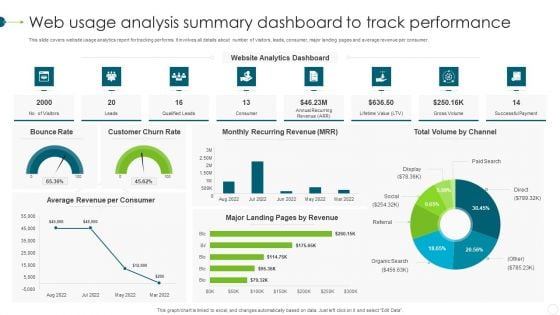
Web Usage Analysis Summary Dashboard To Track Performance Background PDF
This slide covers website usage analytics report for tracking performs. It involves all details about number of visitors, leads, consumer, major landing pages and average revenue per consumer. Showcasing this set of slides titled Web Usage Analysis Summary Dashboard To Track Performance Background PDF. The topics addressed in these templates are Customer Churn Rate, Bounce Rate, Monthly Recurring Revenue. All the content presented in this PPT design is completely editable. Download it and make adjustments in color, background, font etc. as per your unique business setting.

 Home
Home