Survey Infographic
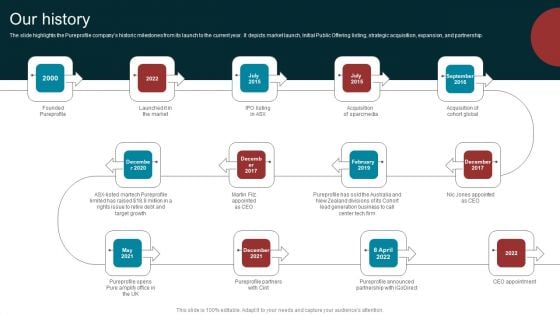
Marketing Agency Company Outline Our History Infographics PDF
The slide highlights the Pureprofile companys historic milestones from its launch to the current year. It depicts market launch, Initial Public Offering listing, strategic acquisition, expansion, and partnership. Do you know about Slidesgeeks Marketing Agency Company Outline Our History Infographics PDF. These are perfect for delivering any kind od presentation. Using it, create PowerPoint presentations that communicate your ideas and engage audiences. Save time and effort by using our pre designed presentation templates that are perfect for a wide range of topic. Our vast selection of designs covers a range of styles, from creative to business, and are all highly customizable and easy to edit. Download as a PowerPoint template or use them as Google Slides themes.
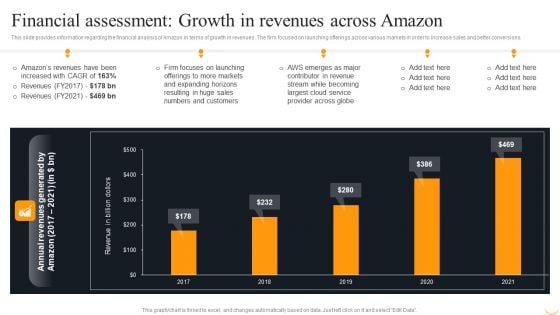
Financial Assessment Growth In Revenues Across Amazon Infographics PDF
This slide provides information regarding the financial analysis of Amazon in terms of growth in revenues. The firm focused on launching offerings across various markets in order to increase sales and better conversions. Slidegeeks is here to make your presentations a breeze with Financial Assessment Growth In Revenues Across Amazon Infographics PDF With our easy to use and customizable templates, you can focus on delivering your ideas rather than worrying about formatting. With a variety of designs to choose from, you are sure to find one that suits your needs. And with animations and unique photos, illustrations, and fonts, you can make your presentation pop. So whether you are giving a sales pitch or presenting to the board, make sure to check out Slidegeeks first.
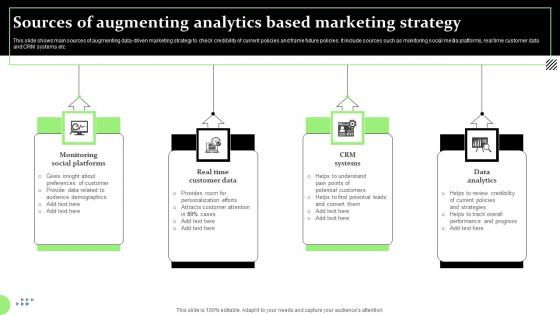
Sources Of Augmenting Analytics Based Marketing Strategy Infographics Pdf
This slide shows main sources of augmenting data driven marketing strategy to check credibility of current policies and frame future policies. It include sources such as monitoring social media platforms, real time customer data and CRM systems etc.Showcasing this set of slides titled Sources Of Augmenting Analytics Based Marketing Strategy Infographics Pdf The topics addressed in these templates are Monitoring Social Platforms, Real Time Customer Data, Data Analytics All the content presented in this PPT design is completely editable. Download it and make adjustments in color, background, font etc. as per your unique business setting. This slide shows main sources of augmenting data driven marketing strategy to check credibility of current policies and frame future policies. It include sources such as monitoring social media platforms, real time customer data and CRM systems etc.
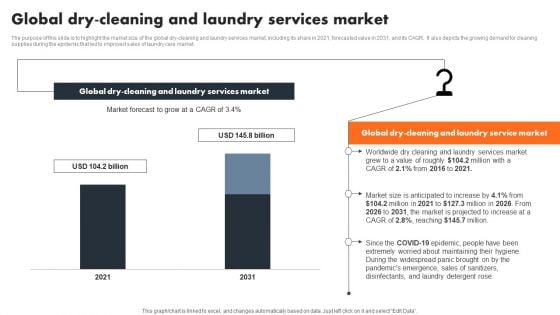
Global Dry Cleaning And Laundry Services Market Infographics PDF
The purpose of this slide is to highlight the market size of the global dry-cleaning and laundry services market, including its share in 2021, forecasted value in 2031, and its CAGR. It also depicts the growing demand for cleaning supplies during the epidemic that led to improved sales of laundry care market.The best PPT templates are a great way to save time, energy, and resources. Slidegeeks have 100 percent editable powerpoint slides making them incredibly versatile. With these quality presentation templates, you can create a captivating and memorable presentation by combining visually appealing slides and effectively communicating your message. Download Global Dry Cleaning And Laundry Services Market Infographics PDF from Slidegeeks and deliver a wonderful presentation.
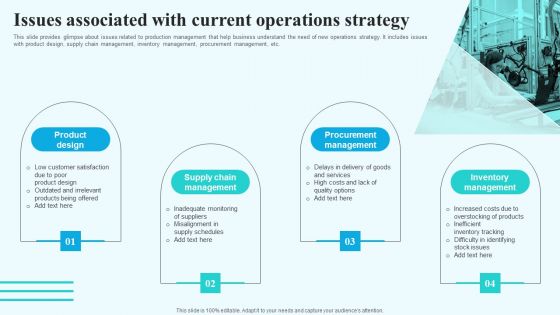
Issues Associated With Current Operations Strategy Infographics PDF
This slide provides glimpse about issues related to production management that help business understand the need of new operations strategy. It includes issues with product design, supply chain management, inventory management, procurement management, etc. Welcome to our selection of the Issues Associated With Current Operations Strategy Infographics PDF. These are designed to help you showcase your creativity and bring your sphere to life. Planning and Innovation are essential for any business that is just starting out. This collection contains the designs that you need for your everyday presentations. All of our PowerPoints are 100 percent editable, so you can customize them to suit your needs. This multi purpose template can be used in various situations. Grab these presentation templates today.
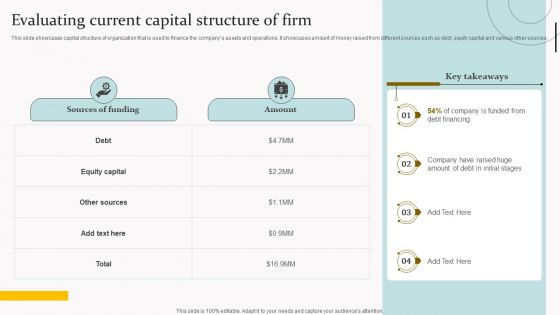
Evaluating Current Capital Structure Of Firm Infographics PDF
This slide showcases capital structure of organization that is used to finance the companys assets and operations. It showcases amount of money raised from different sources such as debt, equity capital and various other sources. Retrieve professionally designed Evaluating Current Capital Structure Of Firm Infographics PDF to effectively convey your message and captivate your listeners. Save time by selecting pre made slideshows that are appropriate for various topics, from business to educational purposes. These themes come in many different styles, from creative to corporate, and all of them are easily adjustable and can be edited quickly. Access them as PowerPoint templates or as Google Slides themes. You do not have to go on a hunt for the perfect presentation because Slidegeeks got you covered from everywhere.
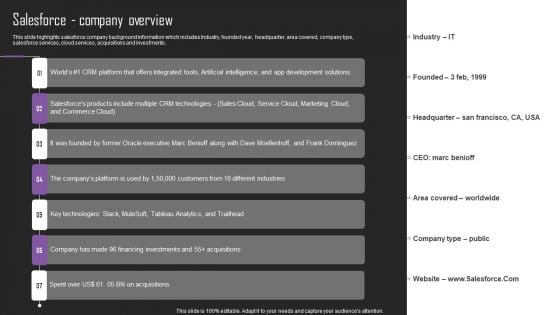
Web Hosting Software Company Outline Salesforce Company Overview Infographics PDF
This slide highlights salesforce company background information which includes Industry, founded year, headquarter, area covered, company type, salesforce services, cloud services, acquisitions and investments. Coming up with a presentation necessitates that the majority of the effort goes into the content and the message you intend to convey. The visuals of a PowerPoint presentation can only be effective if it supplements and supports the story that is being told. Keeping this in mind our experts created Web Hosting Software Company Outline Salesforce Company Overview Infographics PDF to reduce the time that goes into designing the presentation. This way, you can concentrate on the message while our designers take care of providing you with the right template for the situation.

Conflict Management Skills To Create Positive Work Environment Infographics PDF
The purpose of this slide is to outline major conflict management skills which can be used by the manager to foster positive environment in the organization. The major skills are effective communication, active listening, problem-solving, level-headedness and positive attitude. Want to ace your presentation in front of a live audience Our Conflict Management Skills To Create Positive Work Environment Infographics PDF can help you do that by engaging all the users towards you. Slidegeeks experts have put their efforts and expertise into creating these impeccable powerpoint presentations so that you can communicate your ideas clearly. Moreover, all the templates are customizable, and easy to edit and downloadable. Use these for both personal and commercial use.
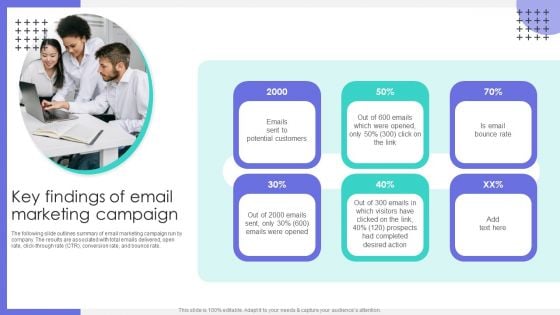
Key Findings Of Email Marketing Campaign Ppt Infographics Designs PDF
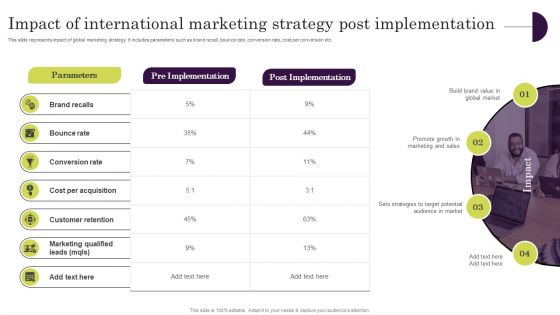
Impact Of International Marketing Strategy Post Implementation Infographics PDF
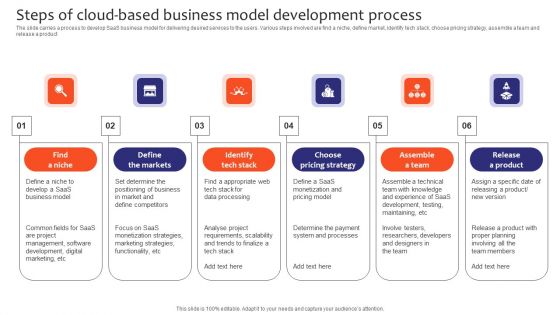
Steps Of Cloud Based Business Model Development Process Infographics PDF
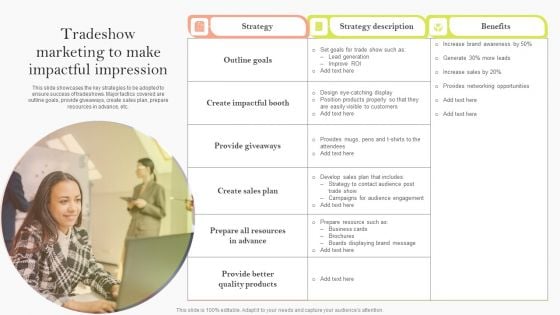
Tradeshow Marketing To Make Impactful Impression Ppt Infographics Introduction PDF
This slide showcases the key strategies to be adopted to ensure success of tradeshows. Major tactics covered are outline goals, provide giveaways, create sales plan, prepare resources in advance, etc. Present like a pro with Tradeshow Marketing To Make Impactful Impression Ppt Infographics Introduction PDF Create beautiful presentations together with your team, using our easy to use presentation slides. Share your ideas in real time and make changes on the fly by downloading our templates. So whether you are in the office, on the go, or in a remote location, you can stay in sync with your team and present your ideas with confidence. With Slidegeeks presentation got a whole lot easier. Grab these presentations today.
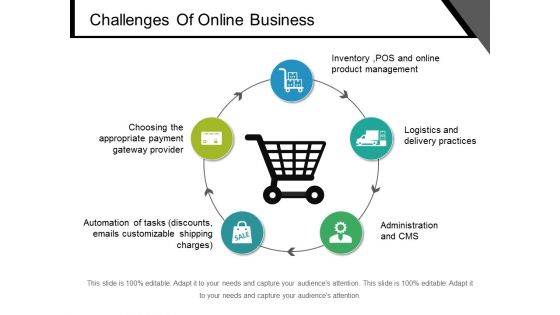
Challenges Of Online Business Ppt PowerPoint Presentation Show Infographics
This is a challenges of online business ppt powerpoint presentation show infographics. This is a five stage process. The stages in this process are checklist, list of ideas, pain points.
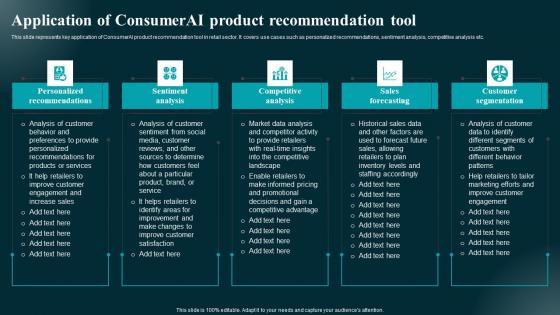
Application Of Consumerai Product Recommendation Applications And Impact Infographics Pdf
This slide represents key application of ConsumerAI product recommendation tool in retail sector. It covers use cases such as personalized recommendations, sentiment analysis, competitive analysis etc. From laying roadmaps to briefing everything in detail, our templates are perfect for you. You can set the stage with your presentation slides. All you have to do is download these easy-to-edit and customizable templates. Application Of Consumerai Product Recommendation Applications And Impact Infographics Pdf will help you deliver an outstanding performance that everyone would remember and praise you for. Do download this presentation today. This slide represents key application of ConsumerAI product recommendation tool in retail sector. It covers use cases such as personalized recommendations, sentiment analysis, competitive analysis etc.
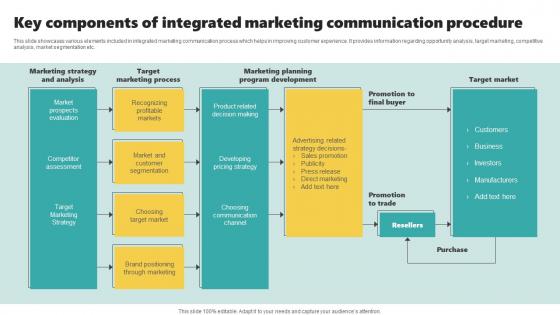
Key Components Of Integrated Marketing Communication Procedure Infographics Pdf
This slide showcases various elements included in integrated marketing communication process which helps in improving customer experience. It provides information regarding opportunity analysis, target marketing, competitive analysis, market segmentation etc. Pitch your topic with ease and precision using this Key Components Of Integrated Marketing Communication Procedure Infographics Pdf. This layout presents information on Target Marketing Process, Target Market, Purchase. It is also available for immediate download and adjustment. So, changes can be made in the color, design, graphics or any other component to create a unique layout. This slide showcases various elements included in integrated marketing communication process which helps in improving customer experience. It provides information regarding opportunity analysis, target marketing, competitive analysis, market segmentation etc.
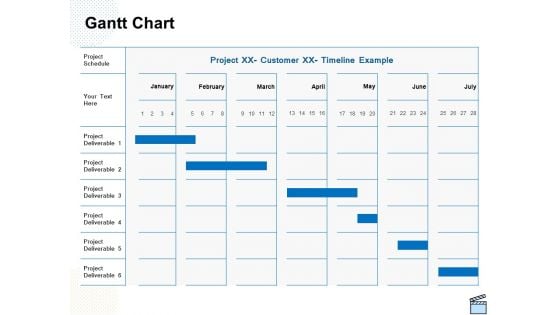
Professional Picture Proposal Gantt Chart Ppt Infographics Graphics Design PDF
Your complex projects can be managed and organized simultaneously using this detailed professional picture proposal gantt chart ppt infographics graphics design pdf template. Track the milestones, tasks, phases, activities, and subtasks to get an updated visual of your project. Share your planning horizon and release plan with this well crafted presentation template. This exemplary template can be used to plot various dependencies to distinguish the tasks in the pipeline and their impact on the schedules and deadlines of the project. Apart from this, you can also share this visual presentation with your team members and stakeholders. It a resourceful tool that can be incorporated into your business structure. Therefore, download and edit it conveniently to add the data and statistics as per your requirement.
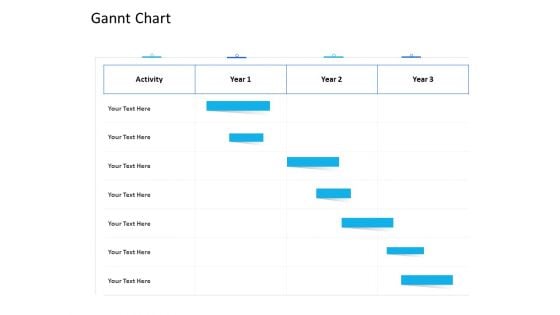
Organization Manpower Management Technology Gannt Chart Infographics PDF
Your complex projects can be managed and organized simultaneously using this detailed organization manpower management technology gannt chart infographics pdf template. Track the milestones, tasks, phases, activities, and subtasks to get an updated visual of your project. Share your planning horizon and release plan with this well crafted presentation template. This exemplary template can be used to plot various dependencies to distinguish the tasks in the pipeline and their impact on the schedules and deadlines of the project. Apart from this, you can also share this visual presentation with your team members and stakeholders. It a resourceful tool that can be incorporated into your business structure. Therefore, download and edit it conveniently to add the data and statistics as per your requirement.
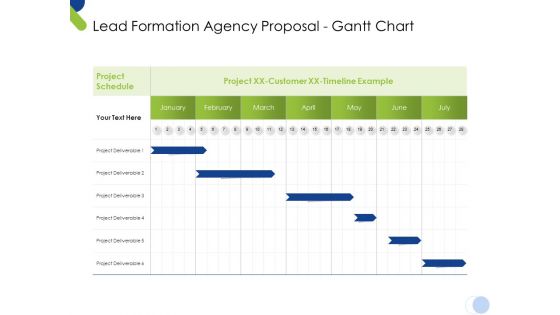
Lead Formation Agency Proposal Gantt Chart Ppt Summary Infographics PDF
Your complex projects can be managed and organized simultaneously using this detailed lead formation agency proposal gantt chart ppt summary infographics pdf template. Track the milestones, tasks, phases, activities, and subtasks to get an updated visual of your project. Share your planning horizon and release plan with this well crafted presentation template. This exemplary template can be used to plot various dependencies to distinguish the tasks in the pipeline and their impact on the schedules and deadlines of the project. Apart from this, you can also share this visual presentation with your team members and stakeholders. It a resourceful tool that can be incorporated into your business structure. Therefore, download and edit it conveniently to add the data and statistics as per your requirement.
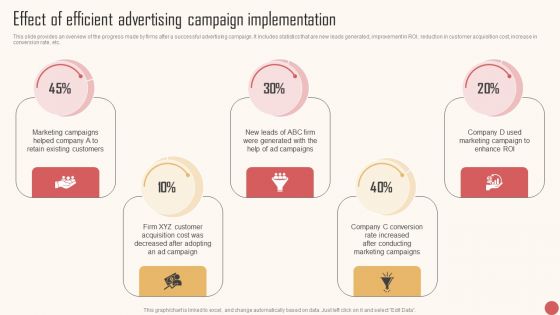
Effect Of Efficient Advertising Campaign Implementation Infographics PDF
This slide provides an overview of the progress made by firms after a successful advertising campaign. It includes statistics that are new leads generated, improvement in ROI, reduction in customer acquisition cost, increase in conversion rate, etc. Slidegeeks has constructed Effect Of Efficient Advertising Campaign Implementation Infographics PDF after conducting extensive research and examination. These presentation templates are constantly being generated and modified based on user preferences and critiques from editors. Here, you will find the most attractive templates for a range of purposes while taking into account ratings and remarks from users regarding the content. This is an excellent jumping-off point to explore our content and will give new users an insight into our top-notch PowerPoint Templates.
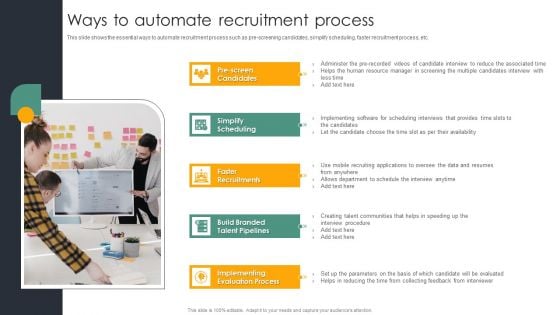
Automating Recruitment Process Ways To Automate Recruitment Process Infographics PDF
This slide shows the essential ways to automate recruitment process such as pre screening candidates, simplify scheduling, faster recruitment process, etc. Slidegeeks is here to make your presentations a breeze with Automating Recruitment Process Ways To Automate Recruitment Process Infographics PDF With our easy to use and customizable templates, you can focus on delivering your ideas rather than worrying about formatting. With a variety of designs to choose from, you are sure to find one that suits your needs. And with animations and unique photos, illustrations, and fonts, you can make your presentation pop. So whether you are giving a sales pitch or presenting to the board, make sure to check out Slidegeeks first.
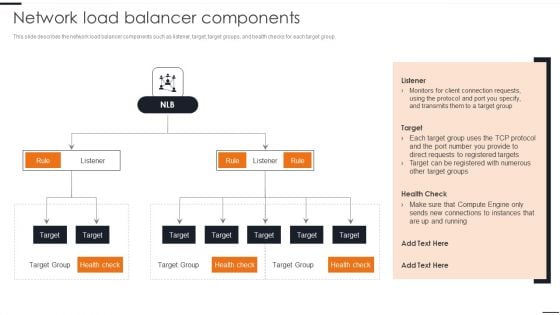
Elastic NLB Network Load Balancer Components Infographics PDF
This slide describes the network load balancer components such as listener, target, target groups, and health checks for each target group. Are you in need of a template that can accommodate all of your creative concepts. This one is crafted professionally and can be altered to fit any style. Use it with Google Slides or PowerPoint. Include striking photographs, symbols, depictions, and other visuals. Fill, move around, or remove text boxes as desired. Test out color palettes and font mixtures. Edit and save your work, or work with colleagues. Download Elastic NLB Network Load Balancer Components Infographics PDF and observe how to make your presentation outstanding. Give an impeccable presentation to your group and make your presentation unforgettable.
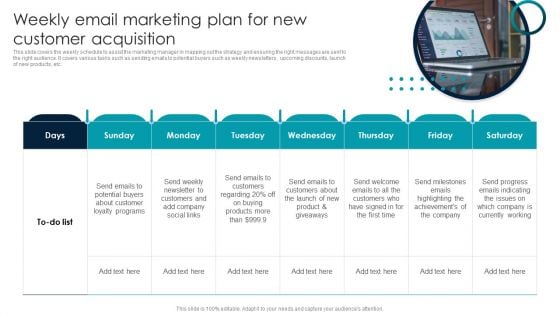
Weekly Email Marketing Plan For New Customer Acquisition Infographics PDF
This slide covers the weekly schedule to assist the marketing manager in mapping out the strategy and ensuring the right messages are sent to the right audience. It covers various tasks such as sending emails to potential buyers such as weekly newsletters, upcoming discounts, launch of new products, etc. If your project calls for a presentation, then Slidegeeks is your go to partner because we have professionally designed, easy to edit templates that are perfect for any presentation. After downloading, you can easily edit Weekly Email Marketing Plan For New Customer Acquisition Infographics PDF and make the changes accordingly. You can rearrange slides or fill them with different images. Check out all the handy templates.
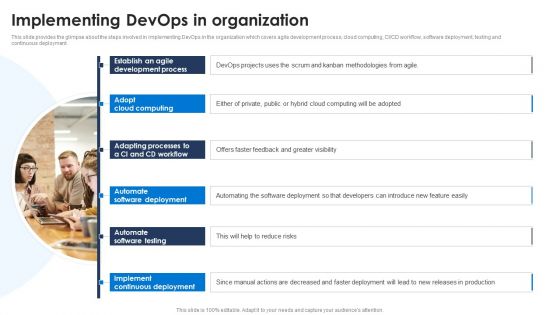
Implementing Devops In Organization Ppt PowerPoint Presentation File Infographics PDF
This slide provides the glimpse about the steps involved in implementing DevOps in the organization which covers agile development process, cloud computing, CI or CD workflow, software deployment, testing and continuous deployment. Slidegeeks is here to make your presentations a breeze with Implementing Devops In Organization Ppt PowerPoint Presentation File Infographics PDF With our easy to use and customizable templates, you can focus on delivering your ideas rather than worrying about formatting. With a variety of designs to choose from, you are sure to find one that suits your needs. And with animations and unique photos, illustrations, and fonts, you can make your presentation pop. So whether you are giving a sales pitch or presenting to the board, make sure to check out Slidegeeks first.
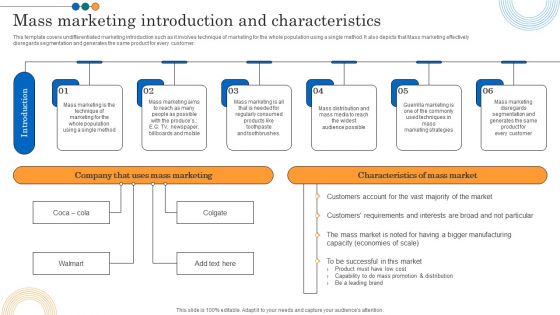
Implementing Marketing Strategies Mass Marketing Introduction And Characteristics Infographics PDF
This template covers undifferentiated marketing introduction such as it involves technique of marketing for the whole population using a single method. It also depicts that Mass marketing effectively disregards segmentation and generates the same product for every customer. Slidegeeks is here to make your presentations a breeze with Implementing Marketing Strategies Mass Marketing Introduction And Characteristics Infographics PDF With our easy-to-use and customizable templates, you can focus on delivering your ideas rather than worrying about formatting. With a variety of designs to choose from, you are sure to find one that suits your needs. And with animations and unique photos, illustrations, and fonts, you can make your presentation pop. So whether you are giving a sales pitch or presenting to the board, make sure to check out Slidegeeks first.
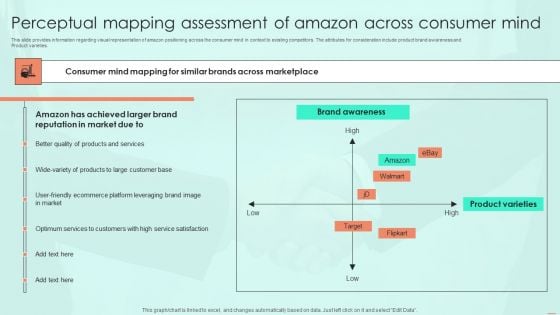
Perceptual Mapping Assessment Of Amazon Across Consumer Mind Infographics PDF
This slide provides information regarding visual representation of amazon positioning across the consumer mind in context to existing competitors. The attributes for consideration include product brand awareness and Product varieties. Slidegeeks is here to make your presentations a breeze with Perceptual Mapping Assessment Of Amazon Across Consumer Mind Infographics PDF With our easy to use and customizable templates, you can focus on delivering your ideas rather than worrying about formatting. With a variety of designs to choose from, you are sure to find one that suits your needs. And with animations and unique photos, illustrations, and fonts, you can make your presentation pop. So whether you are giving a sales pitch or presenting to the board, make sure to check out Slidegeeks first
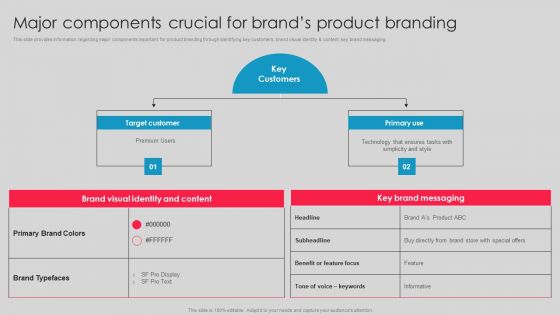
Major Components Crucial For Brands Product Branding Infographics PDF
This slide provides information regarding major components important for product branding through identifying key customers, brand visual identity and content, key brand messaging. Slidegeeks is here to make your presentations a breeze with Major Components Crucial For Brands Product Branding Infographics PDF With our easy to use and customizable templates, you can focus on delivering your ideas rather than worrying about formatting. With a variety of designs to choose from, you are sure to find one that suits your needs. And with animations and unique photos, illustrations, and fonts, you can make your presentation pop. So whether you are giving a sales pitch or presenting to the board, make sure to check out Slidegeeks first.
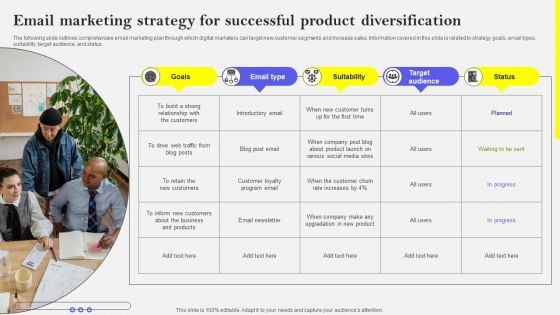
Email Marketing Strategy For Successful Product Diversification Infographics PDF
The following slide outlines comprehensive email marketing plan through which digital marketers can target new customer segments and increase sales. Information covered in this slide is related to strategy goals, email types, suitability, target audience, and status. Slidegeeks is here to make your presentations a breeze with Email Marketing Strategy For Successful Product Diversification Infographics PDF With our easy-to-use and customizable templates, you can focus on delivering your ideas rather than worrying about formatting. With a variety of designs to choose from, you are sure to find one that suits your needs. And with animations and unique photos, illustrations, and fonts, you can make your presentation pop. So whether you are giving a sales pitch or presenting to the board, make sure to check out Slidegeeks first
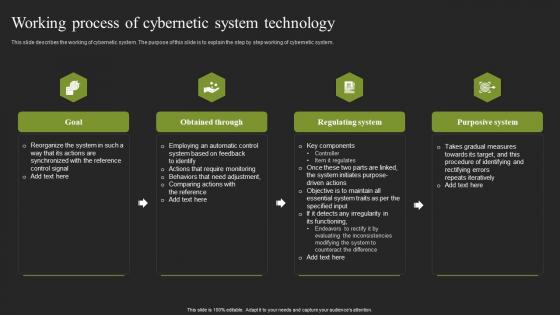
Working Process Of Cybernetic System Technology Cybernetic Systems Infographics Pdf
This slide describes the working of cybernetic system. The purpose of this slide is to explain the step by step working of cybernetic system. If your project calls for a presentation, then Slidegeeks is your go to partner because we have professionally designed, easy to edit templates that are perfect for any presentation. After downloading, you can easily edit Working Process Of Cybernetic System Technology Cybernetic Systems Infographics Pdf and make the changes accordingly. You can rearrange slides or fill them with different images. Check out all the handy templates This slide describes the working of cybernetic system. The purpose of this slide is to explain the step by step working of cybernetic system.
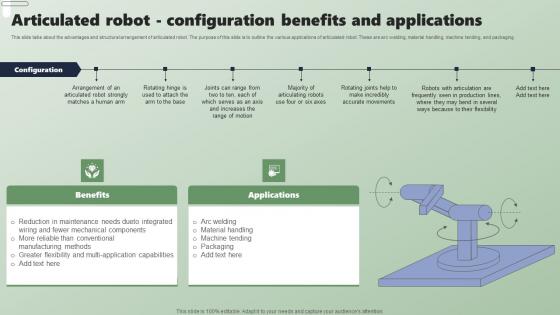
Articulated Robot Configuration Benefits Applications Of Industrial Robots Infographics Pdf
This slide talks about the advantages and structural arrangement of articulated robot. The purpose of this slide is to outline the various applications of articulated robot. These are arc welding, material handling, machine tending, and packaging. Slidegeeks is here to make your presentations a breeze with Articulated Robot Configuration Benefits Applications Of Industrial Robots Infographics Pdf With our easy-to-use and customizable templates, you can focus on delivering your ideas rather than worrying about formatting. With a variety of designs to choose from, you are sure to find one that suits your needs. And with animations and unique photos, illustrations, and fonts, you can make your presentation pop. So whether you are giving a sales pitch or presenting to the board, make sure to check out Slidegeeks first This slide talks about the advantages and structural arrangement of articulated robot. The purpose of this slide is to outline the various applications of articulated robot. These are arc welding, material handling, machine tending, and packaging.
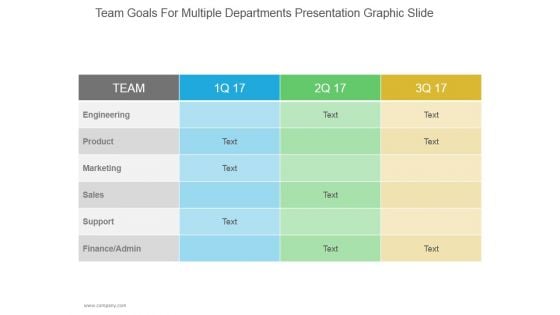
Team Goals For Multiple Departments Ppt PowerPoint Presentation Infographics
This is a team goals for multiple departments ppt powerpoint presentation infographic. This is a three stage process. The stages in this process are engineering, product, marketing, sales, support, finance admin.
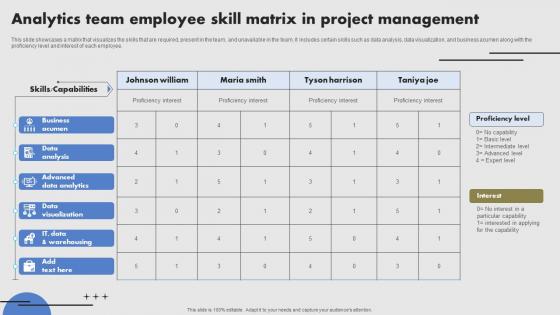
Analytics Team Employee Skill Matrix In Project Management Infographics Pdf
This slide showcases a matrix that visualizes the skills that are required, present in the team, and unavailable in the team. It includes certain skills such as data analysis, data visualization, and business acumen along with the proficiency level and interest of each employee. Showcasing this set of slides titled Analytics Team Employee Skill Matrix In Project Management Infographics Pdf. The topics addressed in these templates are Data Analysis, Advanced Data Analytics. All the content presented in this PPT design is completely editable. Download it and make adjustments in color, background, font etc. as per your unique business setting. This slide showcases a matrix that visualizes the skills that are required, present in the team, and unavailable in the team. It includes certain skills such as data analysis, data visualization, and business acumen along with the proficiency level and interest of each employee.
Six Staged Infographics Square With Business Icons Powerpoint Templates
This business diagram displays circular puzzle infographic. This editable slide is suitable to present global communication. Use this diagram for business and finance related topics and display complete data analysis in your presentation.
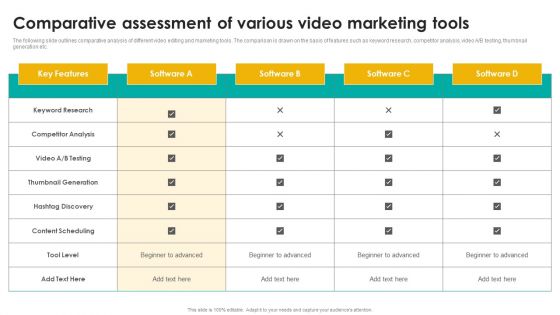
Comparative Assessment Of Various Video Marketing Tools Infographics PDF
The following slide outlines comparative analysis of different video editing and marketing tools. The comparison is drawn on the basis of features such as keyword research, competitor analysis, video A or B testing, thumbnail generation etc. This Comparative Assessment Of Various Video Marketing Tools Infographics PDF from Slidegeeks makes it easy to present information on your topic with precision. It provides customization options, so you can make changes to the colors, design, graphics, or any other component to create a unique layout. It is also available for immediate download, so you can begin using it right away. Slidegeeks has done good research to ensure that you have everything you need to make your presentation stand out. Make a name out there for a brilliant performance.
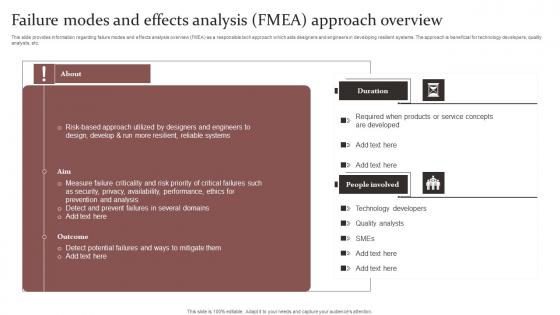
Failure Modes And Effects Responsible Technology Governance Manual Infographics Pdf
This slide provides information regarding failure modes and effects analysis overview FMEA as a responsible tech approach which aids designers and engineers in developing resilient systems. The approach is beneficial for technology developers, quality analysts, etc. Are you in need of a template that can accommodate all of your creative concepts This one is crafted professionally and can be altered to fit any style. Use it with Google Slides or PowerPoint. Include striking photographs, symbols, depictions, and other visuals. Fill, move around, or remove text boxes as desired. Test out color palettes and font mixtures. Edit and save your work, or work with colleagues. Download Failure Modes And Effects Responsible Technology Governance Manual Infographics Pdf and observe how to make your presentation outstanding. Give an impeccable presentation to your group and make your presentation unforgettable. This slide provides information regarding failure modes and effects analysis overview FMEA as a responsible tech approach which aids designers and engineers in developing resilient systems. The approach is beneficial for technology developers, quality analysts, etc.

System Checklist Questions Ppt PowerPoint Presentation Slides Infographics
This is a system checklist questions ppt powerpoint presentation slides infographics. This is a three stage process. The stages in this process are agenda, success, business, marketing, strategy, planning.
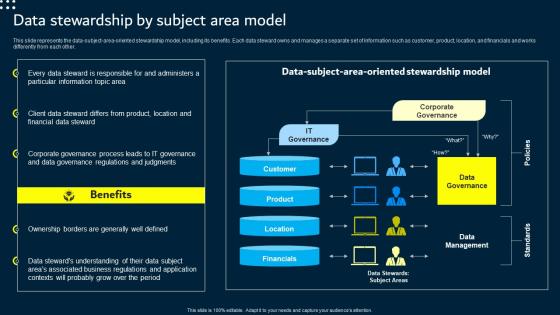
Data Stewardship By Subject Area Model Data Custodianship Infographics Pdf
This slide represents the data subject area oriented stewardship model, including its benefits. Each data steward owns and manages a separate set of information such as customer, product, location, and financials and works differently from each other. Do you know about Slidesgeeks Data Stewardship By Subject Area Model Data Custodianship Infographics Pdf These are perfect for delivering any kind od presentation. Using it, create PowerPoint presentations that communicate your ideas and engage audiences. Save time and effort by using our pre designed presentation templates that are perfect for a wide range of topic. Our vast selection of designs covers a range of styles, from creative to business, and are all highly customizable and easy to edit. Download as a PowerPoint template or use them as Google Slides themes. This slide represents the data subject area oriented stewardship model, including its benefits. Each data steward owns and manages a separate set of information such as customer, product, location, and financials and works differently from each other.
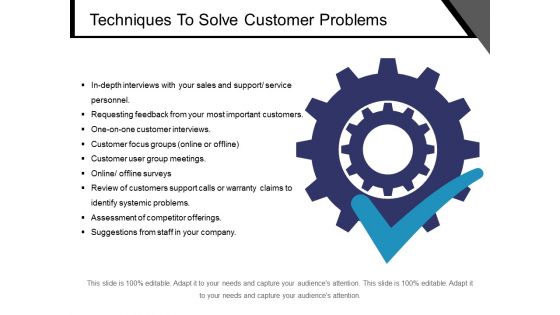
Techniques To Solve Customer Problems Ppt PowerPoint Presentation Pictures Infographics
This is a techniques to solve customer problems ppt powerpoint presentation pictures infographics. This is a one stage process. The stages in this process are checklist, list of ideas, pain points.
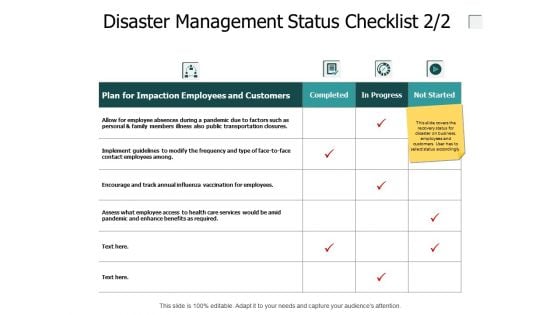
Disaster Management Status Checklist Measuring Ppt PowerPoint Presentation Outline Infographics
Presenting this set of slides with name disaster management status checklist measuring ppt powerpoint presentation outline infographics. The topics discussed in these slides are business, planning, strategy, marketing, management. This is a completely editable PowerPoint presentation and is available for immediate download. Download now and impress your audience.
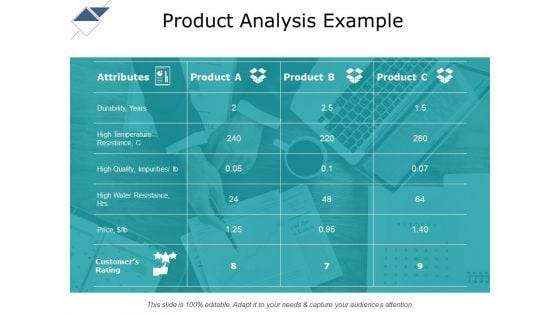
Product Analysis Example Ppt PowerPoint Presentation Slides Infographics
This is a product analysis example ppt powerpoint presentation slides infographics. This is a four stage process. The stages in this process are product, high quality, durability, analysis.
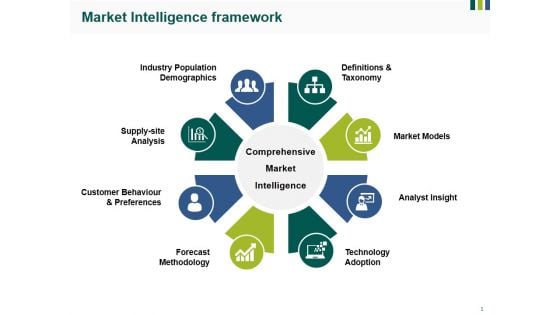
Market Intelligence Framework Ppt PowerPoint Presentation Outline Infographics
This is a market intelligence framework ppt powerpoint presentation outline infographics. This is a eight stage process. The stages in this process are definitions and taxonomy, market models, analyst insight, technology adoption, forecast methodology, supply site analysis.
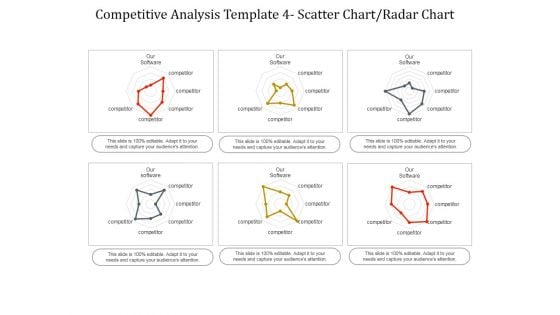
Competitive Analysis Scatter Chart Radar Chart Ppt PowerPoint Presentation Infographics
This is a competitive analysis scatter chart radar chart ppt powerpoint presentation infographics. This is a eight stage process. The stages in this process are users interface, data import, example, pricing, support, update, tutorials, easy to use.
Thesis Defense Presentation Outline Ppt PowerPoint Presentation Icon Infographics
This is a thesis defense presentation outline ppt powerpoint presentation icon infographics. This is a nine stage process. The stages in this process are title slide, introduction, purpose, methods, statistical analysis, results, discussion.
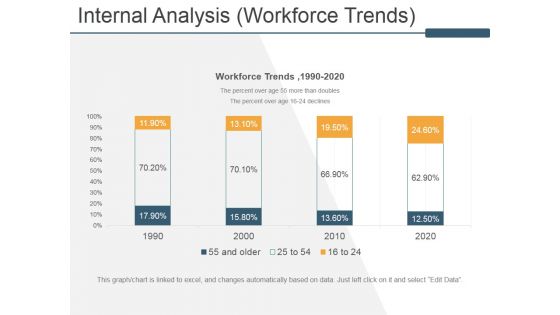
Internal Analysis Workforce Trends Ppt PowerPoint Presentation Model Infographics
This is a internal analysis workforce trends ppt powerpoint presentation model infographics. This is a four stage process. The stages in this process are workforce trends, internal analysis, business, marketing, success.
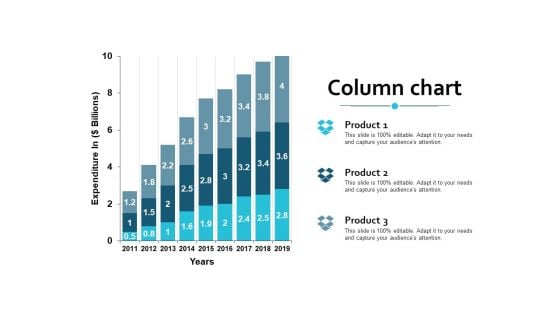
Column Chart Analysis Ppt Powerpoint Presentation Summary Infographics
This is a column chart analysis ppt powerpoint presentation summary infographics. This is a three stage process. The stages in this process are column chart, finance, marketing, management, analysiscolumn chart, finance, marketing, management, analysis.
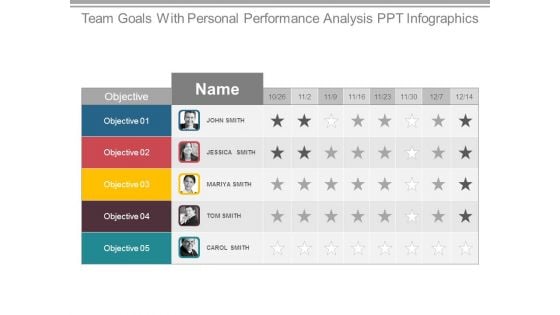
Team Goals With Personal Performance Analysis Ppt Infographics
This is a team goals with personal performance analysis ppt infographics. This is a five stage process. The stages in this process are john smith, jessica smith, mariya smith, tom smith, carol smith.
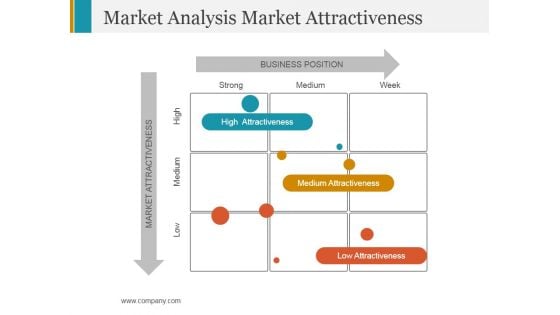
Market Analysis Market Attractiveness Ppt PowerPoint Presentation Professional Infographics
This is a market analysis market attractiveness ppt powerpoint presentation professional infographics. This is a nine stage process. The stages in this process are strong, medium, week, high attractiveness.

Risk Tolerance Analysis Template 2 Ppt Powerpoint Presentation Slides Infographics
This is a risk tolerance analysis template 2 ppt powerpoint presentation slides infographics. This is a five stage process. The stages in this process are low, high, arrow, management, business.
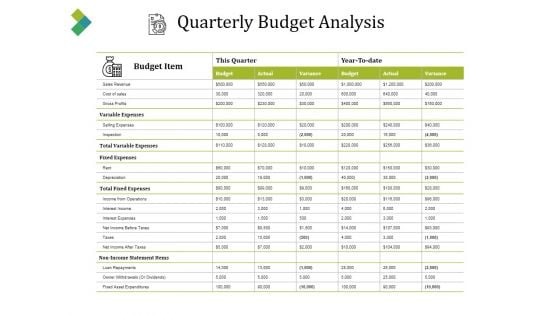
Quarterly Budget Analysis Ppt PowerPoint Presentation Ideas Infographics
This is a quarterly budget analysis ppt powerpoint presentation ideas infographics. This is a two stage process. The stages in this process are budget item, this quarter, budget, actual, variance.
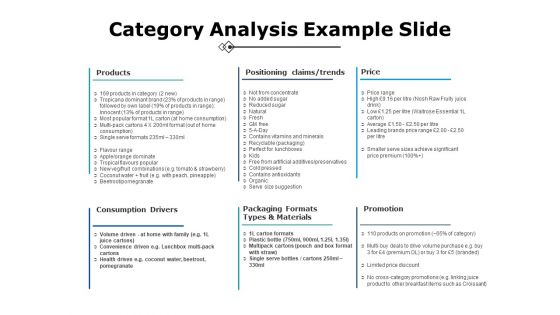
Category Analysis Example Slide Ppt PowerPoint Presentation File Infographics
This is a category analysis example slide ppt powerpoint presentation file infographics. This is a six stage process. The stages in this process are products, price, promotion, consumption drivers, positioning claims.
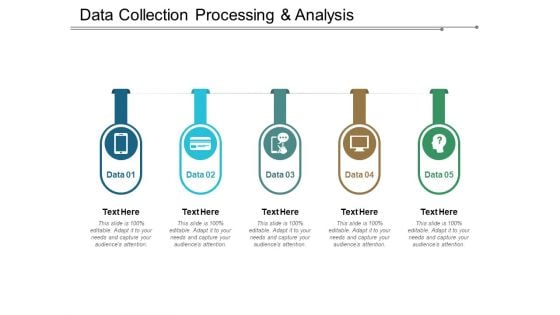
Data Collection Processing And Analysis Ppt PowerPoint Presentation Pictures Infographics
This is a data collection processing and analysis ppt powerpoint presentation pictures infographics. This is a five stage process. The stages in this process are data flow, data management, big data.

Project Conclusion Report Performance Analysis Ppt PowerPoint Presentation Outline Infographics
This is a project conclusion report performance analysis ppt powerpoint presentation outline infographics. This is a two stage process. The stages in this process are business, management, marketing, compare.
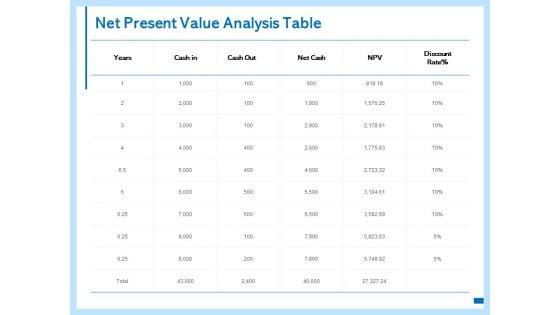
Net Present Value Analysis Table Ppt PowerPoint Presentation Layouts Infographics
Presenting this set of slides with name net present value analysis table ppt powerpoint presentation layouts infographics. The topics discussed in these slide is net present value analysis table. This is a completely editable PowerPoint presentation and is available for immediate download. Download now and impress your audience.
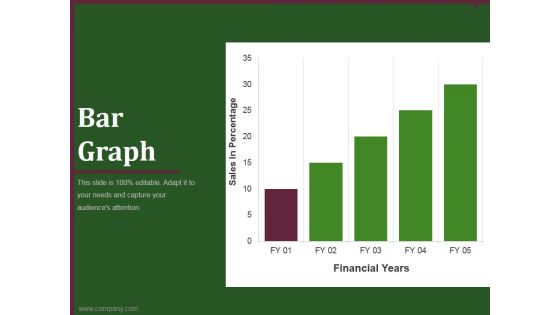
bar graph template 1 ppt powerpoint presentation infographics
This is a bar graph template 1 ppt powerpoint presentation infographics. This is a five stage process. The stages in this process are business, marketing, graph, analysis, growth.
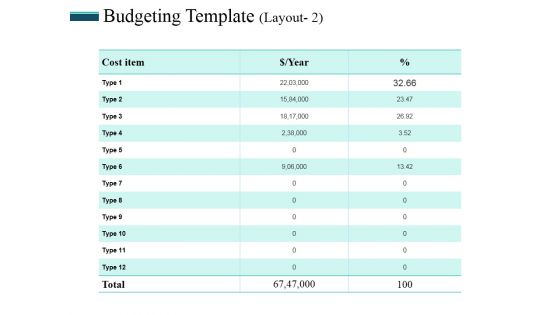
Budgeting Template 2 Ppt PowerPoint Presentation Portfolio Infographics
This is a budgeting template 2 ppt powerpoint presentation portfolio infographics. This is a three stage process. The stages in this process are table, cost, table, management, analysis.

Implement Countermeasures Standard Operating Sheet Ppt PowerPoint Presentation Infographics
This is a implement countermeasures standard operating sheet ppt powerpoint presentation infographics. This is a four stage process. The stages in this process are description, inventory, business, strategy.
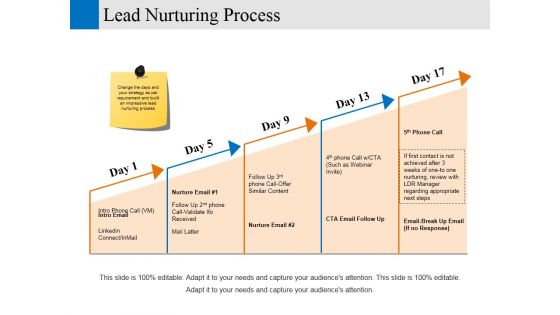
Lead Nurturing Process Ppt PowerPoint Presentation Pictures Infographics
This is a lead nurturing process ppt powerpoint presentation pictures infographics. This is a five stage process. The stages in this process are business, marketing, strategy, growth, analysis.
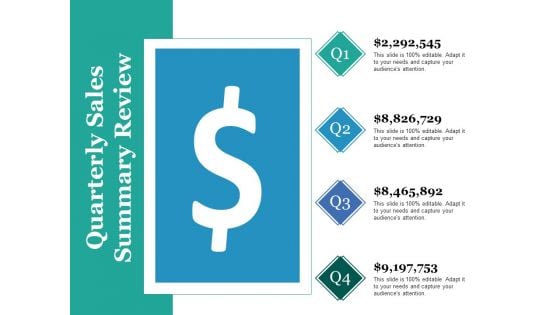
Quarterly Sales Summary Review Ppt PowerPoint Presentation Infographics
This is a quarterly sales summary review ppt powerpoint presentation infographics. This is a four stage process. The stages in this process are business, marketing, strategy, planning, analysis.
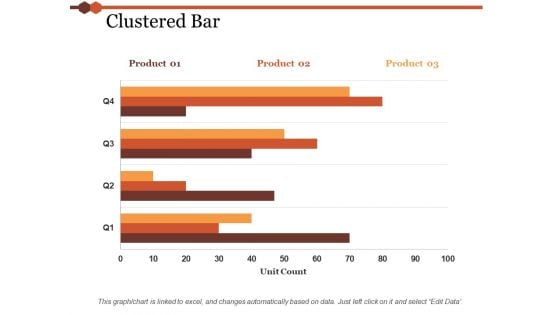
Clustered Bar Chart Ppt PowerPoint Presentation Layouts Infographics
This is a clustered bar chart ppt powerpoint presentation layouts infographics. This is a three stage process. The stages in this process are finance, marketing, management, investment, analysis.
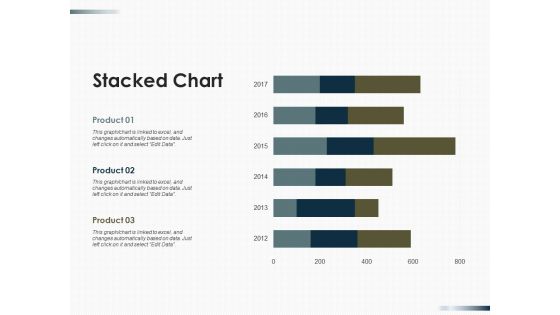
Stacked Chart Finance Ppt PowerPoint Presentation Outline Infographics
This is a stacked chart finance ppt powerpoint presentation outline infographics. This is a three stage process. The stages in this process are finance, marketing, management, investment, analysis.

Quotes Thought Communication Ppt PowerPoint Presentation Pictures Infographics
This is a quotes thought communication ppt powerpoint presentation pictures infographics. This is a two stage process. The stages in this process are thought, business, management, strategy, analysis.


 Continue with Email

 Home
Home


