Survey Infographic

Stacked Bar Investment Ppt PowerPoint Presentation Gallery Infographics
This is a stacked bar investment ppt powerpoint presentation gallery infographics. This is a three stage process. The stages in this process are finance, analysis, business, investment, marketing.
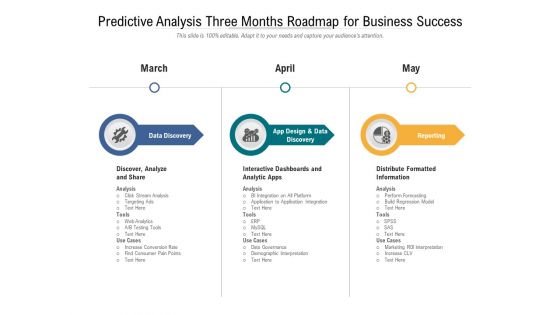
Predictive Analysis Three Months Roadmap For Business Success Infographics
Introducing our predictive analysis three months roadmap for business success infographics. This PPT presentation is Google Slides compatible, therefore, you can share it easily with the collaborators for measuring the progress. Also, the presentation is available in both standard screen and widescreen aspect ratios. So edit the template design by modifying the font size, font type, color, and shapes as per your requirements. As this PPT design is fully editable it can be presented in PDF, JPG and PNG formats.
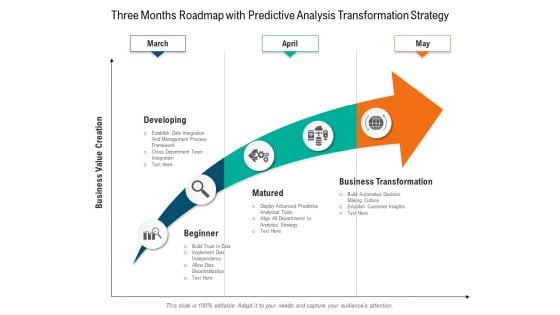
Three Months Roadmap With Predictive Analysis Transformation Strategy Infographics
Presenting our jaw-dropping three months roadmap with predictive analysis transformation strategy infographics. You can alternate the color, font size, font type, and shapes of this PPT layout according to your strategic process. This PPT presentation is compatible with Google Slides and is available in both standard screen and widescreen aspect ratios. You can also download this well-researched PowerPoint template design in different formats like PDF, JPG, and PNG. So utilize this visually-appealing design by clicking the download button given below.
Global Private Markets Review C2 Ppt PowerPoint Presentation Icon Infographics
This is a global private markets review c2 ppt powerpoint presentation icon infographics. This is a two stage process. The stages in this process are investment, funding, private equity, venture capital.
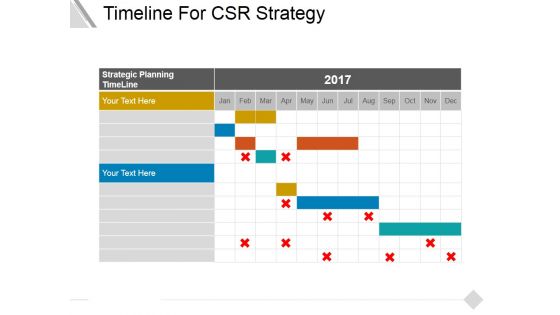
Timeline For Csr Strategy Ppt PowerPoint Presentation Visual Aids Infographics
This is a timeline for csr strategy ppt powerpoint presentation visual aids infographics. This is a two stage process. The stages in this process are Strategic, planning, timeline, strategy, business, management.
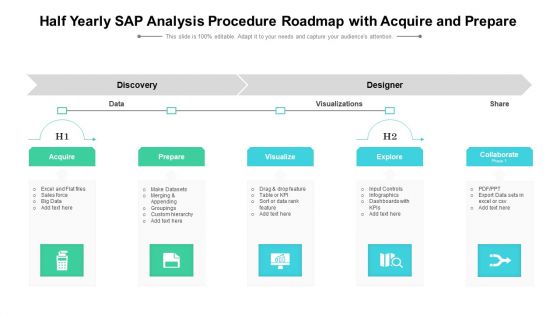
Half Yearly SAP Analysis Procedure Roadmap With Acquire Infographics
Presenting the half yearly sap analysis procedure roadmap with acquire infographics. The template includes a roadmap that can be used to initiate a strategic plan. Not only this, the PowerPoint slideshow is completely editable and you can effortlessly modify the font size, font type, and shapes according to your needs. This PPT slide can be easily reached in standard screen and widescreen aspect ratios. The set is also available in various formats like PDF, PNG, and JPG. So download and use it multiple times as per your knowledge.
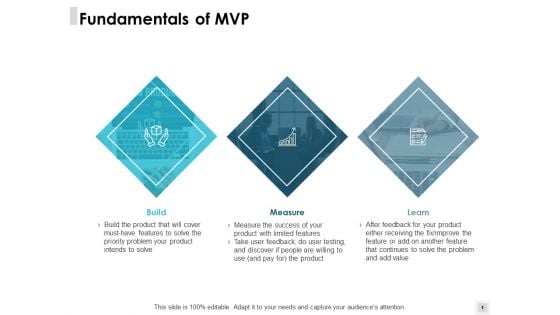
Fundamentals Of Mvp Measure Ppt PowerPoint Presentation Infographics
Presenting this set of slides with name fundamentals of mvp measure ppt powerpoint presentation infographics. This is a three stage process. The stages in this process are build, measure, learn, checklist, opportunity. This is a completely editable PowerPoint presentation and is available for immediate download. Download now and impress your audience.
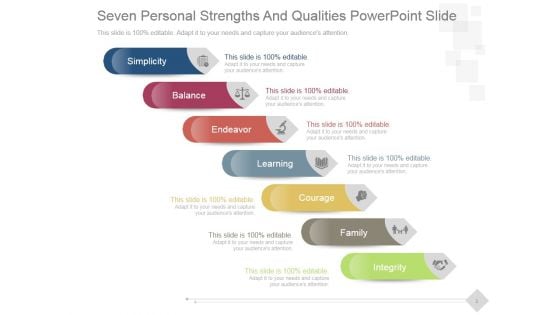
Seven Personal Strengths And Qualities Ppt PowerPoint Presentation Infographics
This is a seven personal strengths and qualities ppt powerpoint presentation infographics. This is a seven stage process. The stages in this process are simplicity, balance, endeavor, learning, courage.
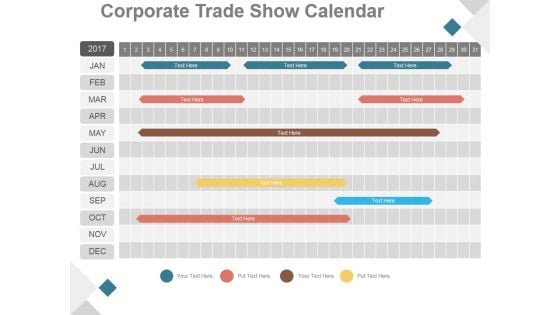
Corporate Trade Show Calendar Ppt PowerPoint Presentation Infographics
This is a corporate trade show calendar ppt powerpoint presentation infographics. This is a twelve stage process. The stages in this process are jan, feb, mar, apr, may, jun, jul, aug, sep, oct, nov, dec.
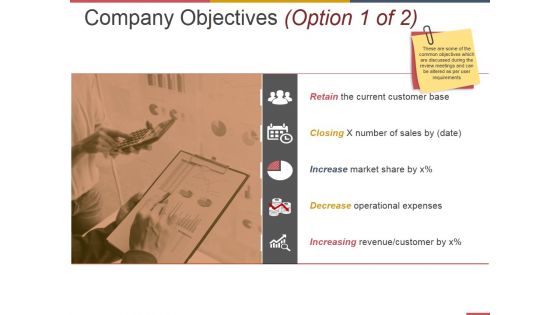
Company Objectives Template 1 Ppt PowerPoint Presentation Styles Infographics
This is a company objectives template 1 ppt powerpoint presentation styles infographics. This is a one stage process. The stages in this process are current customer base, number of sales by, market share, operational expenses.
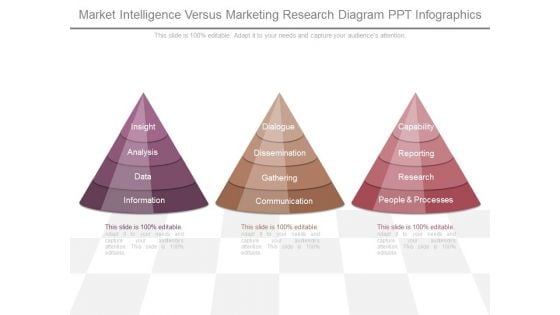
Market Intelligence Versus Marketing Research Diagram Ppt Infographics
This is a market intelligence versus marketing research diagram ppt infographics. This is a three stage process. The stages in this process are insight, analysis, data, information, dialogue, dissemination, gathering, communication, capability, reporting, research, people and processes.

Its Fine To Celebrate Success Ppt PowerPoint Presentation Infographics
This is a its fine to celebrate success ppt powerpoint presentation infographics. This is a one stage process. The stages in this process are hierarchy, management, analysis, strategy, business.
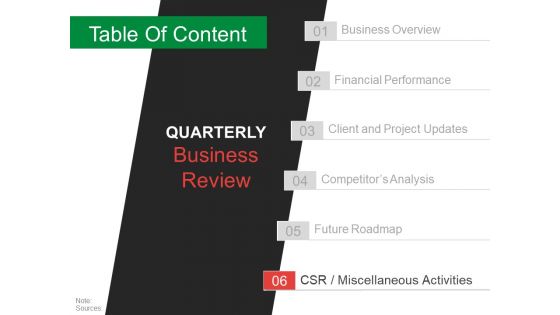
Table Of Content Template 7 Ppt PowerPoint Presentation Professional Infographics
This is a table of content template 7 ppt powerpoint presentation professional infographics. This is a six stage process. The stages in this process are business overview, financial performance, client and project updates, competitor s analysis, future roadmap.
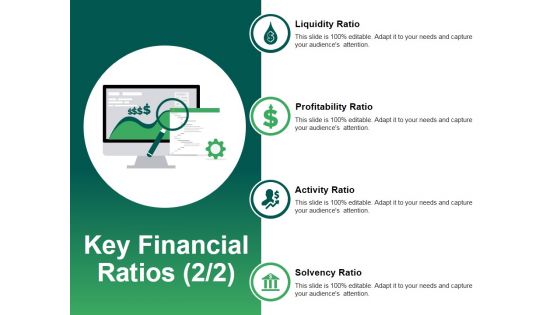
Key Financial Ratios Template 2 Ppt PowerPoint Presentation Professional Infographics
This is a key financial ratios template 2 ppt powerpoint presentation professional infographics. This is a four stage process. The stages in this process are analysis, finance, strategy, business, marketing.
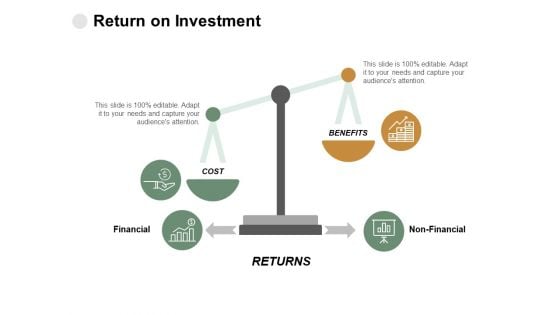
Return On Investment Ppt PowerPoint Presentation Visual Aids Infographics
This is a return on investment ppt powerpoint presentation visual aids infographics. This is a three stage process. The stages in this process are finance, analysis, business, investment, marketing.
Clustered Column Line Product Finance Ppt PowerPoint Presentation Icon Infographics
This is a clustered column line product finance ppt powerpoint presentation icon infographics. This is a three stage process. The stages in this process are finance, management, strategy, analysis, marketing.
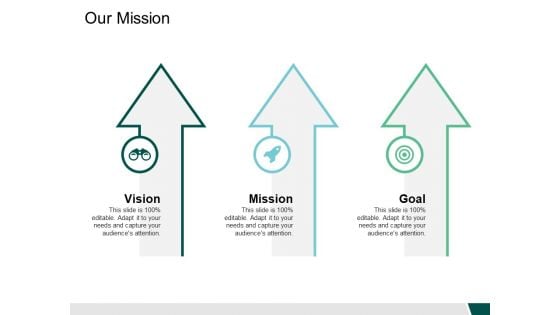
Our Mission Goal Vision Ppt PowerPoint Presentation Show Infographics
This is a our mission goal vision ppt powerpoint presentation show infographics. This is a three stage process. The stages in this process are icons, management, strategy, analysis, marketing.
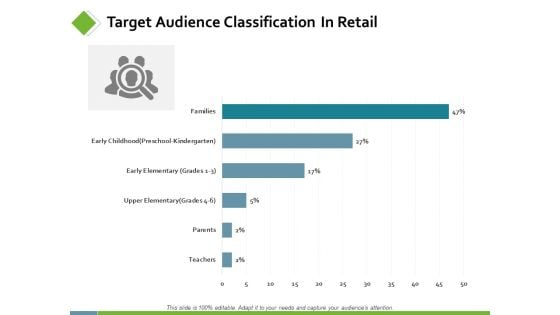
Target Audience Classification In Retail Ppt PowerPoint Presentation Summary Infographics
This is a target audience classification in retail ppt powerpoint presentation summary infographics. This is a two stage process. The stages in this process are finance, analysis, business, investment, marketing.
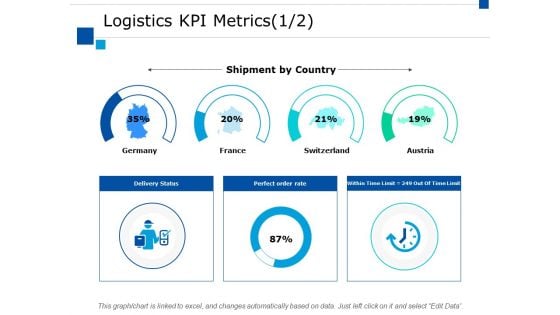
Logistics Kpi Metrics Business Ppt PowerPoint Presentation Ideas Infographics
This is a logistics kpi metrics business ppt powerpoint presentation ideas infographics. This is a four stage process. The stages in this process are finance, marketing, management, investment, analysis.
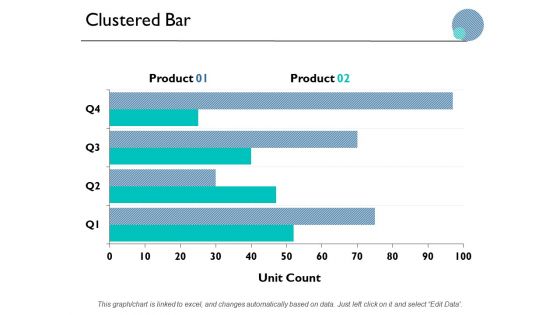
Clustered Bar Finance Marketing Ppt PowerPoint Presentation Inspiration Infographics
This is a clustered bar finance marketing ppt powerpoint presentation inspiration infographics. This is a two stage process. The stages in this process are finance, marketing, management, investment, analysis.
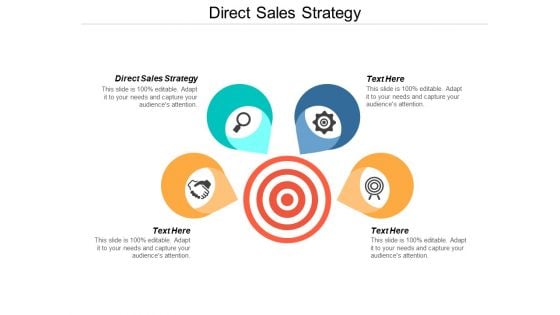
Direct Sales Strategy Ppt PowerPoint Presentation Visual Aids Infographics
This is a business entity form ppt powerpoint presentation model clipart images. This is a six stage process. The stages in this process are business entity form.
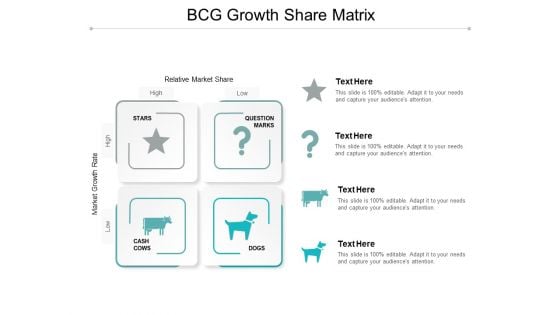
BCG Growth Share Matrix Ppt Powerpoint Presentation Layouts Infographics
Presenting this set of slides with name bcg growth share matrix ppt powerpoint presentation layouts infographics. This is a four stage process. The stages in this process are market entry analysis, market attractiveness, strategic analysis. This is a completely editable PowerPoint presentation and is available for immediate download. Download now and impress your audience.
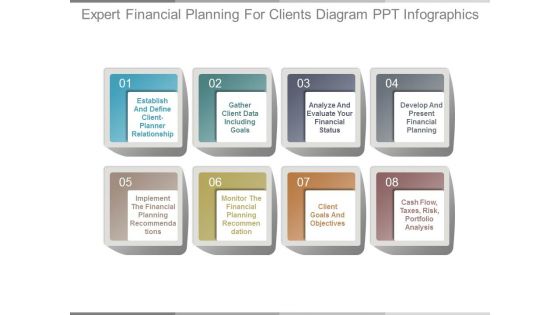
Expert Financial Planning For Clients Diagram Ppt Infographics
This is a expert financial planning for clients diagram ppt infographics. This is a ten stage process. The stages in this process are establish and define client planner relationship, gather client data including goals, analyze and evaluate your financial status, develop and present financial planning, implement the financial planning recommendations, monitor the financial planning recommendation, client goals and objectives, cash flow, taxes, risk, portfolio analysis.
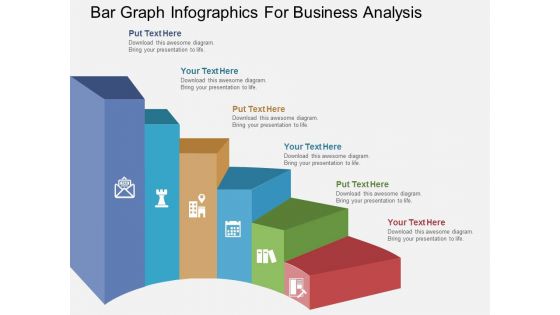
Bar Graph Infographics For Business Analysis Powerpoint Template
This PowerPoint template contains bar graph with icons. This PPT slide helps to exhibit concepts like strategy, direction and success. Use this business slide to make impressive presentations.
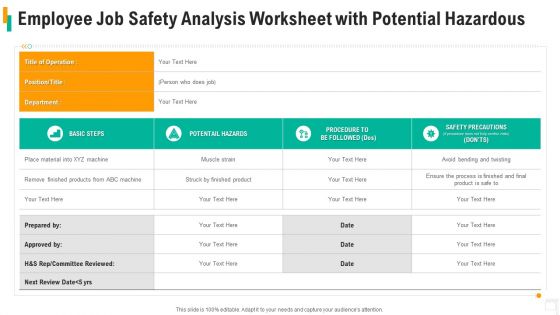
Employee Job Task Analysis Evaluation Sheet Infographics PDF
Pitch your topic with ease and precision using this employee job safety analysis worksheet with potential hazardous clipart pdf. This layout presents information on employee job task analysis evaluation sheet. It is also available for immediate download and adjustment. So, changes can be made in the color, design, graphics or any other component to create a unique layout.
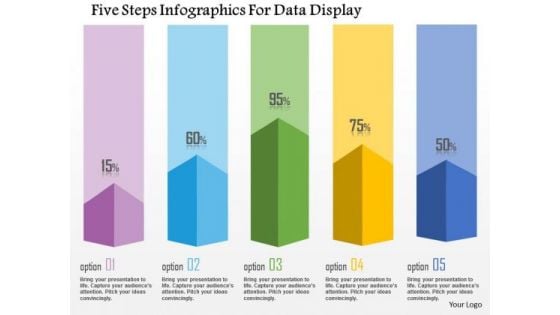
Business Diagram Five Steps Infographics For Data Display Presentation Template
This business diagram has been designed with graphic of five staged info graphics. This diagram can be used to display statistical information. Use this bar graph for your business and sales related presentations.
Modifying Banking Functionalities Dashboard Tracking Customer Satisfaction Score Infographics PDF
This slide contains dashboard that depicts the overall customer satisfaction into quantitative form. Deliver an awe inspiring pitch with this creative enhancing financial institution operations dashboard tracking customer satisfaction score icons pdf bundle. Topics like dashboard tracking customer satisfaction score can be discussed with this completely editable template. It is available for immediate download depending on the needs and requirements of the user.
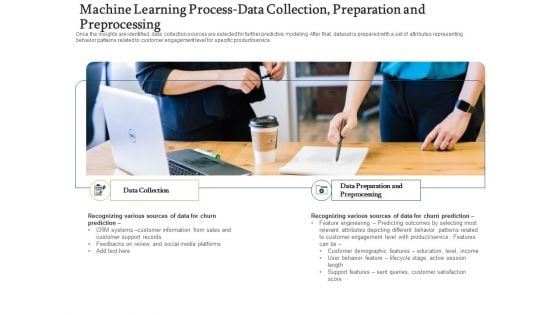
Machine Learning Process Data Collection Preparation And Preprocessing Infographics PDF
Presenting forecasting managing consumer attrition business advantage acquisition strategy churned customer sample pdf to provide visual cues and insights. Share and navigate important information on two stages that need your due attention. This template can be used to pitch topics like recognizing various sources of data for churn prediction, recognizing various sources of data for churn prediction, data preparation and preprocessing. In addtion, this PPT design contains high resolution images, graphics, etc, that are easily editable and available for immediate download.
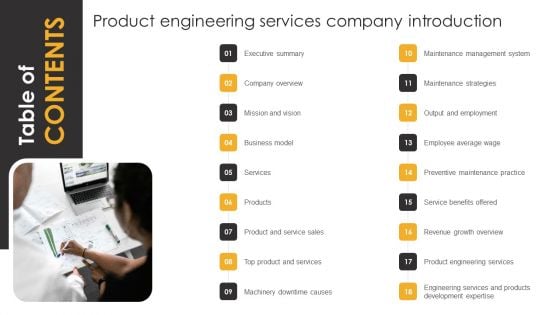
Table Of Contents Product Engineering Services Company Introduction Infographics PDF
Slidegeeks is here to make your presentations a breeze with With our easy-to-use and customizable templates, you can focus on delivering your ideas rather than worrying about formatting. With a variety of designs to choose from, youre sure to find one that suits your needs. And with animations and unique photos, illustrations, and fonts, you can make your presentation pop. So whether youre giving a sales pitch or presenting to the board, make sure to check out Slidegeeks first.
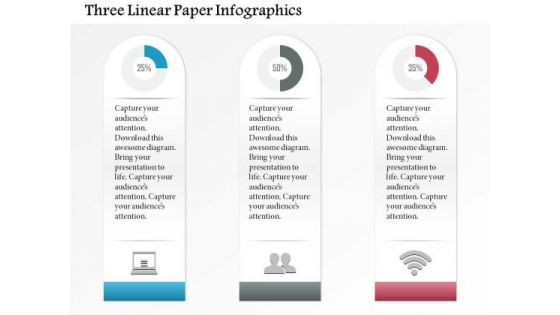
Business Diagram Three Linear Paper Infographics Presentation Template
Three linear paper info graphics has been used to design this power point template slide. This PPT slide contains the concept of data analysis and business data flow. Use this PPT slide for your business and marketing related presentations.
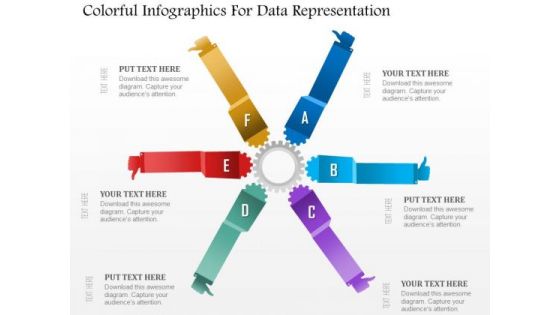
Business Diagram Colorful Infographics For Data Representation Presentation Template
This power point template diagram has been crafted with graphic of colorful info graphics. This PPT diagram contains the concept of analysis and data representations. Use this PPT for marketing and business related presentations.
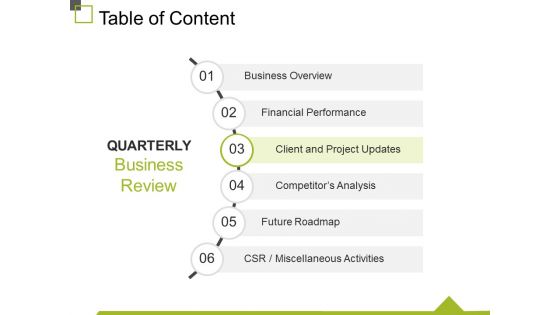
Table Of Content Template 4 Ppt PowerPoint Presentation Infographics Maker
This is a table of content template 1 ppt powerpoint presentation outline template. This is a six stage process. The stages in this process are business overview, financial performance, client and project updates, competitor s analysis, future roadmap.

Contractor Project Course Of Action Contd Ppt PowerPoint Presentation Infographics Slide Portrait
Presenting this set of slides with name contractor project course of action contd ppt powerpoint presentation infographics slide portrait. This is a one stage process. The stages in this process are contracting agreement, cost, survey cost, workers, insurance compensation. This is a completely editable PowerPoint presentation and is available for immediate download. Download now and impress your audience.
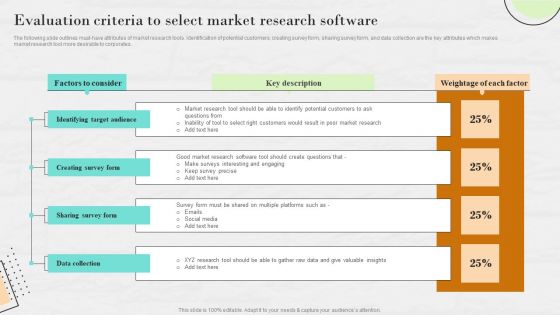
Market Research To Determine Business Opportunities Evaluation Criteria To Select Market Research Software Infographics PDF
The following slide outlines must-have attributes of market research tools. Identification of potential customers, creating survey form, sharing survey form, and data collection are the key attributes which makes market research tool more desirable to corporates. If you are looking for a format to display your unique thoughts, then the professionally designed Market Research To Determine Business Opportunities Evaluation Criteria To Select Market Research Software Infographics PDF is the one for you. You can use it as a Google Slides template or a PowerPoint template. Incorporate impressive visuals, symbols, images, and other charts. Modify or reorganize the text boxes as you desire. Experiment with shade schemes and font pairings. Alter, share or cooperate with other people on your work. Download Market Research To Determine Business Opportunities Evaluation Criteria To Select Market Research Software Infographics PDF and find out how to give a successful presentation. Present a perfect display to your team and make your presentation unforgettable.
Actual Time Marketing Challenges In Using Social Data Ppt PowerPoint Presentation Icon Infographics PDF
The slide inculcates a survey highlighting various barriers in real-time marketing for using social data to increase customer engagement. Various challenges included are inadequate budget, inappropriate skills, limited search analytical tools, etc. Pitch your topic with ease and precision using this Actual Time Marketing Challenges In Using Social Data Ppt PowerPoint Presentation Icon Infographics PDF. This layout presents information on Inadequate Budget, Inappropriate Skills, Limited Staff Abilities, Quick Responses. It is also available for immediate download and adjustment. So, changes can be made in the color, design, graphics or any other component to create a unique layout.
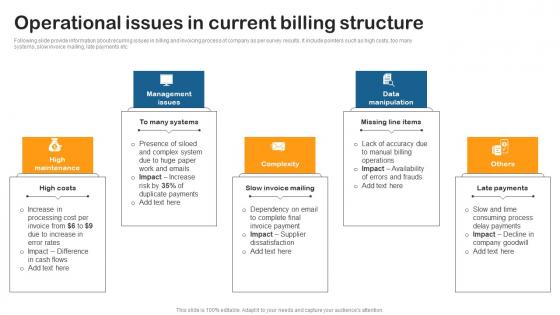
Operational Issues Current Building Utility Billing And Invoicing Management System Infographics Pdf
Following slide provide information about recurring issues in billing and invoicing process of company as per survey results. It include pointers such as high costs, too many systems, slow invoice mailing, late payments etc. Explore a selection of the finest Operational Issues Current Building Utility Billing And Invoicing Management System Infographics Pdf here. With a plethora of professionally designed and pre made slide templates, you can quickly and easily find the right one for your upcoming presentation. You can use our Operational Issues Current Building Utility Billing And Invoicing Management System Infographics Pdf to effectively convey your message to a wider audience. Slidegeeks has done a lot of research before preparing these presentation templates. The content can be personalized and the slides are highly editable. Grab templates today from Slidegeeks. Following slide provide information about recurring issues in billing and invoicing process of company as per survey results. It include pointers such as high costs, too many systems, slow invoice mailing, late payments etc.
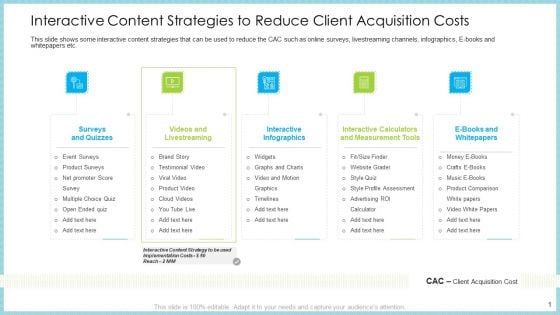
Customer Acquiring Price For Retaining New Clients Interactive Content Strategies To Reduce Client Acquisition Costs Rules PDF
This slide shows some interactive content strategies that can be used to reduce the CAC such as online surveys, livestreaming channels, infographics, E-books and whitepapers etc. This is a customer acquiring price for retaining new clients interactive content strategies to reduce client acquisition costs rules pdf template with various stages. Focus and dispense information on five stages using this creative set, that comes with editable features. It contains large content boxes to add your information on topics like surveys and quizzes, videos and livestreaming, interactive infographics, interactive calculators and measurement tools, e books and whitepapers. You can also showcase facts, figures, and other relevant content using this PPT layout. Grab it now.
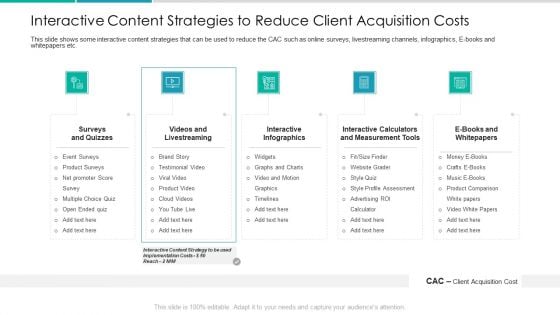
Client Acquisition Cost For Customer Retention Interactive Content Strategies To Reduce Client Acquisition Costs Clipart PDF
This slide shows some interactive content strategies that can be used to reduce the CAC such as online surveys, livestreaming channels, infographics, E-books and whitepapers etc. This is a client acquisition cost for customer retention interactive content strategies to reduce client acquisition costs clipart pdf template with various stages. Focus and dispense information on five stages using this creative set, that comes with editable features. It contains large content boxes to add your information on topics like surveys and quizzes, videos and livestreaming, interactive infographics, interactive calculators and measurement tools, e books and whitepapers. You can also showcase facts, figures, and other relevant content using this PPT layout. Grab it now.
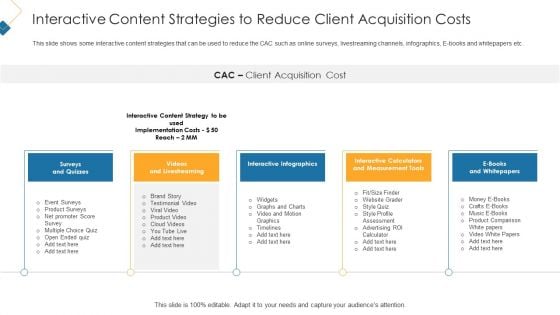
Interactive Content Strategies To Reduce Client Acquisition Costs Professional PDF
This slide shows some interactive content strategies that can be used to reduce the CAC such as online surveys, livestreaming channels, infographics, E books and whitepapers etc. Presenting interactive content strategies to reduce client acquisition costs professional pdf to provide visual cues and insights. Share and navigate important information on four stages that need your due attention. This template can be used to pitch topics like surveys and quizzes, videos and livestreaming, interactive infographics, interactive calculators and measurement tools. In addtion, this PPT design contains high resolution images, graphics, etc, that are easily editable and available for immediate download.
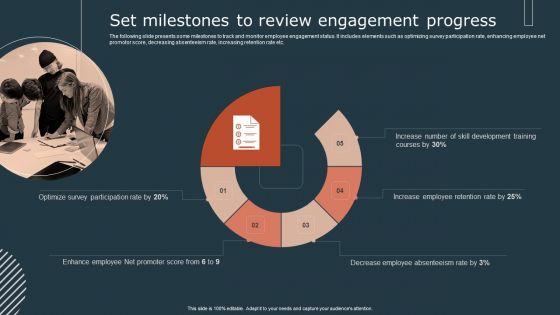
Effective Workforce Participation Action Planning Set Milestones To Review Engagement Progress Infographics PDF
The following slide presents some milestones to track and monitor employee engagement status. It includes elements such as optimizing survey participation rate, enhancing employee net promotor score, decreasing absenteeism rate, increasing retention rate etc. Slidegeeks is here to make your presentations a breeze with Effective Workforce Participation Action Planning Set Milestones To Review Engagement Progress Infographics PDF With our easy to use and customizable templates, you can focus on delivering your ideas rather than worrying about formatting. With a variety of designs to choose from, you are sure to find one that suits your needs. And with animations and unique photos, illustrations, and fonts, you can make your presentation pop. So whether you are giving a sales pitch or presenting to the board, make sure to check out Slidegeeks first.
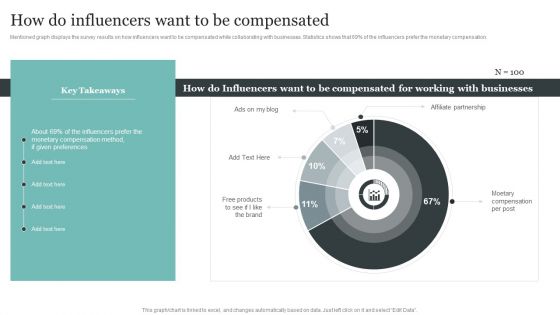
Comprehensive Personal Branding Guidelines How Do Influencers Want To Be Compensated Infographics PDF
Mentioned graph displays the survey results on how influencers want to be compensated while collaborating with businesses. Statistics shows that 69 precent of the influencers prefer the monetary compensation.Present like a pro with Comprehensive Personal Branding Guidelines How Do Influencers Want To Be Compensated Infographics PDF Create beautiful presentations together with your team, using our easy-to-use presentation slides. Share your ideas in real-time and make changes on the fly by downloading our templates. So whether you are in the office, on the go, or in a remote location, you can stay in sync with your team and present your ideas with confidence. With Slidegeeks presentation got a whole lot easier. Grab these presentations today.
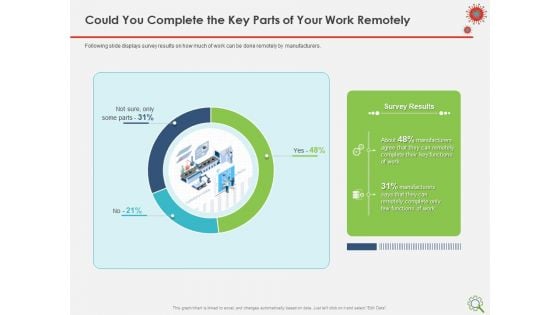
COVID Implications On Manufacturing Business Could You Complete The Key Parts Of Your Work Remotely Infographics PDF
Presenting this set of slides with name covid implications on manufacturing business could you complete the key parts of your work remotely infographics pdf. This is a three stage process. The stages in this process are survey results, manufacturers, few functions work, key functions work. This is a completely editable PowerPoint presentation and is available for immediate download. Download now and impress your audience.
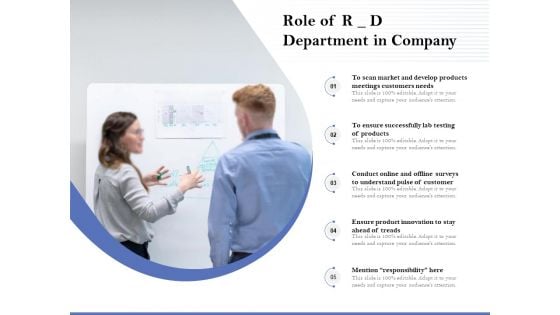
Role Of R D Department In Company Ppt PowerPoint Presentation Infographics Inspiration PDF
Persuade your audience using this role of r d department in company ppt powerpoint presentation infographics inspiration pdf. This PPT design covers five stages, thus making it a great tool to use. It also caters to a variety of topics including to scan market and develop products meetings customers needs, to ensure successfully lab testing of products, conduct online and offline surveys to understand pulse of customer, ensure product innovation to stay ahead of treads, mention responsibility here. Download this PPT design now to present a convincing pitch that not only emphasizes the topic but also showcases your presentation skills.
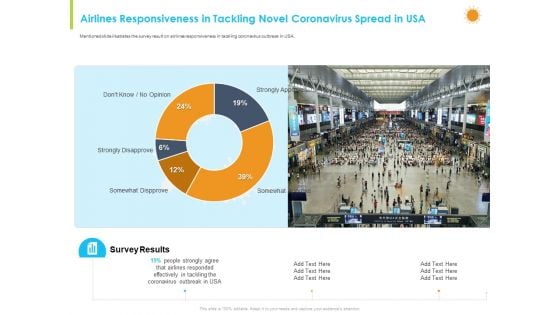
How Aviation Industry Coping With COVID 19 Pandemic Airlines Responsiveness In Tackling Novel Coronavirus Spread In USA Infographics PDF
Mentioned slide illustrates the survey result on airlines responsiveness in tackling coronavirus outbreak in USA.Deliver an awe inspiring pitch with this creative how aviation industry coping with COVID 19 pandemic airlines responsiveness in tackling novel coronavirus spread in usa infographics pdf. bundle. Topics like strongly disapprove, somewhat disapprove, strongly approve can be discussed with this completely editable template. It is available for immediate download depending on the needs and requirements of the user.
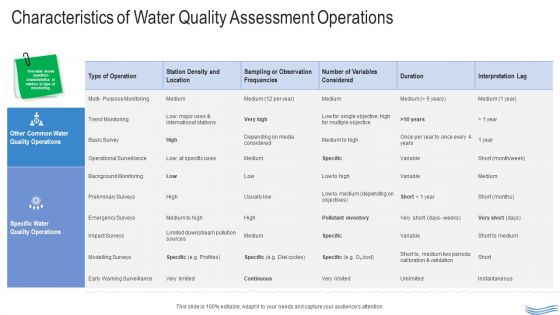
Water Quality Management Characteristics Of Water Quality Assessment Operations Infographics PDF
Deliver and pitch your topic in the best possible manner with this water quality management characteristics of water quality assessment operations infographics pdf. Use them to share invaluable insights on monitoring, surveys, objective, location and impress your audience. This template can be altered and modified as per your expectations. So, grab it now.
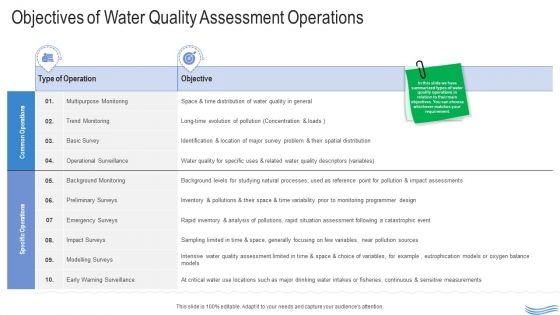
Water Quality Management Objectives Of Water Quality Assessment Operations Infographics PDF
Deliver and pitch your topic in the best possible manner with this water quality management objectives of water quality assessment operations infographics pdf. Use them to share invaluable insights on monitoring, surveys, inventory, continuous, operations and impress your audience. This template can be altered and modified as per your expectations. So, grab it now.
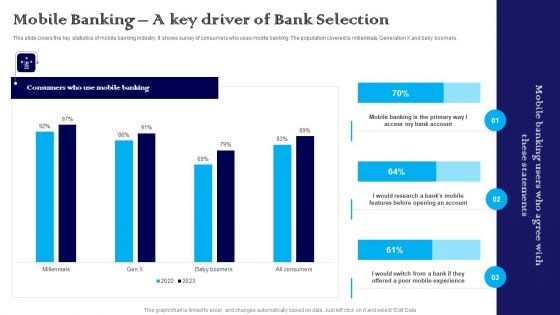
Exploring The Banking Industry A Comprehensive Analysis Mobile Banking A Key Driver Of Bank Selection Infographics PDF
This slide covers the key statistics of mobile banking industry. It shows survey of consumers who uses mobile banking. The population covered is millennials, Generation X and baby boomers. Slidegeeks is one of the best resources for PowerPoint templates. You can download easily and regulate Exploring The Banking Industry A Comprehensive Analysis Mobile Banking A Key Driver Of Bank Selection Infographics PDF for your personal presentations from our wonderful collection. A few clicks is all it takes to discover and get the most relevant and appropriate templates. Use our Templates to add a unique zing and appeal to your presentation and meetings. All the slides are easy to edit and you can use them even for advertisement purposes.
Real Time Statistical Analysis Of Big Data Ppt Infographics Design Ideas Pdf
Pitch your topic with ease and precision using this Real Time Statistical Analysis Of Big Data Ppt Infographics Design Ideas Pdf. This layout presents information on Real Time, Statistical Analysis, Big Data. It is also available for immediate download and adjustment. So, changes can be made in the color, design, graphics or any other component to create a unique layout. Our Real Time Statistical Analysis Of Big Data Ppt Infographics Design Ideas Pdf are topically designed to provide an attractive backdrop to any subject. Use them to look like a presentation pro.
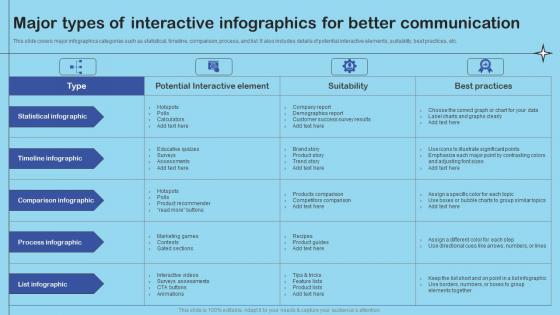
Major Types Of Interactive Infographics Enhance Client Engagement With Interactive Information Pdf
This slide covers major infographics categories such as statistical, timeline, comparison, process, and list. It also includes details of potential interactive elements, suitability, best practices, etc. Presenting this PowerPoint presentation, titled Major Types Of Interactive Infographics Enhance Client Engagement With Interactive Information Pdf, with topics curated by our researchers after extensive research. This editable presentation is available for immediate download and provides attractive features when used. Download now and captivate your audience. Presenting this Major Types Of Interactive Infographics Enhance Client Engagement With Interactive Information Pdf. Our researchers have carefully researched and created these slides with all aspects taken into consideration. This is a completely customizable Major Types Of Interactive Infographics Enhance Client Engagement With Interactive Information Pdf that is available for immediate downloading. Download now and make an impact on your audience. Highlight the attractive features available with our PPTs. This slide covers major infographics categories such as statistical, timeline, comparison, process, and list. It also includes details of potential interactive elements, suitability, best practices, etc.
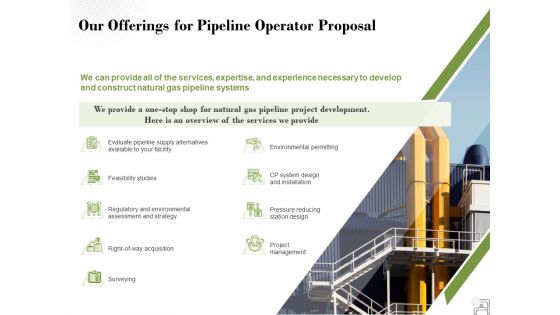
Our Offerings For Pipeline Operator Proposal Ppt PowerPoint Presentation Infographics Graphics Design
Presenting this set of slides with name our offerings for pipeline operator proposal ppt powerpoint presentation infographics graphics design. The topics discussed in these slides are feasibility studies, regulatory and environmental assessment and strategy, right of way acquisition, surveying, project management, pressure reducing station design, cp system design and installation, environmental permitting. This is a completely editable PowerPoint presentation and is available for immediate download. Download now and impress your audience.
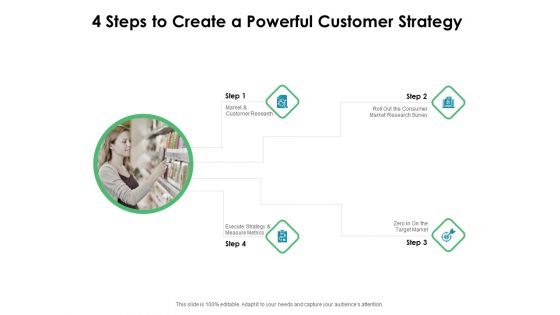
Value Creation Initiatives 4 Steps To Create A Powerful Customer Strategy Infographics PDF
This is a value creation initiatives 4 steps to create a powerful customer strategy infographics pdf template with various stages. Focus and dispense information on three stages using this creative set, that comes with editable features. It contains large content boxes to add your information on topics like market and customer research, execute strategy and measure metrics, roll out the consumer market research survey. You can also showcase facts, figures, and other relevant content using this PPT layout. Grab it now.
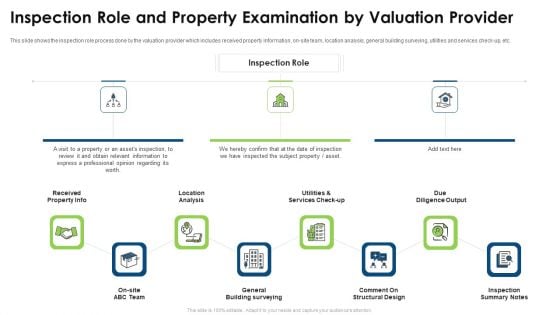
Commercial Property Evaluation Techniques Inspection Role And Property Examination By Valuation Provider Infographics PDF
This slide shows the inspection role process done by the valuation provider which includes received property information, on site team, location analysis, general building surveying, utilities and services check up, etc. Presenting commercial property evaluation techniques inspection role and property examination by valuation provider infographics pdf to provide visual cues and insights. Share and navigate important information on three stages that need your due attention. This template can be used to pitch topics like location, analysis due, diligence output received, team, structural design. In addtion, this PPT design contains high resolution images, graphics, etc, that are easily editable and available for immediate download.
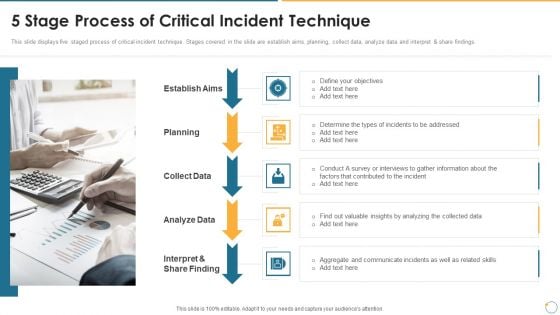
Collection Of Quality Assurance PPT 5 Stage Process Of Critical Incident Technique Infographics PDF
This slide displays five staged process of critical incident technique. Stages covered in the slide are establish aims, planning, collect data, analyze data and interpret and share findings. Presenting collection of quality assurance ppt 5 stage process of critical incident technique infographics pdf to provide visual cues and insights. Share and navigate important information on five stages that need your due attention. This template can be used to pitch topics like planning, collect data, analyze data, determine, survey. In addtion, this PPT design contains high resolution images, graphics, etc, that are easily editable and available for immediate download.
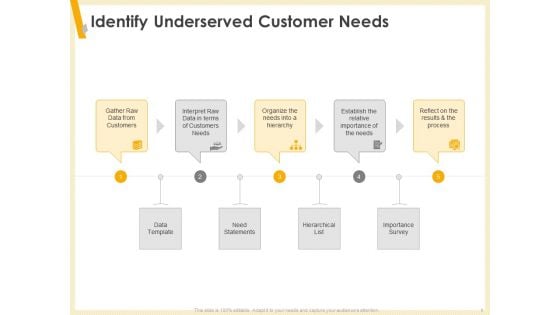
Gaining Product Market Solution Fit Identify Underserved Customer Needs Ppt PowerPoint Presentation Infographics Mockup PDF
This is a gaining product market solution fit identify underserved customer needs ppt powerpoint presentation infographics mockup pdf template with various stages. Focus and dispense information on five stages using this creative set, that comes with editable features. It contains large content boxes to add your information on topics like gather raw data from customers, interpret raw data, customers needs, organize needs, process, data template, need statements, hierarchical list, importance survey. You can also showcase facts, figures, and other relevant content using this PPT layout. Grab it now.

Methods And Framework To Measure Brand Health Brand And Equity Evaluation Techniques Infographics PDF
This slide highlights various methods and methods for measuring brand health. Methods covered in the slide are social listening, focus groups and surveys, customer feedback.Find a pre-designed and impeccable Methods And Framework To Measure Brand Health Brand And Equity Evaluation Techniques Infographics PDF. The templates can ace your presentation without additional effort. You can download these easy-to-edit presentation templates to make your presentation stand out from others. So, what are you waiting for Download the template from Slidegeeks today and give a unique touch to your presentation.
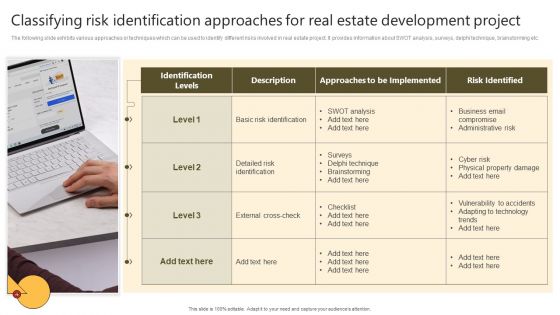
Successful Risk Administration Classifying Risk Identification Approaches For Real Estate Infographics PDF
The following slide exhibits various approaches or techniques which can be used to identify different risks involved in real estate project. It provides information about SWOT analysis, surveys, delphi technique, brainstorming etc. Want to ace your presentation in front of a live audience Our Successful Risk Administration Classifying Risk Identification Approaches For Real Estate Infographics PDF can help you do that by engaging all the users towards you.. Slidegeeks experts have put their efforts and expertise into creating these impeccable powerpoint presentations so that you can communicate your ideas clearly. Moreover, all the templates are customizable, and easy-to-edit and downloadable. Use these for both personal and commercial use.
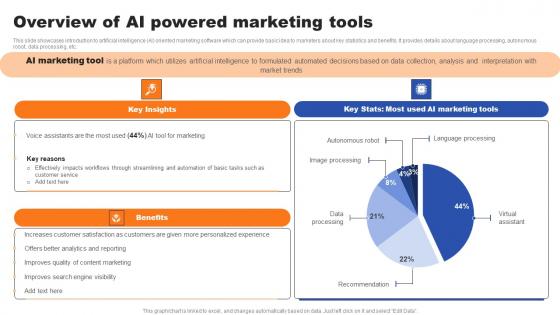
Overview Of AI Powered Marketing Tools Ppt Infographics Designs Download Pdf
This slide showcases introduction to artificial intelligence AI oriented marketing software which can provide basic idea to marketers about key statistics and benefits. It provides details about language processing, autonomous robot, data processing, etc. The Overview Of AI Powered Marketing Tools Ppt Infographics Designs Download Pdf is a compilation of the most recent design trends as a series of slides. It is suitable for any subject or industry presentation, containing attractive visuals and photo spots for businesses to clearly express their messages. This template contains a variety of slides for the user to input data, such as structures to contrast two elements, bullet points, and slides for written information. Slidegeeks is prepared to create an impression. This slide showcases introduction to artificial intelligence AI oriented marketing software which can provide basic idea to marketers about key statistics and benefits. It provides details about language processing, autonomous robot, data processing, etc.
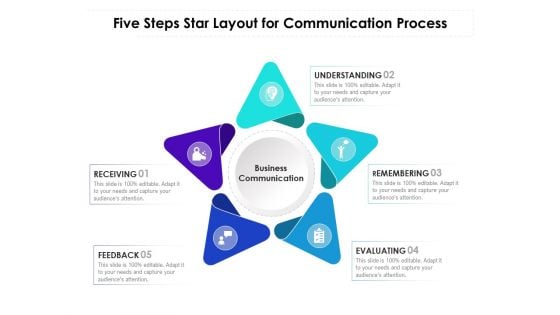
Five Steps Star Layout For Communication Process Ppt PowerPoint Presentation Infographics Skills PDF
Presenting this set of slides with name five steps star infographic for risk analysis ppt powerpoint presentation inspiration background images pdf. This is a five stage process. The stages in this process are understanding, remembering, evaluating, feedback, receiving. This is a completely editable PowerPoint presentation and is available for immediate download. Download now and impress your audience.
Icons Slide For Man In The Middle Phishing IT Ppt Infographics
Retrieve professionally designed Icons Slide For Man In The Middle Phishing IT Ppt Infographics to effectively convey your message and captivate your listeners. Save time by selecting pre-made slideshows that are appropriate for various topics, from business to educational purposes. These themes come in many different styles, from creative to corporate, and all of them are easily adjustable and can be edited quickly. Access them as PowerPoint templates or as Google Slides themes. You do not have to go on a hunt for the perfect presentation because Slidegeeks got you covered from everywhere. Our Icons Slide For Man In The Middle Phishing IT Ppt Infographics are topically designed to provide an attractive backdrop to any subject. Use them to look like a presentation pro.
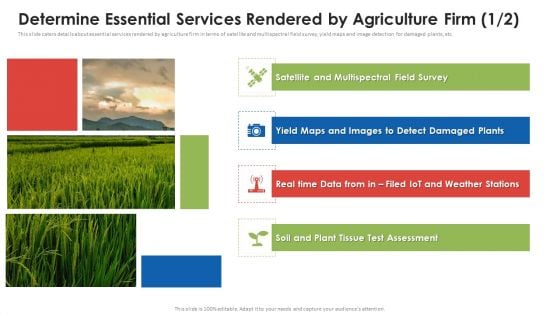
Agribusiness Startup Determine Essential Services Rendered By Agriculture Firm Infographics PDF
This slide caters details about essential services rendered by agriculture firm in terms of satellite and multispectral field survey, yield maps and image detection for damaged plants, etc. Crafting an eye-catching presentation has never been more straightforward. Let your presentation shine with this tasteful yet straightforward Agribusiness Startup Determine Essential Services Rendered By Agriculture Firm Infographics PDF template. It offers a minimalistic and classy look that is great for making a statement. The colors have been employed intelligently to add a bit of playfulness while still remaining professional. Construct the ideal Agribusiness Startup Determine Essential Services Rendered By Agriculture Firm Infographics PDF that effortlessly grabs the attention of your audience Begin now and be certain to wow your customers.


 Continue with Email

 Home
Home


