Survey
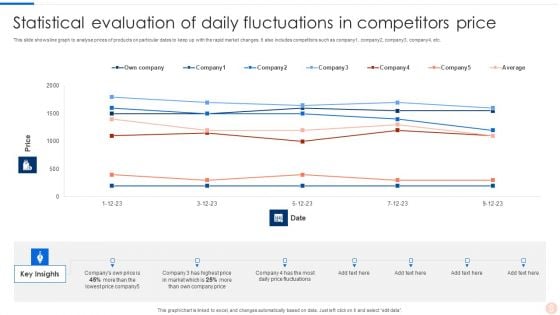
Statistical Evaluation Of Daily Fluctuations In Competitors Price Brochure PDF
Showcasing this set of slides titled Statistical Evaluation Of Daily Fluctuations In Competitors Price Brochure PDF. The topics addressed in these templates are Daily Fluctuations, Competitors Price. All the content presented in this PPT design is completely editable. Download it and make adjustments in color, background, font etc. as per your unique business setting.
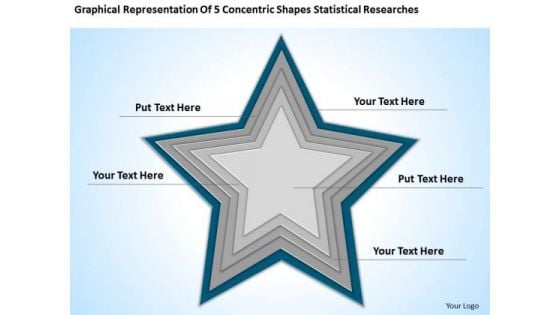
5 Concentric Shapes Statistical Researches Ppt Creating Small Business Plan PowerPoint Slides
We present our 5 concentric shapes statistical researches ppt creating small business plan PowerPoint Slides.Present our Stars PowerPoint Templates because you can Break through with our PowerPoint Templates and Slides. Bring down the mental barriers of your audience. Download our Shapes PowerPoint Templates because Our PowerPoint Templates and Slides will help you be quick off the draw. Just enter your specific text and see your points hit home. Download and present our Layers PowerPoint Templates because Our PowerPoint Templates and Slides are focused like a searchlight beam. They highlight your ideas for your target audience. Download our Business PowerPoint Templates because you should Experience excellence with our PowerPoint Templates and Slides. They will take your breath away. Present our Signs PowerPoint Templates because Our PowerPoint Templates and Slides offer you the needful to organise your thoughts. Use them to list out your views in a logical sequence.Use these PowerPoint slides for presentations relating to star, silver, color, colorful, design, decoration, layout, ornament, blank, new, seasonal, vector, holiday, celebrate, template, night, layered, festive, celebration, xmas, light, christmas, blurred, abstract, illustration, tradition, x-mas, winter, blurry, blue, text, december, moving, blur, celebrating, background, spot, events, eve, coming, blinded, editable, metal, year. The prominent colors used in the PowerPoint template are Blue, Gray, Black. Continue on your path to success with our 5 Concentric Shapes Statistical Researches Ppt Creating Small Business Plan PowerPoint Slides. You will come out on top.

Key Statistics And Figures Of The Company Financials Ppt Gallery Graphics Tutorials PDF
This slide depicts the major key statistics of the company such as Net Revenue, EBIT, Total Numbers of Plants, Advertising Expenses, Total Employees etc. Presenting key statistics and figures of the company financials ppt gallery graphics tutorials pdf to provide visual cues and insights. Share and navigate important information on twleve stages that need your due attention. This template can be used to pitch topics like key statistics and figures of the company financials. In addtion, this PPT design contains high resolution images, graphics, etc, that are easily editable and available for immediate download.

Roadmap For Cobots Building And Installation Detailed Analysis Of Cobots Formats PDF
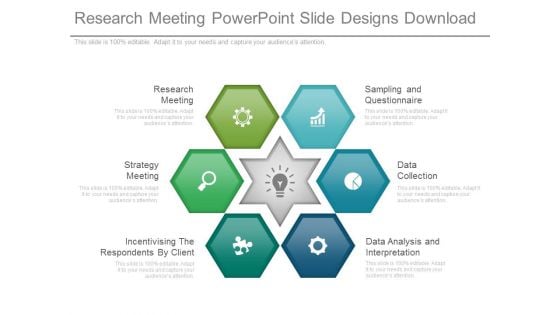
Research Meeting Powerpoint Slide Designs Download
This is a research meeting powerpoint slide designs download. This is a six stage process. The stages in this process are research meeting, sampling and questionnaire, strategy meeting, data collection, incentivising the respondents by client, data analysis and interpretation.
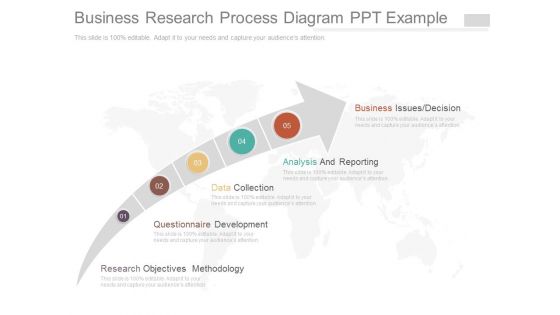
Business Research Process Diagram Ppt Example
This is a business research process diagram ppt example. This is a five stage process. The stages in this process are business issues decision, analysis and reporting, data collection, questionnaire development, research objectives methodology.

Editable Bell Curve PowerPoint Templates Statistical Curve Ppt Slides
Editable Bell Curve PowerPoint templates Statistical Curve PPT Slides-These high quality, editable pre-designed powerpoint slides have been carefully created by our professional team to help you impress your audience. Each graphic in every slide is vector based and is 100% editable in powerpoint. Each and every property of any slide - color, size, shading etc can be modified to build an effective powerpoint presentation. Use these slides to convey complex business concepts in a simplified manner. Any text can be entered at any point in the powerpoint slide. Simply DOWNLOAD, TYPE and PRESENT! Dwell on your argument with our Editable Bell Curve PowerPoint Templates Statistical Curve Ppt Slides. Your audience will see eye to eye with you.
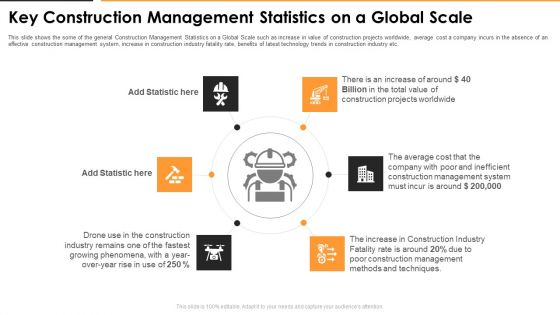
Key Construction Management Statistics On A Global Scale Introduction PDF
This slide shows the some of the general Construction Management Statistics on a Global Scale such as increase in value of construction projects worldwide, average cost a company incurs in the absence of an effective construction management system, increase in construction industry fatality rate, benefits of latest technology trends in construction industry etc. Presenting key construction management statistics on a global scale introduction pdf to provide visual cues and insights. Share and navigate important information on six stages that need your due attention. This template can be used to pitch topics like drone use in the construction industry, management system, techniques, methods, value. In addtion, this PPT design contains high resolution images, graphics, etc, that are easily editable and available for immediate download.
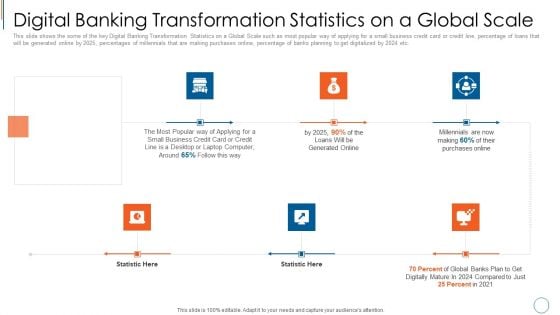
Digital Banking Transformation Statistics On A Global Scale Slides PDF
This slide shows the some of the key Digital Banking Transformation Statistics on a Global Scale such as most popular way of applying for a small business credit card or credit line, percentage of loans that will be generated online by 2025, percentages of millennials that are making purchases online, percentage of banks planning to get digitalized by 2024 etc. This is a digital banking transformation statistics on a global scale slides pdf template with various stages. Focus and dispense information on six stages using this creative set, that comes with editable features. It contains large content boxes to add your information on topics like business, credit card, loans. You can also showcase facts, figures, and other relevant content using this PPT layout. Grab it now.
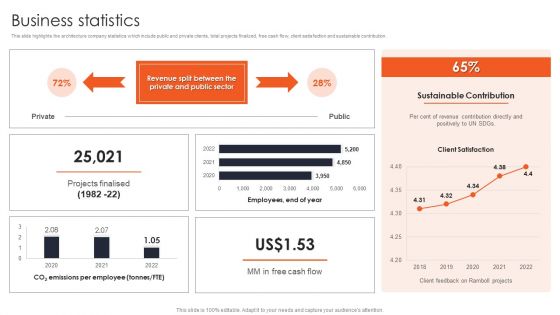
International Design And Architecture Firm Business Statistics Designs PDF
This slide highlights the architecture company statistics which include public and private clients, total projects finalized, free cash flow, client satisfaction and sustainable contribution. Are you in need of a template that can accommodate all of your creative concepts This one is crafted professionally and can be altered to fit any style. Use it with Google Slides or PowerPoint. Include striking photographs, symbols, depictions, and other visuals. Fill, move around, or remove text boxes as desired. Test out color palettes and font mixtures. Edit and save your work, or work with colleagues. Download International Design And Architecture Firm Business Statistics Designs PDF and observe how to make your presentation outstanding. Give an impeccable presentation to your group and make your presentation unforgettable.
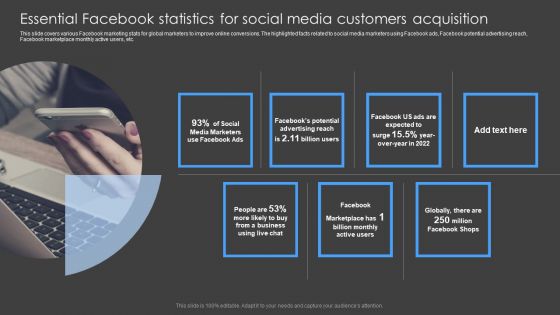
Essential Facebook Statistics For Social Media Customers Acquisition Microsoft PDF
This slide covers various Facebook marketing stats for global marketers to improve online conversions. The highlighted facts related to social media marketers using Facebook ads, Facebook potential advertising reach, Facebook marketplace monthly active users, etc. If you are looking for a format to display your unique thoughts, then the professionally designed Essential Facebook Statistics For Social Media Customers Acquisition Microsoft PDF is the one for you. You can use it as a Google Slides template or a PowerPoint template. Incorporate impressive visuals, symbols, images, and other charts. Modify or reorganize the text boxes as you desire. Experiment with shade schemes and font pairings. Alter, share or cooperate with other people on your work. Download Essential Facebook Statistics For Social Media Customers Acquisition Microsoft PDF and find out how to give a successful presentation. Present a perfect display to your team and make your presentation unforgettable.
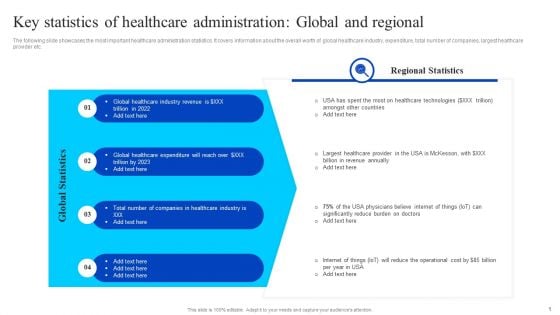
Key Statistics Of Healthcare Administration Global And Regional Ideas PDF
The following slide showcases the most important healthcare administration statistics. It covers information about the overall worth of global healthcare industry, expenditure, total number of companies, largest healthcare provider etc. Coming up with a presentation necessitates that the majority of the effort goes into the content and the message you intend to convey. The visuals of a PowerPoint presentation can only be effective if it supplements and supports the story that is being told. Keeping this in mind our experts created Key Statistics Of Healthcare Administration Global And Regional Ideas PDF to reduce the time that goes into designing the presentation. This way, you can concentrate on the message while our designers take care of providing you with the right template for the situation.
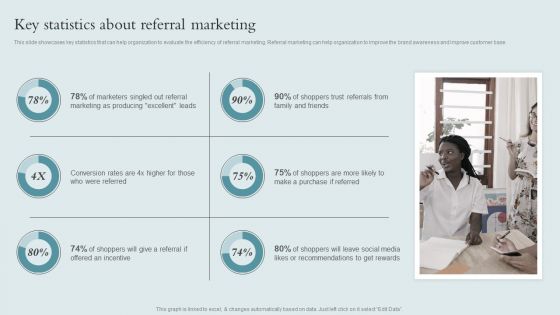
Brand Awareness Strategy Key Statistics About Referral Marketing Summary PDF
This slide showcases key statistics that can help organization to evaluate the efficiency of referral marketing. Referral marketing can help organization to improve the brand awareness and improve customer base. Coming up with a presentation necessitates that the majority of the effort goes into the content and the message you intend to convey. The visuals of a PowerPoint presentation can only be effective if it supplements and supports the story that is being told. Keeping this in mind our experts created Brand Awareness Strategy Key Statistics About Referral Marketing Summary PDF to reduce the time that goes into designing the presentation. This way, you can concentrate on the message while our designers take care of providing you with the right template for the situation.
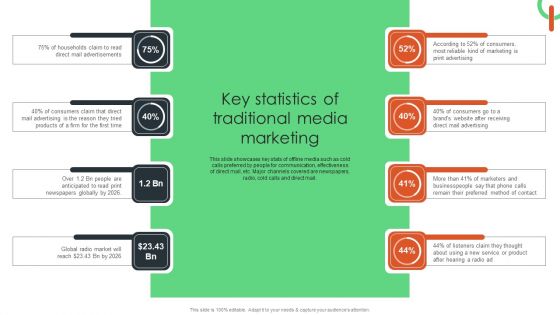
Key Statistics Of Traditional Media Marketing Graphics PDF
This slide showcases key stats of offline media such as cold calls preferred by people for communication, effectiveness of direct mail, etc. Major channels covered are newspapers, radio, cold calls and direct mail. Do you have to make sure that everyone on your team knows about any specific topic I yes, then you should give Key Statistics Of Traditional Media Marketing Graphics PDF a try. Our experts have put a lot of knowledge and effort into creating this impeccable Key Statistics Of Traditional Media Marketing Graphics PDF. You can use this template for your upcoming presentations, as the slides are perfect to represent even the tiniest detail. You can download these templates from the Slidegeeks website and these are easy to edit. So grab these today
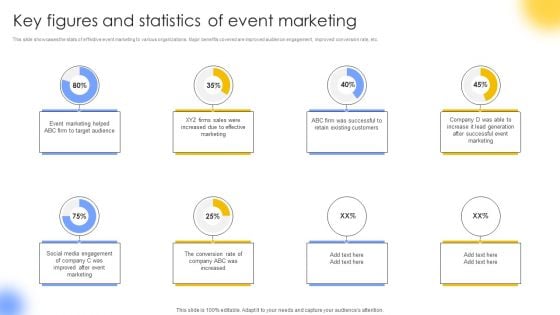
Key Figures And Statistics Of Event Marketing Portrait PDF
This slide showcases the stats of effective event marketing to various organizations. Major benefits covered are improved audience engagement, improved conversion rate, etc. If you are looking for a format to display your unique thoughts, then the professionally designed Key Figures And Statistics Of Event Marketing Portrait PDF is the one for you. You can use it as a Google Slides template or a PowerPoint template. Incorporate impressive visuals, symbols, images, and other charts. Modify or reorganize the text boxes as you desire. Experiment with shade schemes and font pairings. Alter, share or cooperate with other people on your work. Download Key Figures And Statistics Of Event Marketing Portrait PDF and find out how to give a successful presentation. Present a perfect display to your team and make your presentation unforgettable.
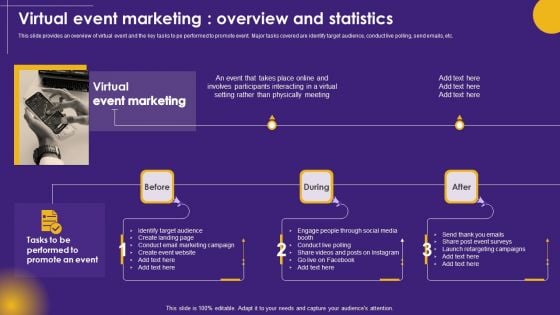
Virtual Event Marketing Overview And Statistics Virtual Communication Demonstration PDF
This slide provides an overview of virtual event and the key tasks to pe performed to promote event. Major tasks covered are identify target audience, conduct live polling, send emails, etc. Crafting an eye catching presentation has never been more straightforward. Let your presentation shine with this tasteful yet straightforward Virtual Event Marketing Overview And Statistics Virtual Communication Demonstration PDF template. It offers a minimalistic and classy look that is great for making a statement. The colors have been employed intelligently to add a bit of playfulness while still remaining professional. Construct the ideal Virtual Event Marketing Overview And Statistics Virtual Communication Demonstration PDF that effortlessly grabs the attention of your audience. Begin now and be certain to wow your customers.
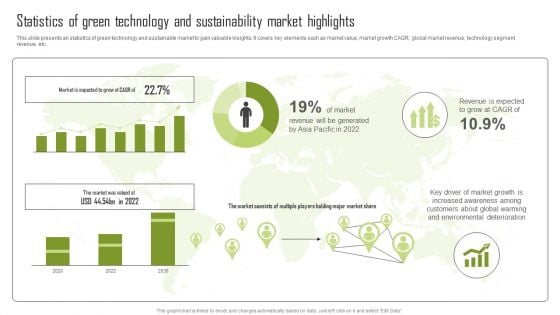
Statistics Of Green Technology And Sustainability Market Highlights Sample PDF
This slide presents an statistics of green technology and sustainable market to gain valuable insights. It covers key elements such as market value, market growth CAGR, global market revenue, technology segment revenue, etc. Do you know about Slidesgeeks Statistics Of Green Technology And Sustainability Market Highlights Sample PDF These are perfect for delivering any kind od presentation. Using it, create PowerPoint presentations that communicate your ideas and engage audiences. Save time and effort by using our pre designed presentation templates that are perfect for a wide range of topic. Our vast selection of designs covers a range of styles, from creative to business, and are all highly customizable and easy to edit. Download as a PowerPoint template or use them as Google Slides themes.
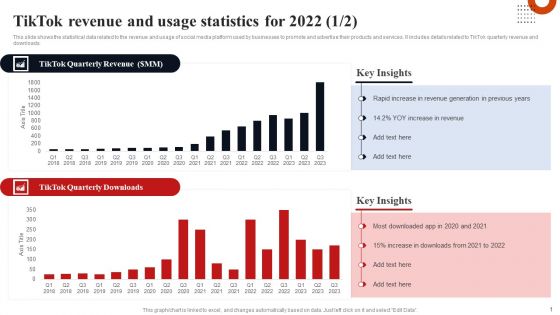
Tiktok Revenue And Usage Statistics For 2022 Introduction PDF
This slide shows the statistical data related to the revenue and usage of social media platform used by businesses to promote and advertise their products and services. It includes details related to TikTok quarterly revenue and downloads. This Tiktok Revenue And Usage Statistics For 2022 Introduction PDF is perfect for any presentation, be it in front of clients or colleagues. It is a versatile and stylish solution for organizing your meetings. The product features a modern design for your presentation meetings. The adjustable and customizable slides provide unlimited possibilities for acing up your presentation. Slidegeeks has done all the homework before launching the product for you. So, do not wait, grab the presentation templates today
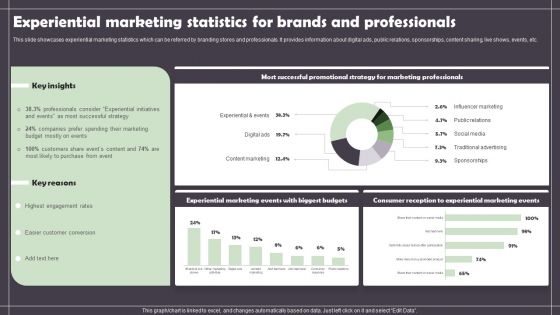
Experiential Marketing Statistics For Brands And Professionals Background PDF
This slide showcases experiential marketing statistics which can be referred by branding stores and professionals. It provides information about digital ads, public relations, sponsorships, content sharing, live shows, events, etc. This Experiential Marketing Statistics For Brands And Professionals Background PDF from Slidegeeks makes it easy to present information on your topic with precision. It provides customization options, so you can make changes to the colors, design, graphics, or any other component to create a unique layout. It is also available for immediate download, so you can begin using it right away. Slidegeeks has done good research to ensure that you have everything you need to make your presentation stand out. Make a name out there for a brilliant performance.
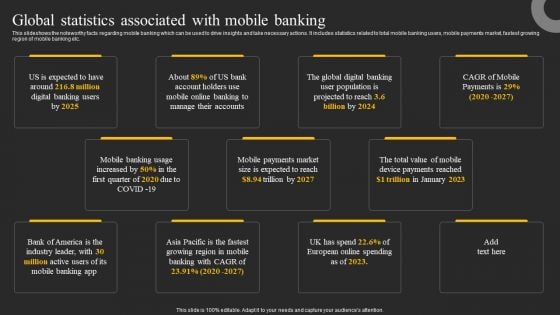
Global Statistics Associated With Mobile Banking Ppt Infographics Slides PDF
This slideshows the noteworthy facts regarding mobile banking which can be used to drive insights and take necessary actions. It includes statistics related to total mobile banking users, mobile payments market, fastest growing region of mobile banking etc. Present like a pro with Global Statistics Associated With Mobile Banking Ppt Infographics Slides PDF Create beautiful presentations together with your team, using our easy to use presentation slides. Share your ideas in real time and make changes on the fly by downloading our templates. So whether you are in the office, on the go, or in a remote location, you can stay in sync with your team and present your ideas with confidence. With Slidegeeks presentation got a whole lot easier. Grab these presentations today.
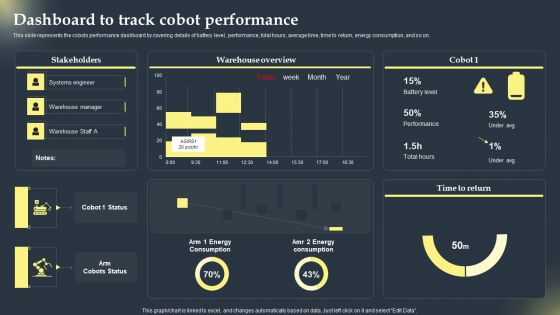
Cobots Global Statistics Dashboard To Track Cobot Performance Mockup PDF
This slide represents the cobots performance dashboard by covering details of battery level, performance, total hours, average time, time to return, energy consumption, and so on. If you are looking for a format to display your unique thoughts, then the professionally designed Cobots Global Statistics Dashboard To Track Cobot Performance Mockup PDF is the one for you. You can use it as a Google Slides template or a PowerPoint template. Incorporate impressive visuals, symbols, images, and other charts. Modify or reorganize the text boxes as you desire. Experiment with shade schemes and font pairings. Alter, share or cooperate with other people on your work. Download Cobots Global Statistics Dashboard To Track Cobot Performance Mockup PDF and find out how to give a successful presentation. Present a perfect display to your team and make your presentation unforgettable.
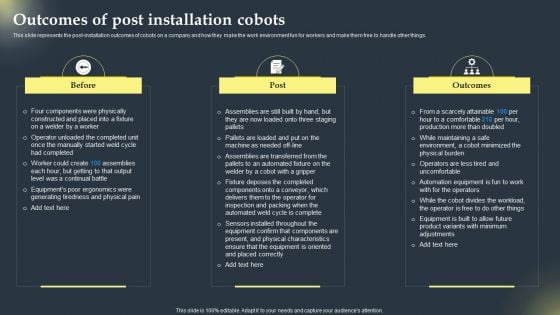
Cobots Global Statistics Outcomes Of Post Installation Cobots Infographics PDF
This slide represents the post-installation outcomes of cobots on a company and how they make the work environment fun for workers and make them free to handle other things. Formulating a presentation can take up a lot of effort and time, so the content and message should always be the primary focus. The visuals of the PowerPoint can enhance the presenters message, so our Cobots Global Statistics Outcomes Of Post Installation Cobots Infographics PDF was created to help save time. Instead of worrying about the design, the presenter can concentrate on the message while our designers work on creating the ideal templates for whatever situation is needed. Slidegeeks has experts for everything from amazing designs to valuable content, we have put everything into Cobots Global Statistics Outcomes Of Post Installation Cobots Infographics PDF

Key Informational Statistics On Workplace Conflict Ppt Inspiration Maker PDF
The purpose of this slide is to outline latest workplace conflict statistics. It covers information about employees experiencing verbal abuse, 6 month conflict between key stakeholders, employees feeling stress level etc. This modern and well arranged Key Informational Statistics On Workplace Conflict Ppt Inspiration Maker PDF provides lots of creative possibilities. It is very simple to customize and edit with the Powerpoint Software. Just drag and drop your pictures into the shapes. All facets of this template can be edited with Powerpoint no extra software is necessary. Add your own material, put your images in the places assigned for them, adjust the colors, and then you can show your slides to the world, with an animated slide included.
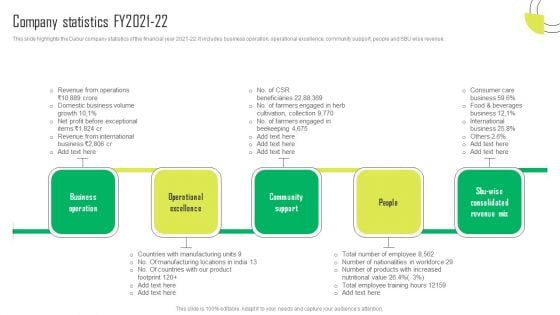
Herbal Products Company Profile Company Statistics FY2021 22 Pictures PDF
This slide highlights the Dabur company statistics of the financial year 2021-22. It includes business operation, operational excellence, community support, people and SBU wise revenue. Are you in need of a template that can accommodate all of your creative concepts This one is crafted professionally and can be altered to fit any style. Use it with Google Slides or PowerPoint. Include striking photographs, symbols, depictions, and other visuals. Fill, move around, or remove text boxes as desired. Test out color palettes and font mixtures. Edit and save your work, or work with colleagues. Download Herbal Products Company Profile Company Statistics FY2021 22 Pictures PDF and observe how to make your presentation outstanding. Give an impeccable presentation to your group and make your presentation unforgettable.

Marketing Agency Company Outline Company Website Engagement Statistics Guidelines PDF
The following slide depicts the digital engagement data of pureprofile company to monitor the business reach. It shows global traffic rank, monthly rank growth, visit duration, visit duration growth, page views, page views growth, bounce rate and bounce rate growth. Find highly impressive Marketing Agency Company Outline Company Website Engagement Statistics Guidelines PDF on Slidegeeks to deliver a meaningful presentation. You can save an ample amount of time using these presentation templates. No need to worry to prepare everything from scratch because Slidegeeks experts have already done a huge research and work for you. You need to download Marketing Agency Company Outline Company Website Engagement Statistics Guidelines PDF for your upcoming presentation. All the presentation templates are 100 percent editable and you can change the color and personalize the content accordingly. Download now.
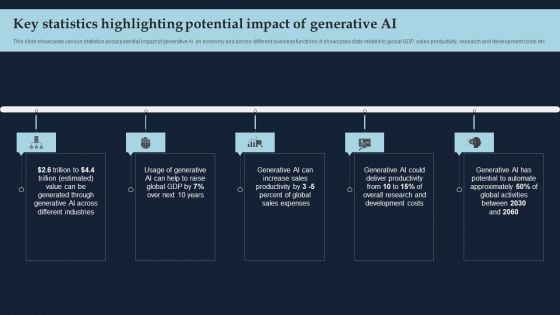
Key Statistics Highlighting Potential Impact Of Generative AI Introduction PDF
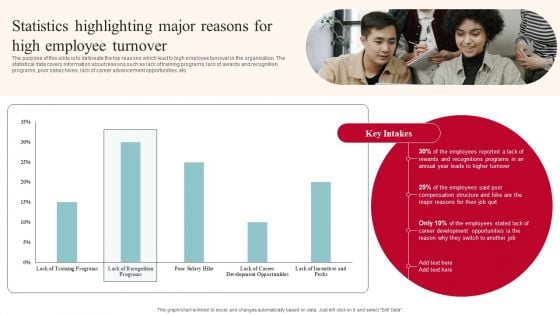
Statistics Highlighting Major Reasons For High Employee Turnover Sample PDF
The purpose of this slide is to delineate the top reasons which lead to high employee turnover in the organization. The statistical data covers information about reasons such as lack of training programs, lack of awards and recognition programs, poor salary hikes, lack of career advancement opportunities, etc. Present like a pro with Statistics Highlighting Major Reasons For High Employee Turnover Sample PDF Create beautiful presentations together with your team, using our easy to use presentation slides. Share your ideas in real time and make changes on the fly by downloading our templates. So whether you are in the office, on the go, or in a remote location, you can stay in sync with your team and present your ideas with confidence. With Slidegeeks presentation got a whole lot easier. Grab these presentations today.
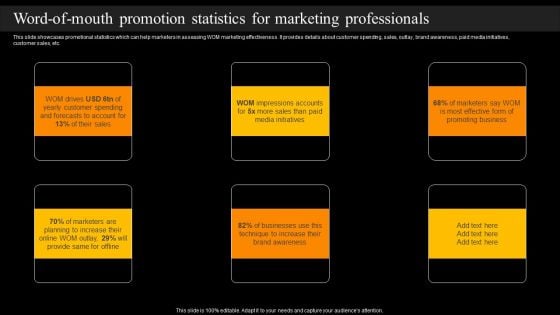
Word Of Mouth Promotion Statistics For Marketing Professionals Elements PDF
This slide showcases promotional statistics which can help marketers in assessing WOM marketing effectiveness. It provides details about customer spending, sales, outlay, brand awareness, paid media initiatives, customer sales, etc. Slidegeeks has constructed Word Of Mouth Promotion Statistics For Marketing Professionals Elements PDF after conducting extensive research and examination. These presentation templates are constantly being generated and modified based on user preferences and critiques from editors. Here, you will find the most attractive templates for a range of purposes while taking into account ratings and remarks from users regarding the content. This is an excellent jumping off point to explore our content and will give new users an insight into our top notch PowerPoint Templates.
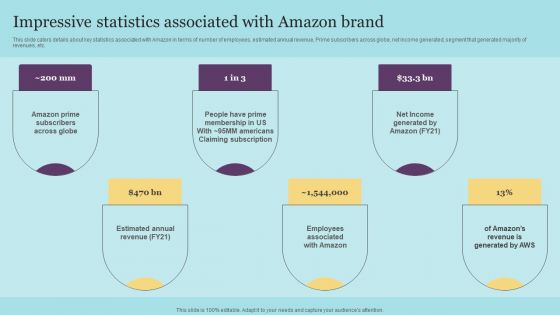
Impressive Statistics Associated With Amazon Brand Rules PDF
This slide caters details about key statistics associated with Amazon in terms of number of employees, estimated annual revenue, Prime subscribers across globe, net income generated, segment that generated majority of revenues, etc. Welcome to our selection of the Impressive Statistics Associated With Amazon Brand Rules PDF. These are designed to help you showcase your creativity and bring your sphere to life. Planning and Innovation are essential for any business that is just starting out. This collection contains the designs that you need for your everyday presentations. All of our PowerPoints are 100 percent editable, so you can customize them to suit your needs. This multi-purpose template can be used in various situations. Grab these presentation templates today
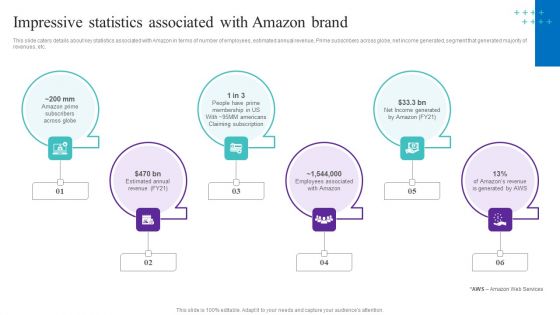
Impressive Statistics Associated With Amazon Brand Slides PDF
This slide caters details about key statistics associated with Amazon in terms of number of employees, estimated annual revenue, Prime subscribers across globe, net income generated, segment that generated majority of revenues, etc. Welcome to our selection of the Impressive Statistics Associated With Amazon Brand Slides PDF. These are designed to help you showcase your creativity and bring your sphere to life. Planning and Innovation are essential for any business that is just starting out. This collection contains the designs that you need for your everyday presentations. All of our PowerPoints are 100 percent editable, so you can customize them to suit your needs. This multi-purpose template can be used in various situations. Grab these presentation templates today
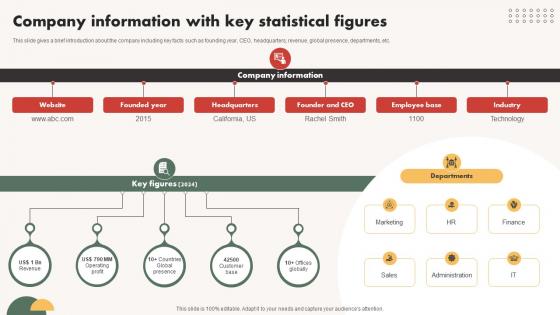
Automated Communication System Company Information With Key Statistical Figures
This slide gives a brief introduction about the company including key facts such as founding year, CEO, headquarters, revenue, global presence, departments, etc. Whether you have daily or monthly meetings, a brilliant presentation is necessary. Automated Communication System Company Information With Key Statistical Figures can be your best option for delivering a presentation. Represent everything in detail using Automated Communication System Company Information With Key Statistical Figures and make yourself stand out in meetings. The template is versatile and follows a structure that will cater to your requirements. All the templates prepared by Slidegeeks are easy to download and edit. Our research experts have taken care of the corporate themes as well. So, give it a try and see the results. This slide gives a brief introduction about the company including key facts such as founding year, CEO, headquarters, revenue, global presence, departments, etc.

Managing Technical And Non Cybersecurity Issues Overview And Key Statistics
Mentioned slide provides introduction about cyber security issues. It includes key elements such as description, types of security issue, key facts, and negative impact on business. Formulating a presentation can take up a lot of effort and time, so the content and message should always be the primary focus. The visuals of the PowerPoint can enhance the presenters message, so our Managing Technical And Non Cybersecurity Issues Overview And Key Statistics was created to help save time. Instead of worrying about the design, the presenter can concentrate on the message while our designers work on creating the ideal templates for whatever situation is needed. Slidegeeks has experts for everything from amazing designs to valuable content, we have put everything into Managing Technical And Non Cybersecurity Issues Overview And Key Statistics. Mentioned slide provides introduction about cyber security issues. It includes key elements such as description, types of security issue, key facts, and negative impact on business.
Statistics Procurement Ppt PowerPoint Presentation Portfolio Summary Cpb Pdf
Presenting this set of slides with name statistics procurement ppt powerpoint presentation portfolio summary cpb pdf. This is an editable Powerpoint four stages graphic that deals with topics like standards third party risk management framework to help convey your message better graphically. This product is a premium product available for immediate download and is 100 percent editable in Powerpoint. Download this now and use it in your presentations to impress your audience.
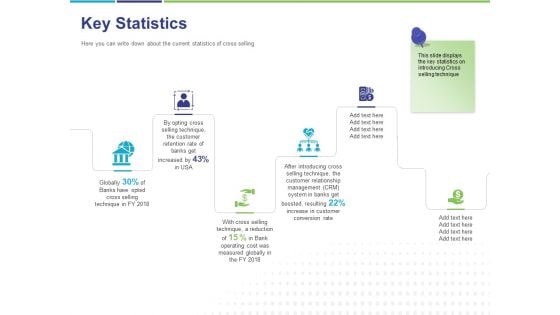
Commodity Up Selling Key Statistics Ppt Model Background Image PDF
Presenting this set of slides with name commodity up selling key statistics ppt model background image pdf. This is a six stage process. The stages in this process are globally thirty percent of banks have opted cross selling technique in fy 2018, by opting cross selling technique, the customer retention rate of banks get increased by fourty three percent in usa. This is a completely editable PowerPoint presentation and is available for immediate download. Download now and impress your audience.
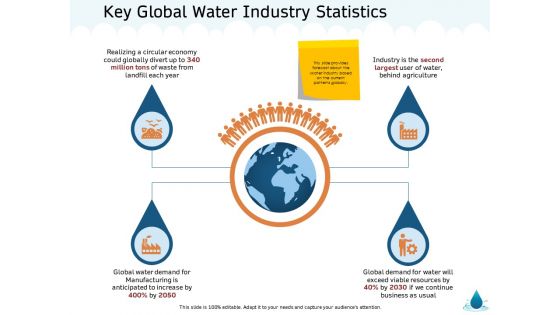
Water NRM Key Global Water Industry Statistics Ppt Slides PDF
Presenting this set of slides with name water nrm key global water industry statistics ppt slides pdf. This is a four stage process. The stages in this process are realizing a circular economy could globally divert up to 340 million tons of waste from landfill each year, industry is the second largest user of water, behind agriculture. This is a completely editable PowerPoint presentation and is available for immediate download. Download now and impress your audience.

Market Sizing Key Statistics Ppt Infographic Template Design Templates PDF
Presenting this set of slides with name market sizing key statistics ppt infographic template design templates pdf. This is a one stage process. The stages in this process are users dont protect their devices, of connected devices store personal information, of devices are vulnerable to security, of cyber attacks are unnoticed. This is a completely editable PowerPoint presentation and is available for immediate download. Download now and impress your audience.

TAM SAM And SOM Key Statistics Ppt Inspiration Maker PDF
Presenting tam sam and som key statistics ppt inspiration maker pdf to provide visual cues and insights. Share and navigate important information on one stage that need your due attention. This template can be used to pitch topics like users dont protect their devices, of connected devices store personal information, of devices are vulnerable to security, of cyber attacks are unnoticed. In addition, this PPT design contains high-resolution images, graphics, etc, that are easily editable and available for immediate download.
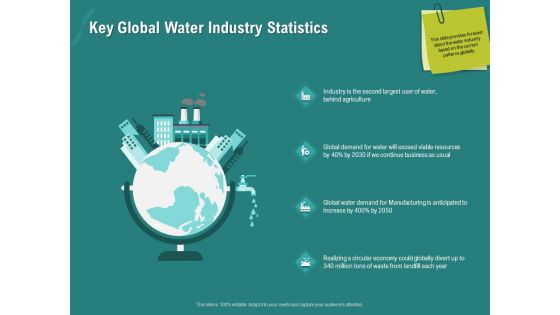
Ocean Water Supervision Key Global Water Industry Statistics Structure PDF
This is a ocean water supervision key global water industry statistics structure pdf template with various stages. Focus and dispense information on four stages using this creative set, that comes with editable features. It contains large content boxes to add your information on topics like agriculture, business, resources, global, manufacturing. You can also showcase facts, figures, and other relevant content using this PPT layout. Grab it now.
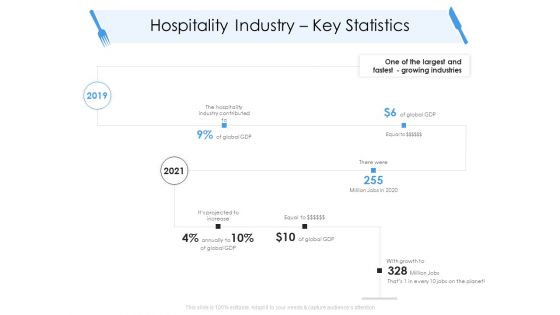
Tourism And Hospitality Industry Hospitality Industry Key Statistics Mockup PDF
This is a tourism and hospitality industry hospitality industry key statistics mockup pdf template with various stages. Focus and dispense information on two stages using this creative set, that comes with editable features. It contains large content boxes to add your information on topics like industry contributed, global, projected, growth. You can also showcase facts, figures, and other relevant content using this PPT layout. Grab it now.
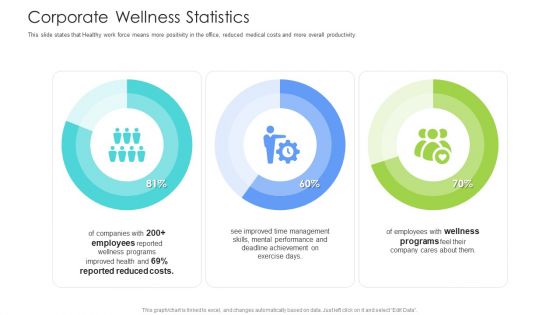
Well Being Gymnasium Sector Corporate Wellness Statistics Background PDF
This slide states that Healthy work force means more positivity in the office, reduced medical costs and more overall productivity. Deliver and pitch your topic in the best possible manner with this well being gymnasium sector corporate wellness statistics background pdf. Use them to share invaluable insights on wellness programs, management skills, performance and impress your audience. This template can be altered and modified as per your expectations. So, grab it now.
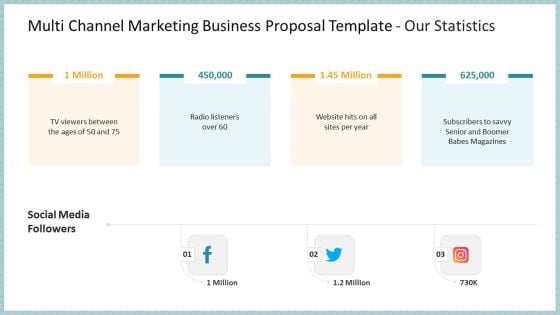
Multi Channel Marketing Business Proposal Template Our Statistics Rules PDF
Presenting multi channel marketing business proposal template our statistics rules pdf to provide visual cues and insights. Share and navigate important information on four stages that need your due attention. This template can be used to pitch topics like radio listeners over 60, subscribers to savvy senior and boomer babes magazines, social media followers. In addtion, this PPT design contains high resolution images, graphics, etc, that are easily editable and available for immediate download.
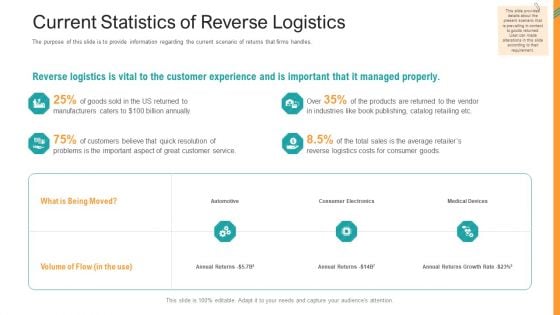
Reverse SCM Current Statistics Of Reverse Logistics Ppt Files PDF
The purpose of this slide is to provide information regarding the current scenario of returns that firms handles. Deliver and pitch your topic in the best possible manner with this reverse scm current statistics of reverse logistics ppt files pdf. Use them to share invaluable insights on customer experience, annual returns growth rate, reverse logistics costs and impress your audience. This template can be altered and modified as per your expectations. So, grab it now.
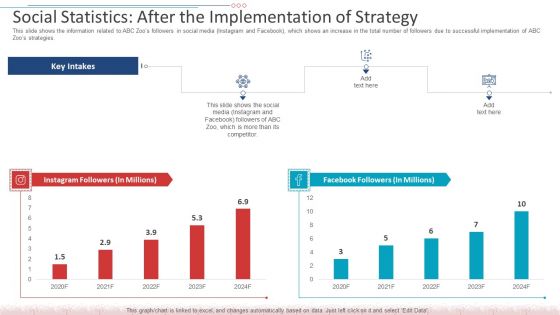
Social Statistics After The Implementation Of Strategy Background PDF
This slide shows the information related to ABC Zoos followers in social media Instagram and Facebook, which shows an increase in the total number of followers due to successful implementation of ABC Zoos strategies. Deliver an awe inspiring pitch with this creative social statistics after the implementation of strategy background pdf bundle. Topics like instagram followers, facebook followers can be discussed with this completely editable template. It is available for immediate download depending on the needs and requirements of the user.
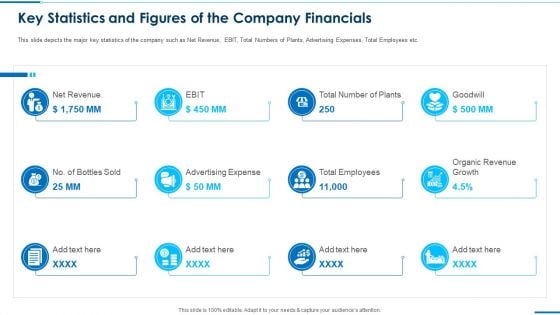
Key Statistics And Figures Of The Company Financials Pictures Pdf
This is a key statistics and figures of the company financials pictures pdf. template with various stages. Focus and dispense information on tweleve stages using this creative set, that comes with editable features. It contains large content boxes to add your information on topics like net revenue, advertising expense, total employees, organic revenue growth, ebit. You can also showcase facts, figures, and other relevant content using this PPT layout. Grab it now.
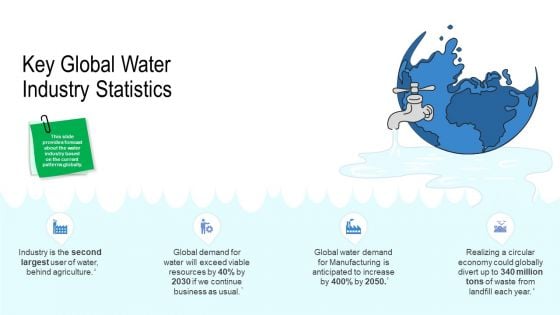
Water Quality Management Key Global Water Industry Statistics Elements PDF
This is a water quality management key global water industry statistics elements pdf template with various stages. Focus and dispense information on four stages using this creative set, that comes with editable features. It contains large content boxes to add your information on topics like agriculture, business, resources, global, manufacturing. You can also showcase facts, figures, and other relevant content using this PPT layout. Grab it now.
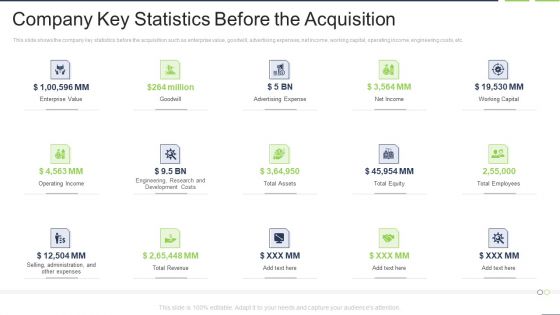
Company Key Statistics Before The Acquisition Graphics PDF
This is a company key statistics before the acquisition graphics pdf template with various stages. Focus and dispense information on fifteen stages using this creative set, that comes with editable features. It contains large content boxes to add your information on topics like enterprise value, operating income, engineering, research and development costs. You can also showcase facts, figures, and other relevant content using this PPT layout. Grab it now.
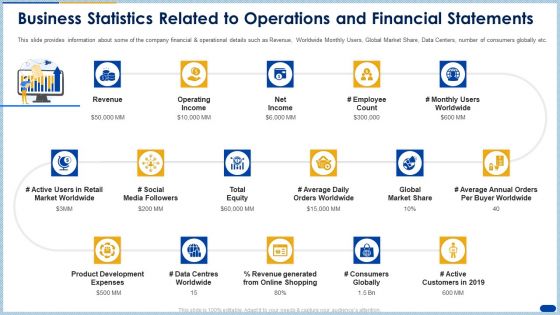
Business Statistics Related To Operations And Financial Statements Themes PDF
This slide provides information about some of the company financial and operational details such as Revenue, Worldwide Monthly Users, Global Market Share, Data Centers, number of consumers globally etc. Deliver an awe inspiring pitch with this creative business statistics related to operations and financial statements themes pdf bundle. Topics like revenue, operating income, product development expenses, net income, market share can be discussed with this completely editable template. It is available for immediate download depending on the needs and requirements of the user.
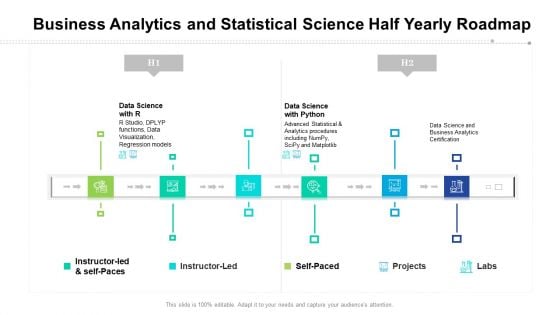
Business Analytics And Statistical Science Half Yearly Roadmap Summary
Presenting our innovatively structured business analytics and statistical science half yearly roadmap summary Template. Showcase your roadmap process in different formats like PDF, PNG, and JPG by clicking the download button below. This PPT design is available in both Standard Screen and Widescreen aspect ratios. It can also be easily personalized and presented with modified font size, font type, color, and shapes to measure your progress in a clear way.
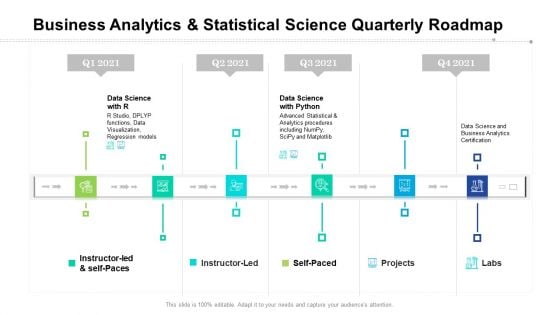
Business Analytics And Statistical Science Quarterly Roadmap Demonstration
Introducing our business analytics and statistical science quarterly roadmap demonstration. This PPT presentation is Google Slides compatible, therefore, you can share it easily with the collaborators for measuring the progress. Also, the presentation is available in both standard screen and widescreen aspect ratios. So edit the template design by modifying the font size, font type, color, and shapes as per your requirements. As this PPT design is fully editable it can be presented in PDF, JPG and PNG formats.
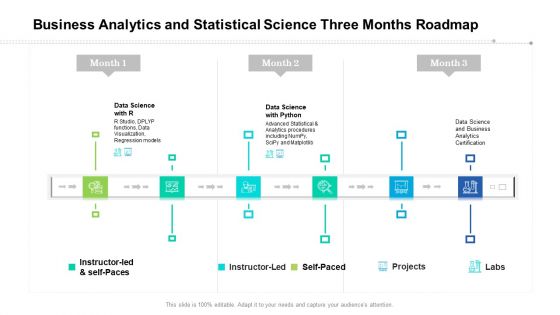
Business Analytics And Statistical Science Three Months Roadmap Demonstration
Presenting our jaw dropping business analytics and statistical science three months roadmap demonstration. You can alternate the color, font size, font type, and shapes of this PPT layout according to your strategic process. This PPT presentation is compatible with Google Slides and is available in both standard screen and widescreen aspect ratios. You can also download this well researched PowerPoint template design in different formats like PDF, JPG, and PNG. So utilize this visually appealing design by clicking the download button given below.
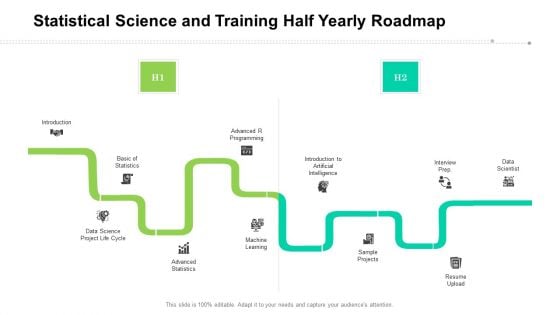
Statistical Science And Training Half Yearly Roadmap Portrait
Presenting our innovatively structured statistical science and training half yearly roadmap portrait Template. Showcase your roadmap process in different formats like PDF, PNG, and JPG by clicking the download button below. This PPT design is available in both Standard Screen and Widescreen aspect ratios. It can also be easily personalized and presented with modified font size, font type, color, and shapes to measure your progress in a clear way.
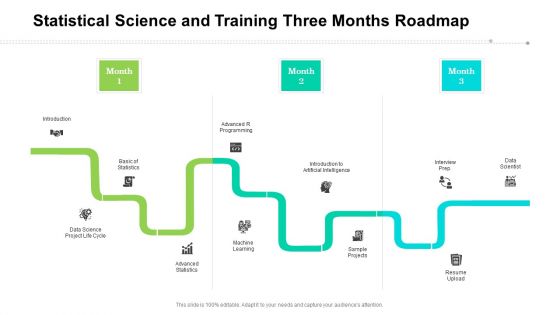
Statistical Science And Training Three Months Roadmap Background
Presenting our jaw dropping statistical science and training three months roadmap background. You can alternate the color, font size, font type, and shapes of this PPT layout according to your strategic process. This PPT presentation is compatible with Google Slides and is available in both standard screen and widescreen aspect ratios. You can also download this well researched PowerPoint template design in different formats like PDF, JPG, and PNG. So utilize this visually appealing design by clicking the download button given below.
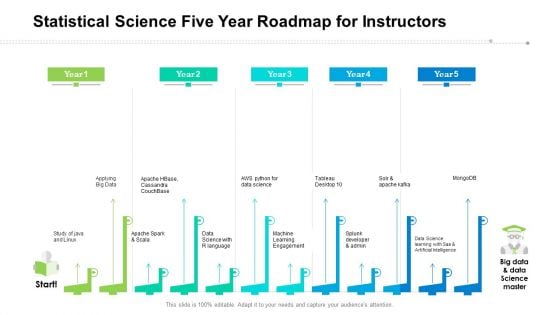
Statistical Science Five Year Roadmap For Instructors Structure
Presenting our innovatively structured statistical science five year roadmap for instructors structure Template. Showcase your roadmap process in different formats like PDF, PNG, and JPG by clicking the download button below. This PPT design is available in both Standard Screen and Widescreen aspect ratios. It can also be easily personalized and presented with modified font size, font type, color, and shapes to measure your progress in a clear way.
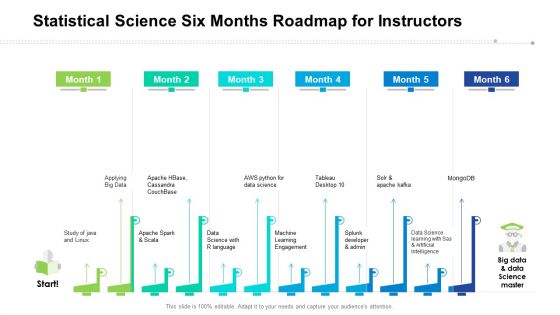
Statistical Science Six Months Roadmap For Instructors Inspiration
Introducing our statistical science six months roadmap for instructors inspiration. This PPT presentation is Google Slides compatible, therefore, you can share it easily with the collaborators for measuring the progress. Also, the presentation is available in both standard screen and widescreen aspect ratios. So edit the template design by modifying the font size, font type, color, and shapes as per your requirements. As this PPT design is fully editable it can be presented in PDF, JPG and PNG formats.
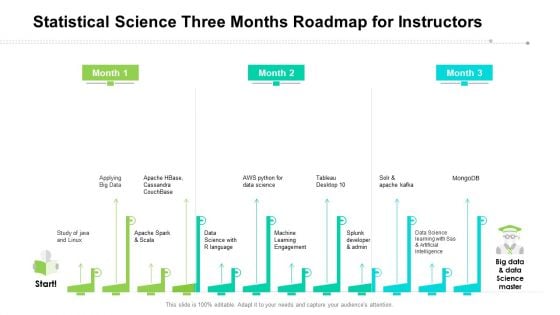
Statistical Science Three Months Roadmap For Instructors Diagrams
Presenting our jaw dropping statistical science three months roadmap for instructors diagrams. You can alternate the color, font size, font type, and shapes of this PPT layout according to your strategic process. This PPT presentation is compatible with Google Slides and is available in both standard screen and widescreen aspect ratios. You can also download this well researched PowerPoint template design in different formats like PDF, JPG, and PNG. So utilize this visually appealing design by clicking the download button given below.
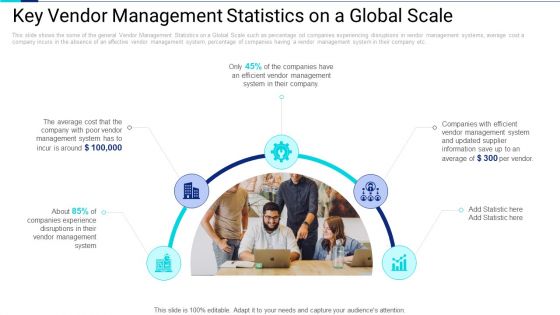
Key Vendor Management Statistics On A Global Scale Infographics PDF
Presenting key vendor management statistics on a global scale infographics pdf to provide visual cues and insights. Share and navigate important information on five stages that need your due attention. This template can be used to pitch topics like management system, vendor management, disruptions vendor management. In addtion, this PPT design contains high resolution images, graphics, etc, that are easily editable and available for immediate download.
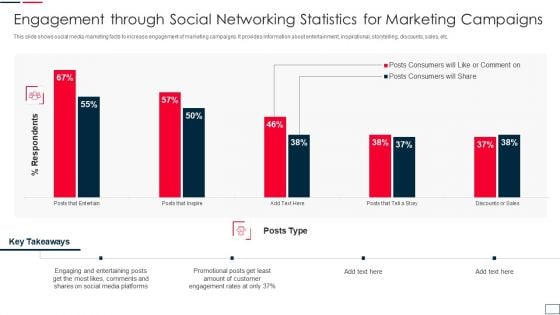
Engagement Through Social Networking Statistics For Marketing Campaigns Guidelines PDF
This slide shows social media marketing facts to increase engagement of marketing campaigns. It provides information about entertainment, inspirational, storytelling, discounts, sales, etc. Pitch your topic with ease and precision using this engagement through social networking statistics for marketing campaigns guidelines pdf. This layout presents information on rates, customer, social. It is also available for immediate download and adjustment. So, changes can be made in the color, design, graphics or any other component to create a unique layout.
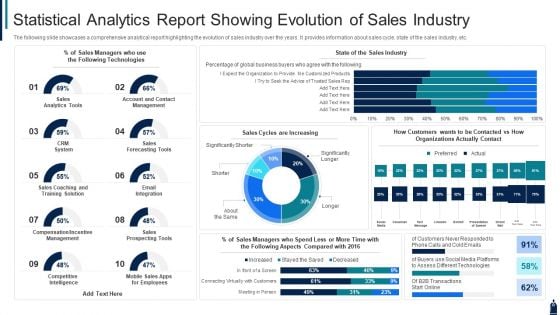
Statistical Analytics Report Showing Evolution Of Sales Industry Diagrams PDF
The following slide showcases a comprehensive analytical report highlighting the evolution of sales industry over the years. It provides information about sales cycle, state of the sales industry, etc. Showcasing this set of slides titled statistical analytics report showing evolution of sales industry diagrams pdf. The topics addressed in these templates are sales, technologies, system. All the content presented in this PPT design is completely editable. Download it and make adjustments in color, background, font etc. as per your unique business setting.
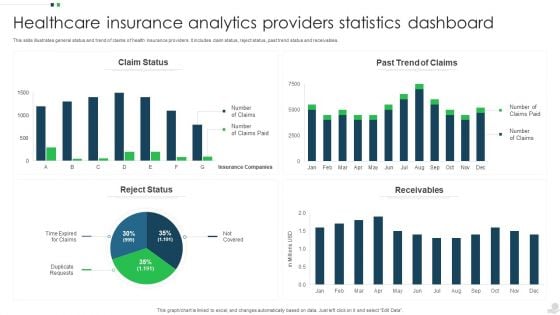
Healthcare Insurance Analytics Providers Statistics Dashboard Mockup PDF
This slide illustrates general status and trend of claims of health insurance providers. It includes claim status, reject status, past trend status and receivables. Showcasing this set of slides titled Healthcare Insurance Analytics Providers Statistics Dashboard Mockup PDF. The topics addressed in these templates are Claim Status, Past Trend Claims, Receivables. All the content presented in this PPT design is completely editable. Download it and make adjustments in color, background, font etc. as per your unique business setting.
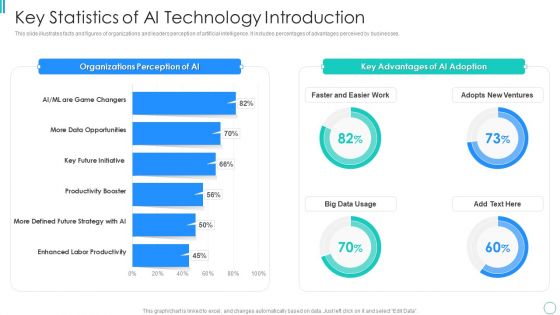
Key Statistics Of AI Technology Introduction Guidelines PDF
This slide illustrates facts and figures of organizations and leaders perception of artificial intelligence. It includes percentages of advantages perceived by businesses. Showcasing this set of slides titled Key Statistics Of AI Technology Introduction Guidelines PDF. The topics addressed in these templates are Organizations Perception Of Ai, Productivity Booster, Enhanced Labor Productivity. All the content presented in this PPT design is completely editable. Download it and make adjustments in color, background, font etc. as per your unique business setting.


 Continue with Email

 Home
Home


