Survey
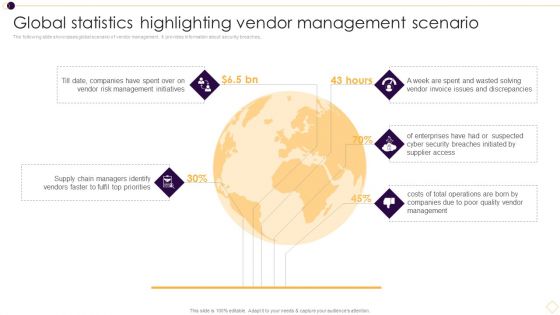
Global Statistics Highlighting Vendor Management Scenario Download PDF
The following slide showcases global scenario of vendor management. It provides information about security breaches,Presenting Global Statistics Highlighting Vendor Management Scenario Download PDF to provide visual cues and insights. Share and navigate important information on five stages that need your due attention. This template can be used to pitch topics like Risk Management, Security Breaches, Vendor Invoice. In addtion, this PPT design contains high resolution images, graphics, etc, that are easily editable and available for immediate download.
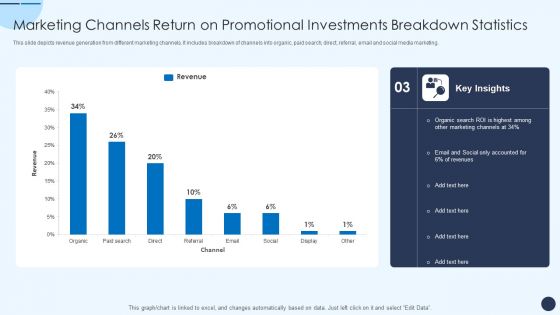
Marketing Channels Return On Promotional Investments Breakdown Statistics Information PDF
This slide depicts revenue generation from different marketing channels. It includes breakdown of channels into organic, paid search, direct, referral, email and social media marketing.Pitch your topic with ease and precision using this Marketing Channels Return On Promotional Investments Breakdown Statistics Information PDF. This layout presents information on Revenues Marketing, Organic Search, Social Accounted. It is also available for immediate download and adjustment. So, changes can be made in the color, design, graphics or any other component to create a unique layout.
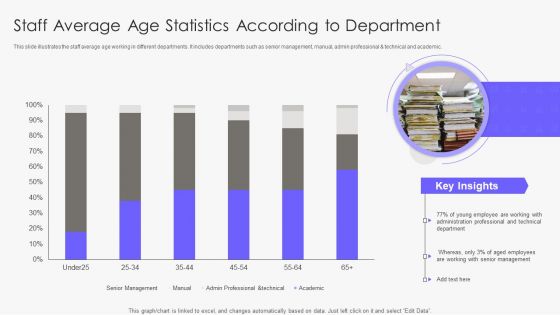
Staff Average Age Statistics According To Department Demonstration PDF
This slide illustrates the staff average age working in different departments. It includes departments such as senior management, manual, admin professional and technical and academic. Showcasing this set of slides titled Staff Average Age Statistics According To Department Demonstration PDF. The topics addressed in these templates are Administration Professional, Management, Employee. All the content presented in this PPT design is completely editable. Download it and make adjustments in color, background, font etc. as per your unique business setting.
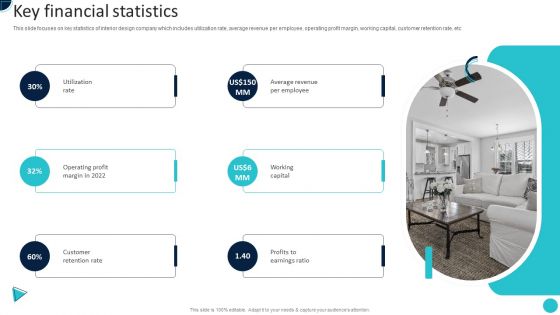
Home Decoration Company Profile Key Financial Statistics Portrait PDF
This slide focuses on future expansion plans of interior designing company which includes service diversification, engage with target audience, geographic expansion, etc.Deliver an awe inspiring pitch with this creative Home Decoration Company Profile Key Financial Statistics Portrait PDF bundle. Topics like Utilization Rate, Operating Profit, Customer Retention can be discussed with this completely editable template. It is available for immediate download depending on the needs and requirements of the user.
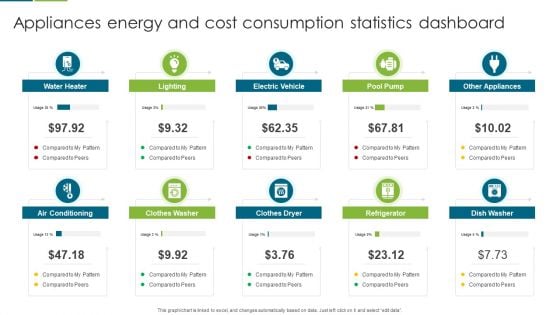
Appliances Energy And Cost Consumption Statistics Dashboard Download PDF
This graph or chart is linked to excel, and changes automatically based on data. Just left click on it and select edit data. Presenting Appliances Energy And Cost Consumption Statistics Dashboard Download PDF to dispense important information. This template comprises ten stages. It also presents valuable insights into the topics including Water Heater, Electric Vehicle, Pool Pump. This is a completely customizable PowerPoint theme that can be put to use immediately. So, download it and address the topic impactfully.
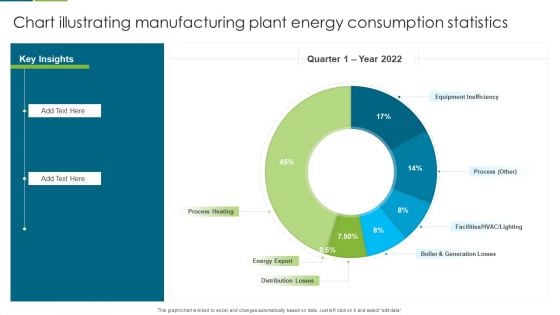
Chart Illustrating Manufacturing Plant Energy Consumption Statistics Slides PDF
This graph or chart is linked to excel, and changes automatically based on data. Just left click on it and select edit data. Pitch your topic with ease and precision using this Chart Illustrating Manufacturing Plant Energy Consumption Statistics Slides PDF. This layout presents information on Equipment Inefficiency, Process Heating, Energy Export. It is also available for immediate download and adjustment. So, changes can be made in the color, design, graphics or any other component to create a unique layout.
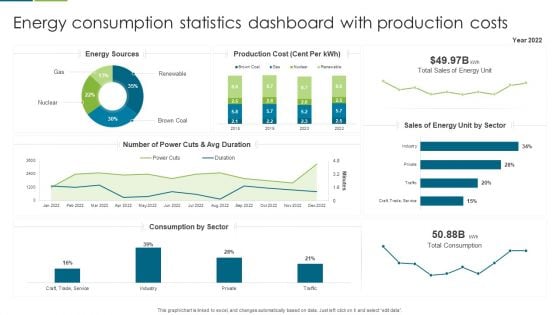
Energy Consumption Statistics Dashboard With Production Costs Slides PDF
This graph or chart is linked to excel, and changes automatically based on data. Just left click on it and select edit data. Showcasing this set of slides titled Energy Consumption Statistics Dashboard With Production Costs Slides PDF. The topics addressed in these templates are Production Cost, Sales Energy, Number Power. All the content presented in this PPT design is completely editable. Download it and make adjustments in color, background, font etc. as per your unique business setting.
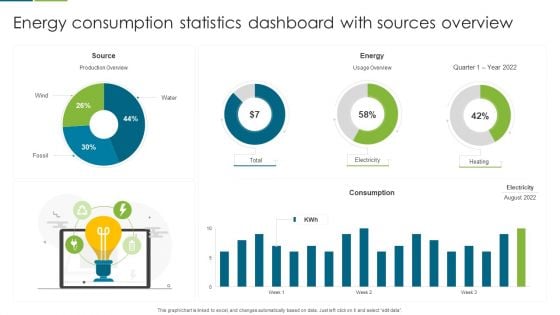
Energy Consumption Statistics Dashboard With Sources Overview Template PDF
This graph or chart is linked to excel, and changes automatically based on data. Just left click on it and select edit data. Pitch your topic with ease and precision using this Energy Consumption Statistics Dashboard With Sources Overview Template PDF. This layout presents information on Source, Energy, Consumption. It is also available for immediate download and adjustment. So, changes can be made in the color, design, graphics or any other component to create a unique layout.
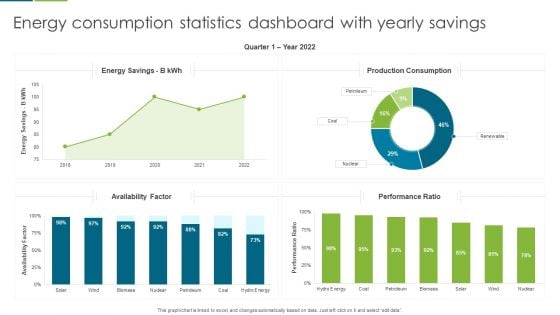
Energy Consumption Statistics Dashboard With Yearly Savings Guidelines PDF
This graph or chart is linked to excel, and changes automatically based on data. Just left click on it and select edit data. Showcasing this set of slides titled Energy Consumption Statistics Dashboard With Yearly Savings Guidelines PDF. The topics addressed in these templates are Production Consumption, Energy Savings, Performance Ratio. All the content presented in this PPT design is completely editable. Download it and make adjustments in color, background, font etc. as per your unique business setting.
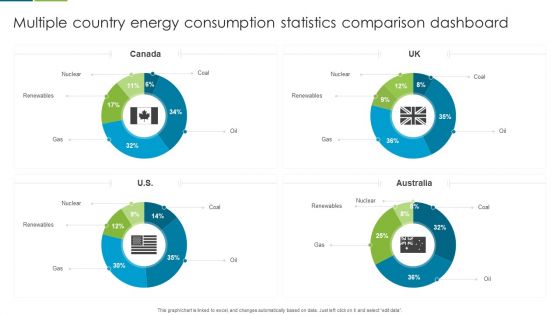
Multiple Country Energy Consumption Statistics Comparison Dashboard Formats PDF
This graph or chart is linked to excel, and changes automatically based on data. Just left click on it and select edit data. Pitch your topic with ease and precision using this Multiple Country Energy Consumption Statistics Comparison Dashboard Formats PDF. This layout presents information on Nuclear, Renewables, Gas. It is also available for immediate download and adjustment. So, changes can be made in the color, design, graphics or any other component to create a unique layout.
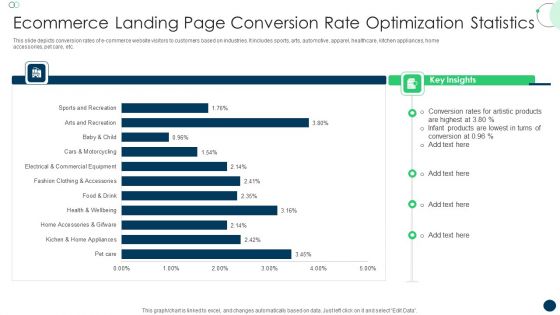
Ecommerce Landing Page Conversion Rate Optimization Statistics Sample PDF
This slide depicts conversion rates of e-commerce website visitors to customers based on industries. It includes sports, arts, automotive, apparel, healthcare, kitchen appliances, home accessories, pet care, etc. Showcasing this set of slides titled Ecommerce Landing Page Conversion Rate Optimization Statistics Sample PDF. The topics addressed in these templates are Conversion Rates, Artistic Products, Infant Products. All the content presented in this PPT design is completely editable. Download it and make adjustments in color, background, font etc. as per your unique business setting.
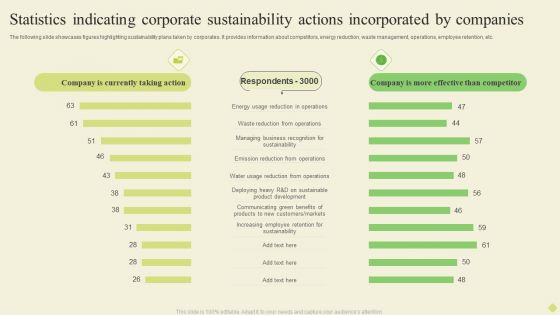
Statistics Indicating Corporate Sustainability Actions Incorporated By Companies Diagrams PDF
The following slide showcases figures highlighting sustainability plans taken by corporates. It provides information about competitors, energy reduction, waste management, operations, employee retention, etc.Pitch your topic with ease and precision using this Statistics Indicating Corporate Sustainability Actions Incorporated By Companies Diagrams PDF. This layout presents information on Energy Reduction, Emission Reduction, Increasing Employee. It is also available for immediate download and adjustment. So, changes can be made in the color, design, graphics or any other component to create a unique layout.
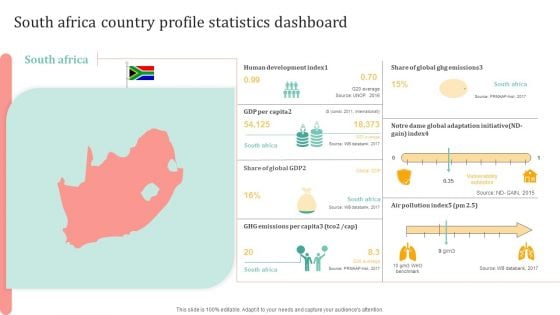
South Africa Country Profile Statistics Dashboard Ppt Infographics Diagrams PDF
Persuade your audience using this South Africa Country Profile Statistics Dashboard Ppt Infographics Diagrams PDF. This PPT design covers one stages, thus making it a great tool to use. It also caters to a variety of topics including Human Development Index, GDP Per Capita, GHG Emissions. Download this PPT design now to present a convincing pitch that not only emphasizes the topic but also showcases your presentation skills.
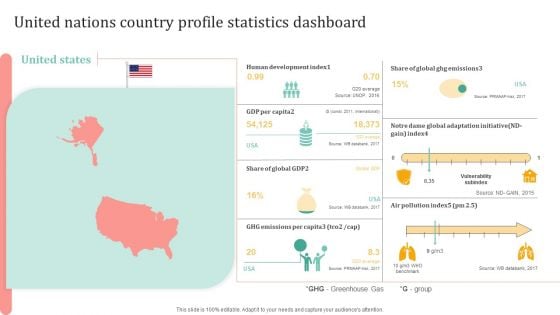
United Nations Country Profile Statistics Dashboard Ppt Outline Microsoft PDF
Persuade your audience using this United Nations Country Profile Statistics Dashboard Ppt Outline Microsoft PDF. This PPT design covers one stages, thus making it a great tool to use. It also caters to a variety of topics including Human Development Index, GDP Per Capita, GHG Emissions. Download this PPT design now to present a convincing pitch that not only emphasizes the topic but also showcases your presentation skills.
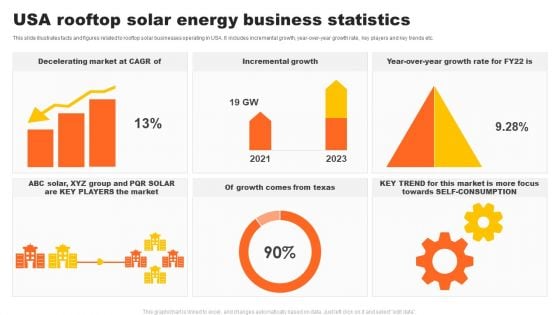
USA Rooftop Solar Energy Business Statistics Brochure PDF
This slide illustrates facts and figures related to rooftop solar businesses operating in USA. It includes incremental growth, year-over-year growth rate, key players and key trends etc. Showcasing this set of slides titled USA Rooftop Solar Energy Business Statistics Brochure PDF. The topics addressed in these templates are Decelerating Market, Incremental Growth, More Focus. All the content presented in this PPT design is completely editable. Download it and make adjustments in color, background, font etc. as per your unique business setting.
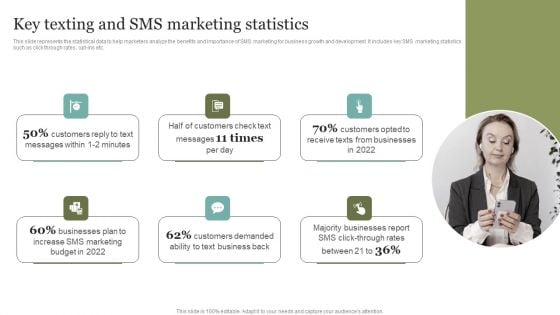
Key Texting And SMS Marketing Statistics Mockup PDF
Boost your pitch with our creative Key Texting And SMS Marketing Statistics Mockup PDF. Deliver an awe-inspiring pitch that will mesmerize everyone. Using these presentation templates you will surely catch everyones attention. You can browse the ppts collection on our website. We have researchers who are experts at creating the right content for the templates. So you dont have to invest time in any additional work. Just grab the template now and use them.
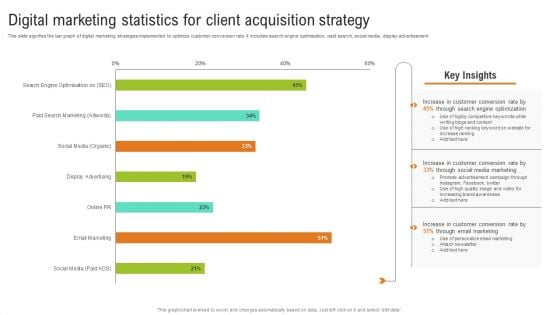
Digital Marketing Statistics For Client Acquisition Strategy Background PDF
This slide signifies the bar graph of digital marketing strategies implemented to optimize customer conversion rate. It includes search engine optimisation, paid search, social media, display advertisement. Showcasing this set of slides titled Digital Marketing Statistics For Client Acquisition Strategy Background PDF. The topics addressed in these templates are Optimization, Social Media, Marketing. All the content presented in this PPT design is completely editable. Download it and make adjustments in color, background, font etc. as per your unique business setting.

Cobots Global Statistics Our Cobots Representatives Team Elements PDF
This slide depicts our cobots representatives team, including the engineer optimizer, application engineer, senior mechanical designer, and mechanical designer. Make sure to capture your audiences attention in your business displays with our gratis customizable Cobots Global Statistics Our Cobots Representatives Team Elements PDF. These are great for business strategies, office conferences, capital raising or task suggestions. If you desire to acquire more customers for your tech business and ensure they stay satisfied, create your own sales presentation with these plain slides.
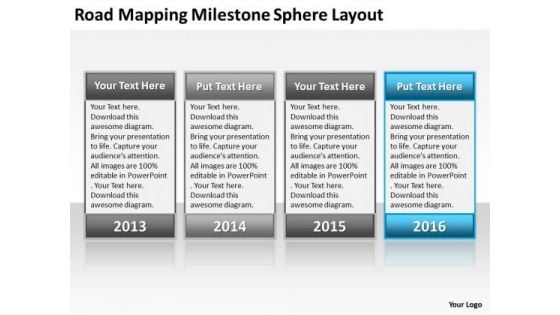
Business Case Diagram Road Mapping Milestone Sphere Layout PowerPoint Slides
We present our business case diagram road mapping milestone sphere layout PowerPoint Slides.Download and present our Business PowerPoint Templates because You can Give birth to your ideas with our PowerPoint Templates and Slides. See them grow big and strong in record time. Use our Process and Flows PowerPoint Templates because Our PowerPoint Templates and Slides will let you Leave a lasting impression to your audiences. They possess an inherent longstanding recall factor. Use our Marketing PowerPoint Templates because Our PowerPoint Templates and Slides are topically designed to provide an attractive backdrop to any subject. Present our Shapes PowerPoint Templates because Our PowerPoint Templates and Slides are Clear and concise. Use them and dispel any doubts your team may have. Use our Spheres PowerPoint Templates because Our PowerPoint Templates and Slides come in all colours, shades and hues. They help highlight every nuance of your views.Use these PowerPoint slides for presentations relating to Abstract, advertisement, arrow, background, billboard, business, buy, chart, check, checklist, checkout, commercial, discount, finance, icon, illustration, internet, label, list, retail, sale, service, set, shopping, site, tax, template, touch, unlimited, vector, web. The prominent colors used in the PowerPoint template are Blue light, Gray, Black. Charge your account with our Business Case Diagram Road Mapping Milestone Sphere Layout PowerPoint Slides. Earn the interest of your audience.

Statistical Business Meeting PowerPoint Templates Ppt Backgrounds For Slides 0213
We present our Statistical Business Meeting PowerPoint Templates PPT Backgrounds For Slides 0213.Present our Business PowerPoint Templates because It can Leverage your style with our PowerPoint Templates and Slides. Charm your audience with your ability. Download our People PowerPoint Templates because you can Break through with our PowerPoint Templates and Slides. Bring down the mental barriers of your audience. Download and present our Finance PowerPoint Templates because They will bring a lot to the table. Their alluring flavours will make your audience salivate. Use our Marketing PowerPoint Templates because You can Be the puppeteer with our PowerPoint Templates and Slides as your strings. Lead your team through the steps of your script. Use our Success PowerPoint Templates because You aspire to touch the sky with glory. Let our PowerPoint Templates and Slides provide the fuel for your ascent.Use these PowerPoint slides for presentations relating to Business team studying statistics in a meeting, business, people, finance, marketing, success. The prominent colors used in the PowerPoint template are Blue, Gray, Black. Face up to any adversity with our Statistical Business Meeting PowerPoint Templates Ppt Backgrounds For Slides 0213. They will help your ideas dominate.
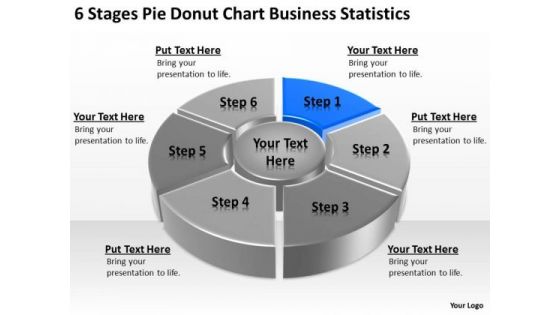
Business PowerPoint Theme Statistics Property Management Plan Slides
We present our business powerpoint theme statistics property management plan Slides.Use our Communication PowerPoint Templates because Our PowerPoint Templates and Slides are effectively colour coded to prioritise your plans They automatically highlight the sequence of events you desire. Use our Finance PowerPoint Templates because Our PowerPoint Templates and Slides will Embellish your thoughts. They will help you illustrate the brilliance of your ideas. Present our Business PowerPoint Templates because You can Channelise the thoughts of your team with our PowerPoint Templates and Slides. Urge them to focus on the goals you have set. Use our Circle Charts PowerPoint Templates because You have gained great respect for your brilliant ideas. Use our PowerPoint Templates and Slides to strengthen and enhance your reputation. Download and present our Shapes PowerPoint Templates because Our PowerPoint Templates and Slides will let you Hit the right notes. Watch your audience start singing to your tune.Use these PowerPoint slides for presentations relating to Chart, wheel, pie, graph, vector, process, marketing, diagram, business, catalog, website, network, statistics, model, document, junction, plan, presentation, template, circle, brochure, data, stock, management, box, options, direction, design, company, navigation, financial, structure, button, goals, results. The prominent colors used in the PowerPoint template are Blue, Black, Gray. Our Business PowerPoint Theme Statistics Property Management Plan Slides are able catalysts. They will churn your thoughts and extract good plans.
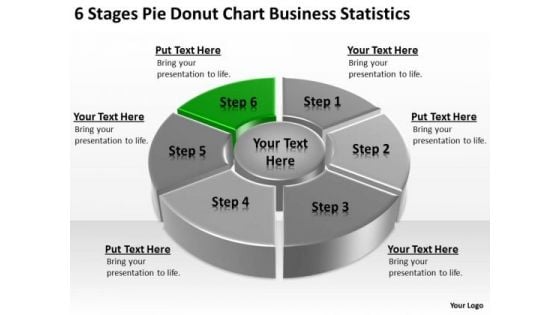
Chart Free Business PowerPoint Templates Statistics Ppt Subway Plan Slides
We present our chart free business powerpoint templates statistics ppt subway plan Slides.Download our Success PowerPoint Templates because Our PowerPoint Templates and Slides will let you Hit the target. Go the full distance with ease and elan. Download and present our Finance PowerPoint Templates because Our PowerPoint Templates and Slides are aesthetically designed to attract attention. We gaurantee that they will grab all the eyeballs you need. Present our Arrows PowerPoint Templates because It will Raise the bar of your Thoughts. They are programmed to take you to the next level. Download and present our Circle Charts PowerPoint Templates because Our PowerPoint Templates and Slides are created by a hardworking bunch of busybees. Always flitting around with solutions gauranteed to please. Present our Business PowerPoint Templates because Our PowerPoint Templates and Slides will let you Hit the right notes. Watch your audience start singing to your tune.Use these PowerPoint slides for presentations relating to Chart, wheel, pie, graph, vector, process, marketing, diagram, business, catalog, website, network, statistics, model, document, junction, plan, presentation, template, circle, brochure, data, stock, management, box, options, direction, design, company, navigation, financial, structure, button, goals, results. The prominent colors used in the PowerPoint template are Green, Black, Gray. Enthuse your audience with our Chart Free Business PowerPoint Templates Statistics Ppt Subway Plan Slides. You will come out on top.
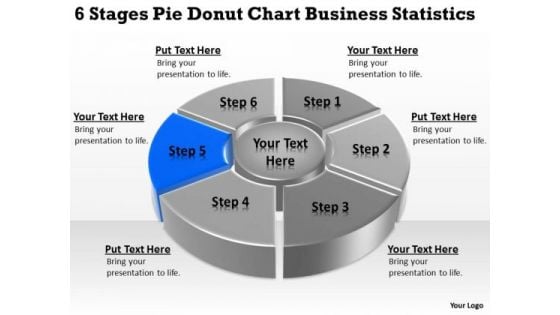
Templates Free Download Statistics Startup Business Plan Outline PowerPoint
We present our templates free download statistics startup business plan outline PowerPoint.Download our Process and Flows PowerPoint Templates because It can be used to Set your controls for the heart of the sun. Our PowerPoint Templates and Slides will be the propellant to get you there. Download our Circle Charts PowerPoint Templates because Our PowerPoint Templates and Slides will steer your racing mind. Hit the right buttons and spur on your audience. Present our Marketing PowerPoint Templates because You can Raise a toast with our PowerPoint Templates and Slides. Spread good cheer amongst your audience. Present our Flow Charts PowerPoint Templates because You can Double your output with our PowerPoint Templates and Slides. They make beating deadlines a piece of cake. Use our Business PowerPoint Templates because You can Rise to the occasion with our PowerPoint Templates and Slides. You will bring your audience on their feet in no time.Use these PowerPoint slides for presentations relating to Infographic, graph, chart, data, icon, diagram, progress, bar, line, download, button, pie, search, time, statistics, percent, segment, cloud, business, concept, sign,loading, symbol, template, circle, graphic, modern, status, visualization, roundabstract, management, mba, manage, illustration, weakness, strategy, project, clipart, guidelines, direction, design, organization, commerce, conceptual,heirarchy, resource, theoretical, action, goals, performance. The prominent colors used in the PowerPoint template are Blue, Gray, White. Display your class with our Templates Free Download Statistics Startup Business Plan Outline PowerPoint. Demonstrate your expertise to your audience.

13 8 Level Structured Communication Delphi Method Ppt PowerPoint Presentation Graphics
This is a 13 8 level structured communication delphi method ppt powerpoint presentation graphics. This is a eight stage process. The stages in this process are participants comment on each others ideas and propose a final judgment, leader looks for consensus, leader accepts consensus judgment as groups choice, leader identifies judgment issues and develops questionnaire, prospective participants are identified and asked to cooperate, leaders send questionnaire to willing participants who record their judgments and recommendations and return the questionnaire.
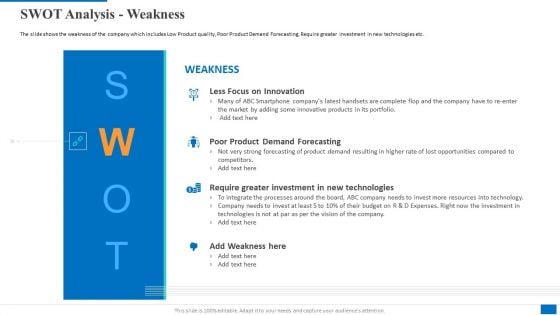
SWOT Analysis Weakness Information PDF
This is a swot analysis weakness information pdf template with various stages. Focus and dispense information on four stages using this creative set, that comes with editable features. It contains large content boxes to add your information on topics like less focus on innovation, poor product demand forecasting, require greater investment in new technologies. You can also showcase facts, figures, and other relevant content using this PPT layout. Grab it now.
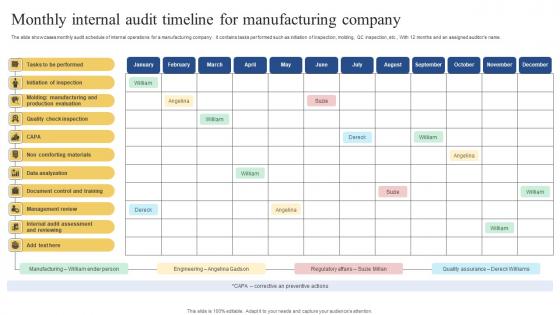
Monthly Internal Audit Timeline For Manufacturing Company Pictures Pdf
The slide showcases monthly audit schedule of internal operations for a manufacturing company . it contains tasks performed such as initiation of inspection, molding, QC inspection, etc., With 12 months and an assigned auditors name. Pitch your topic with ease and precision using this Monthly Internal Audit Timeline For Manufacturing Company Pictures Pdf. This layout presents information on Initiation Of Inspection, Quality Check Inspection, Non Comforting Materials. It is also available for immediate download and adjustment. So, changes can be made in the color, design, graphics or any other component to create a unique layout. The slide showcases monthly audit schedule of internal operations for a manufacturing company . it contains tasks performed such as initiation of inspection, molding, QC inspection, etc., With 12 months and an assigned auditors name.
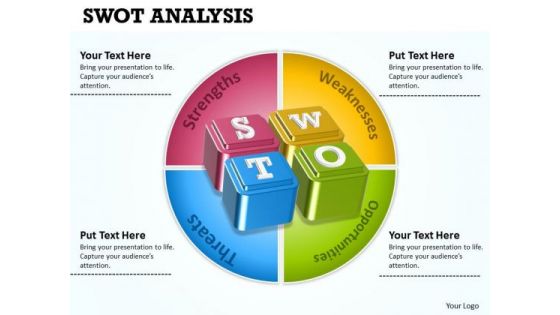
Strategic Management Swot Analysis Mba Models And Frameworks
Edit Your Work With Our Strategic Management Swot Analysis Mba Models And Frameworks Powerpoint Templates. They Will Help You Give The Final Form.
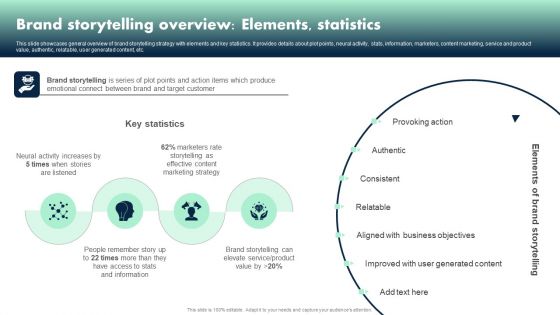
Apple Emotional Marketing Strategy Brand Storytelling Overview Elements Statistics Professional PDF
This slide showcases general overview of brand storytelling strategy with elements and key statistics. It provides details about plot points, neural activity, stats, information, marketers, content marketing, service and product value, authentic, relatable, user generated content, etc. If you are looking for a format to display your unique thoughts, then the professionally designed Apple Emotional Marketing Strategy Brand Storytelling Overview Elements Statistics Professional PDF is the one for you. You can use it as a Google Slides template or a PowerPoint template. Incorporate impressive visuals, symbols, images, and other charts. Modify or reorganize the text boxes as you desire. Experiment with shade schemes and font pairings. Alter, share or cooperate with other people on your work. Download Apple Emotional Marketing Strategy Brand Storytelling Overview Elements Statistics Professional PDF and find out how to give a successful presentation. Present a perfect display to your team and make your presentation unforgettable.
Ten Stages Of Business Process With Icons And Text Holders Ppt PowerPoint Presentation Infographic Template Example Topics
This is a ten stages of business process with icons and text holders ppt powerpoint presentation infographic template example topics. This is a ten stage process. The stages in this process are 12 bullet points, 12 points, 12 points checklist.

Online And Offline Market Analysis Techniques Slides PDF
This slide provides an overview of the qualitative and quantitative techniques used to analyze the market and understand the audience. The techniques covered are online interviews, email questionnaires, visual data, focus groups, secondary data, etc. From laying roadmaps to briefing everything in detail, our templates are perfect for you. You can set the stage with your presentation slides. All you have to do is download these easy to edit and customizable templates. Online And Offline Market Analysis Techniques Slides PDF will help you deliver an outstanding performance that everyone would remember and praise you for. Do download this presentation today.
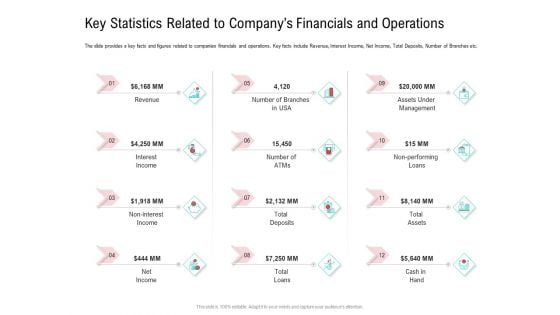
Key Statistics Related To Companys Financials And Operations Professional PDF
The slide provides a key facts and figures related to companies financials and operations. Key facts include Revenue, Interest Income, Net Income, Total Deposits, Number of Branches etc. Deliver and pitch your topic in the best possible manner with this key statistics related to companys financials and operations professional pdf. Use them to share invaluable insights on revenue, interest income, net income, assets under management, total assets and impress your audience. This template can be altered and modified as per your expectations. So, grab it now.
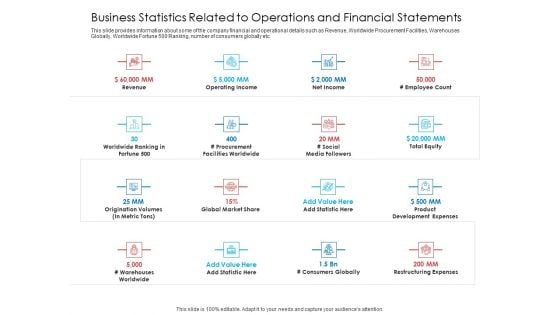
Business Statistics Related To Operations And Financial Statements Background PDF
This slide provides information about some of the company financial and operational details such as Revenue, Worldwide Procurement Facilities, Warehouses Globally, Worldwide Fortune 500 Ranking, number of consumers globally etc. Deliver an awe-inspiring pitch with this creative business statistics related to operations and financial statements background pdf bundle. Topics like operating income, revenue, net income, product development expenses, global market share can be discussed with this completely editable template. It is available for immediate download depending on the needs and requirements of the user.

Key Statistics And Facts Of Our Company Graphics PDF
The slide provides a key facts of the company including total revenue, number of online users, number of transactions, operating cost etc. This is a key statistics and facts of our company graphics pdf template with various stages. Focus and dispense information on five stages using this creative set, that comes with editable features. It contains large content boxes to add your information on topics like revenue, operating cost, number of online cryptocurrency. You can also showcase facts, figures, and other relevant content using this PPT layout. Grab it now.
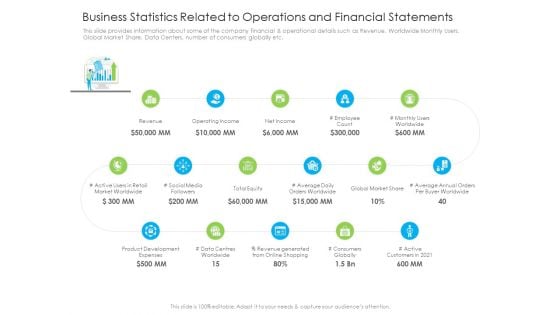
Business Statistics Related To Operations And Financial Statements Mockup PDF
This slide provides information about some of the company financial and operational details such as Revenue, Worldwide Monthly Users, Global Market Share, Data Centers, number of consumers globally etc. Deliver and pitch your topic in the best possible manner with this business statistics related to operations and financial statements mockup pdf. Use them to share invaluable insights on revenue, operating income, net income, global market share, social media and impress your audience. This template can be altered and modified as per your expectations. So, grab it now.
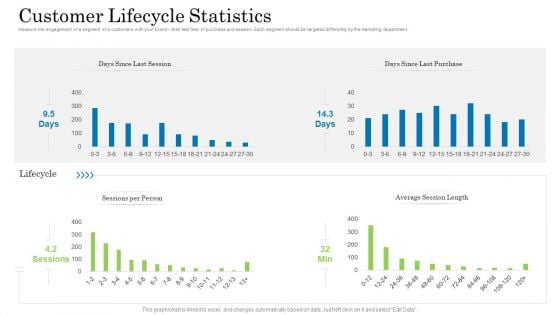
Customer Behavioral Data And Analytics Customer Lifecycle Statistics Elements PDF
Measure the engagement of a segment of a customers with your brand their last time of purchase and session. Each segment should be targeted differently by the marketing department. Deliver an awe inspiring pitch with this creative customer behavioral data and analytics customer lifecycle statistics elements pdf bundle. Topics like days since last session, days since last purchase, sessions per person, average session length can be discussed with this completely editable template. It is available for immediate download depending on the needs and requirements of the user.
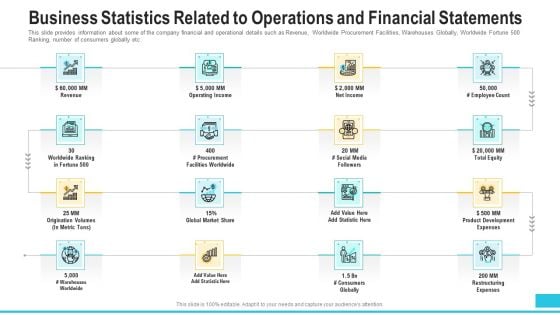
Business Statistics Related To Operations And Financial Statements Ideas PDF
This slide provides information about some of the company financial and operational details such as Revenue, Worldwide Procurement Facilities, Warehouses Globally, Worldwide Fortune 500 Ranking, number of consumers globally etc. This is a business statistics related to operations and financial statements ideas pdf template with various stages. Focus and dispense information on tweleve stages using this creative set, that comes with editable features. It contains large content boxes to add your information on topics like revenue, operating income, net income, employee count, social media. You can also showcase facts, figures, and other relevant content using this PPT layout. Grab it now.
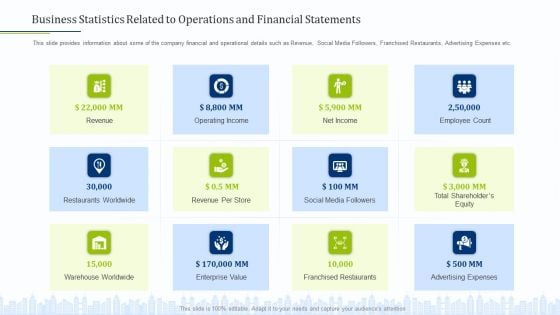
Business Statistics Related To Operations And Financial Statements Infographics PDF
This slide provides information about some of the company financial and operational details such as Revenue, Social Media Followers, Franchised Restaurants, Advertising Expenses etc.Presenting business statistics related to operations and financial statements infographics pdf to provide visual cues and insights. Share and navigate important information on twavle stages that need your due attention. This template can be used to pitch topics like operating income, employee count, restaurants worldwide, revenue per store, enterprise value. In addtion, this PPT design contains high resolution images, graphics, etc, that are easily editable and available for immediate download.
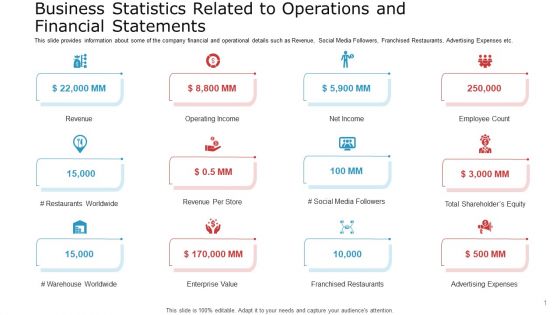
Business Statistics Related To Operations And Financial Statements Introduction PDF
This slide provides information about some of the company financial and operational details such as Revenue, Social Media Followers, Franchised Restaurants, Advertising Expenses etc.Presenting business statistics related to operations and financial statements introduction pdf to provide visual cues and insights. Share and navigate important information on twalve stages that need your due attention. This template can be used to pitch topics like operating income, employee count, total shareholders equity. In addtion, this PPT design contains high resolution images, graphics, etc, that are easily editable and available for immediate download.
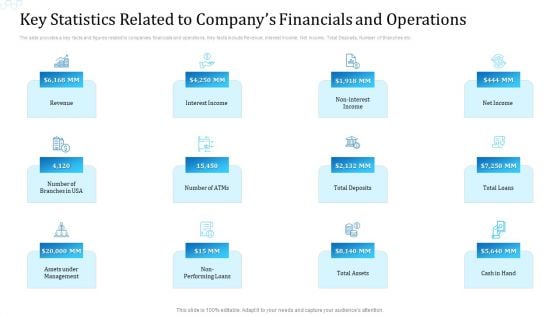
Key Statistics Related To Companys Financials And Operations Ideas PDF
The slide provides a key facts and figures related to companies financials and operations. Key facts include Revenue, Interest Income, Net Income, Total Deposits, Number of Branches etc. Presenting key statistics related to companys financials and operations ideas pdf to provide visual cues and insights. Share and navigate important information on twelve stages that need your due attention. This template can be used to pitch topics like interest income, cash in hand, net income, assets under management. In addtion, this PPT design contains high resolution images, graphics, etc, that are easily editable and available for immediate download.
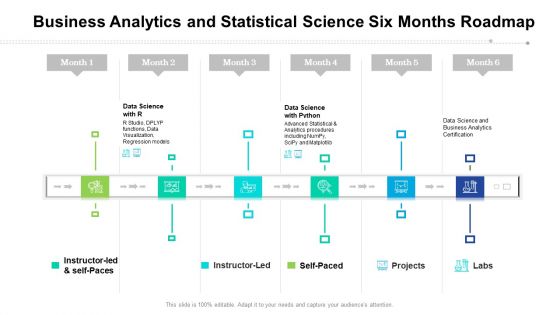
Business Analytics And Statistical Science Six Months Roadmap Designs
Presenting the business analytics and statistical science six months roadmap designs. The template includes a roadmap that can be used to initiate a strategic plan. Not only this, the PowerPoint slideshow is completely editable and you can effortlessly modify the font size, font type, and shapes according to your needs. This PPT slide can be easily reached in standard screen and widescreen aspect ratios. The set is also available in various formats like PDF, PNG, and JPG. So download and use it multiple times as per your knowledge.
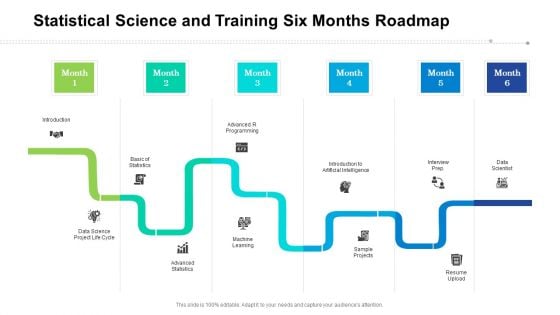
Statistical Science And Training Six Months Roadmap Slides
Presenting the statistical science and training six months roadmap slides. The template includes a roadmap that can be used to initiate a strategic plan. Not only this, the PowerPoint slideshow is completely editable and you can effortlessly modify the font size, font type, and shapes according to your needs. This PPT slide can be easily reached in standard screen and widescreen aspect ratios. The set is also available in various formats like PDF, PNG, and JPG. So download and use it multiple times as per your knowledge.
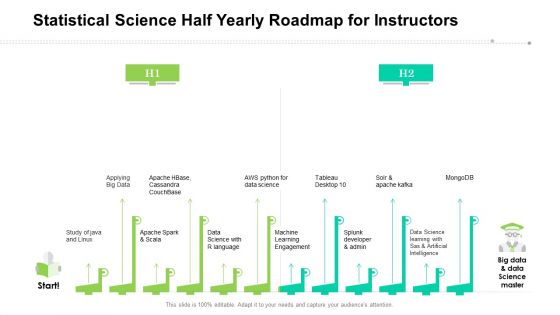
Statistical Science Half Yearly Roadmap For Instructors Summary
Presenting the statistical science half yearly roadmap for instructors summary. The template includes a roadmap that can be used to initiate a strategic plan. Not only this, the PowerPoint slideshow is completely editable and you can effortlessly modify the font size, font type, and shapes according to your needs. This PPT slide can be easily reached in standard screen and widescreen aspect ratios. The set is also available in various formats like PDF, PNG, and JPG. So download and use it multiple times as per your knowledge.
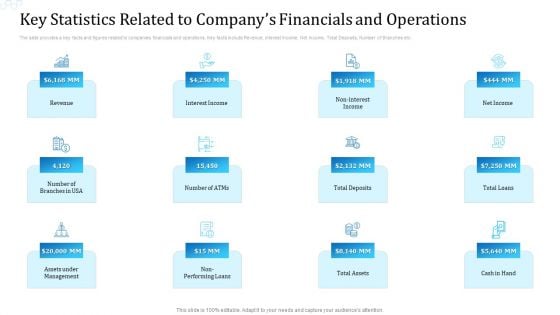
Key Statistics Related To Companys Financials And Operations Diagrams PDF
The slide provides a key facts and figures related to companies financials and operations. Key facts include Revenue, Interest Income, Net Income, Total Deposits, Number of Branches etc. This is a key statistics related to companys financials and operations diagrams pdf template with various stages. Focus and dispense information on twelve stages using this creative set, that comes with editable features. It contains large content boxes to add your information on topics like revenue, interest income, net income, loans. You can also showcase facts, figures, and other relevant content using this PPT layout. Grab it now.
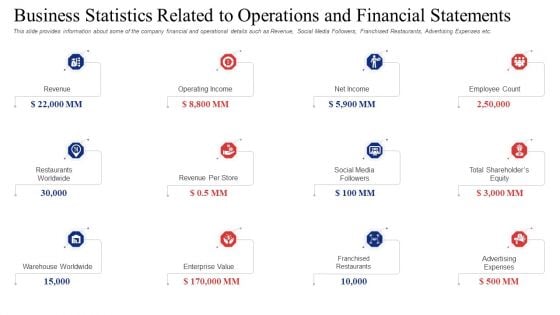
Business Statistics Related To Operations And Financial Statements Sample PDF
This slide provides information about some of the company financial and operational details such as Revenue, Social Media Followers, Franchised Restaurants, Advertising Expenses etc.This is a business statistics related to operations and financial statements sample pdf template with various stages. Focus and dispense information on twalve stages using this creative set, that comes with editable features. It contains large content boxes to add your information on topics like restaurants worldwide, warehouse worldwide, operating income. You can also showcase facts, figures, and other relevant content using this PPT layout. Grab it now.
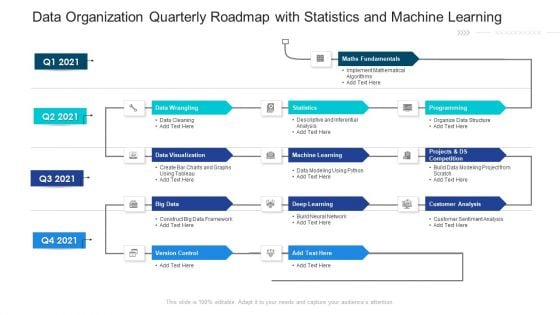
Data Organization Quarterly Roadmap With Statistics And Machine Learning Formats
Presenting the data organization quarterly roadmap with statistics and machine learning formats. The template includes a roadmap that can be used to initiate a strategic plan. Not only this, the PowerPoint slideshow is completely editable and you can effortlessly modify the font size, font type, and shapes according to your needs. This PPT slide can be easily reached in standard screen and widescreen aspect ratios. The set is also available in various formats like PDF, PNG, and JPG. So download and use it multiple times as per your knowledge.
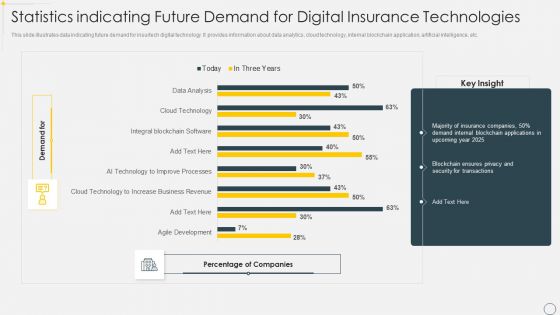
Statistics Indicating Future Demand For Digital Insurance Technologies Brochure PDF
This slide illustrates data indicating future demand for insurtech digital technology. It provides information about data analytics, cloud technology, internal blockchain application, artificial intelligence, etc. Pitch your topic with ease and precision using this Statistics Indicating Future Demand For Digital Insurance Technologies Brochure PDF. This layout presents information on Data Analytics, Cloud Technology, Internal Blockchain Application. It is also available for immediate download and adjustment. So, changes can be made in the color, design, graphics or any other component to create a unique layout.
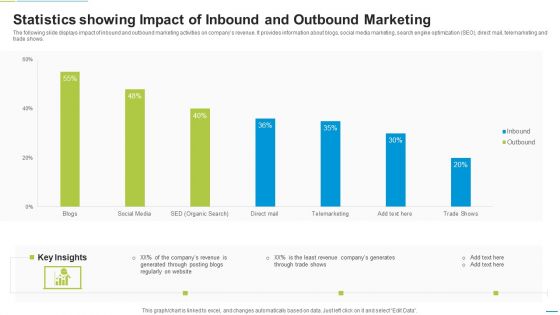
Statistics Showing Impact Of Inbound And Outbound Marketing Diagrams PDF
The following slide displays impact of inbound and outbound marketing activities on companys revenue. It provides information about blogs, social media marketing, search engine optimization SEO, direct mail, telemarketing and trade shows. Pitch your topic with ease and precision using this Statistics Showing Impact Of Inbound And Outbound Marketing Diagrams PDF. This layout presents information on Telemarketing, Social Media, Blogs. It is also available for immediate download and adjustment. So, changes can be made in the color, design, graphics or any other component to create a unique layout.
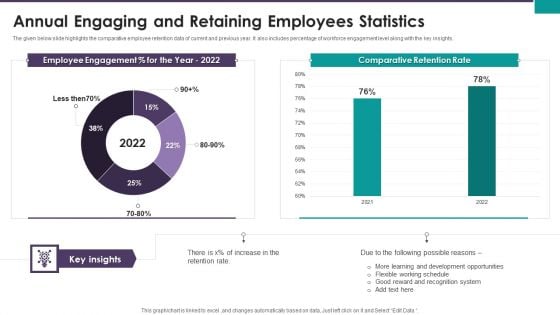
Annual Engaging And Retaining Employees Statistics Ppt Styles Example PDF
The given below slide highlights the comparative employee retention data of current and previous year. It also includes percentage of workforce engagement level along with the key insights. Showcasing this set of slides titled Annual Engaging And Retaining Employees Statistics Ppt Styles Example PDF. The topics addressed in these templates are Employee Engagement Percent, Comparative Retention Rate. All the content presented in this PPT design is completely editable. Download it and make adjustments in color, background, font etc. as per your unique business setting.
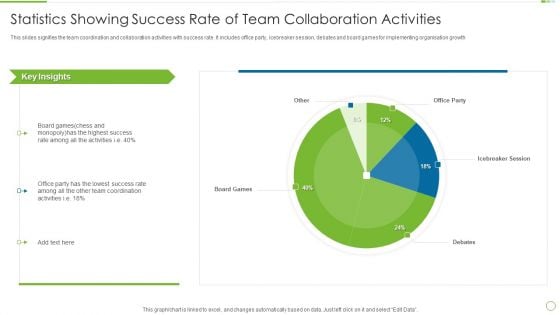
Statistics Showing Success Rate Of Team Collaboration Activities Information PDF
This slides signifies the team coordination and collaboration activities with success rate. It includes office party, icebreaker session, debates and board games for implementing organisation growth. Pitch your topic with ease and precision using this Statistics Showing Success Rate Of Team Collaboration Activities Information PDF This layout presents information on Highest Success, Lowest Success, Team Coordination It is also available for immediate download and adjustment. So, changes can be made in the color, design, graphics or any other component to create a unique layout.
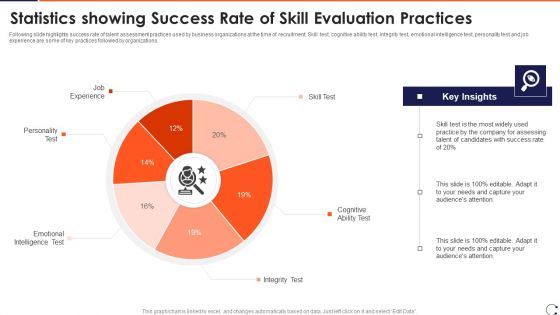
Statistics Showing Success Rate Of Skill Evaluation Practices Topics PDF
Following slide highlights success rate of talent assessment practices used by business organizations at the time of recruitment. Skill test, cognitive ability test, integrity test, emotional intelligence test, personality test and job experience are some of key practices followed by organizations.Pitch your topic with ease and precision using this Statistics Showing Success Rate Of Skill Evaluation Practices Topics PDF This layout presents information on Emotional Intelligence, Test Cognitive, Personality Test It is also available for immediate download and adjustment. So, changes can be made in the color, design, graphics or any other component to create a unique layout.
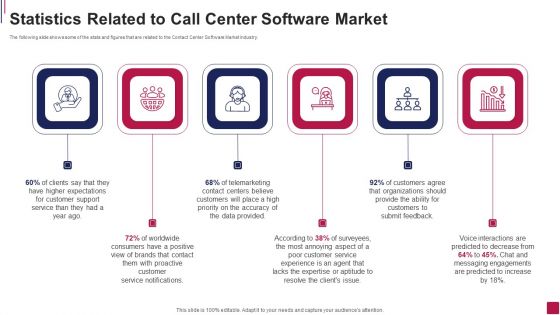
Statistics Related To Call Center Software Market Pictures PDF
The following slide shows some of the stats and figures that are related to the Contact Center Software Market Industry. This is a Statistics Related To Call Center Software Market Pictures PDF template with various stages. Focus and dispense information on six stages using this creative set, that comes with editable features. It contains large content boxes to add your information on topics like Higher Expectations, Customer Support, Telemarketing Contact You can also showcase facts, figures, and other relevant content using this PPT layout. Grab it now.

Statistics Of The CPS Provider Company Ppt Slide PDF
This slide represents the strengths of the CPS company, and it includes the total amount of annual employee donations, volunteer hours, community ambassadors, and 24 into 7 support. Presenting Statistics Of The CPS Provider Company Ppt Slide PDF to provide visual cues and insights. Share and navigate important information on six stages that need your due attention. This template can be used to pitch topics like Customer Satisfaction, Team, Quality. In addtion, this PPT design contains high resolution images, graphics, etc, that are easily editable and available for immediate download.

Home Insurance Analytics Statistics With Settlement Time Dashboard Ideas PDF
This slide illustrates home insurance facts and figures of the organization. It includes monthly claim volume, claim status, average notification time, acknowledged time, decision time etc. Pitch your topic with ease and precision using this Home Insurance Analytics Statistics With Settlement Time Dashboard Ideas PDF. This layout presents information on Average Acknowledged Time, Average Decision Time, Average Lead Time. It is also available for immediate download and adjustment. So, changes can be made in the color, design, graphics or any other component to create a unique layout.
Company Inward Marketing Strategy Key Barriers Statistics Icons PDF
This slide covers top challenges of inbound marketing strategy that reduces its effectiveness. It includes generation of traffic, proving ROI for marketing activities, securing budget, technology update, website management, hiring talent and training team.Pitch your topic with ease and precision using this Company Inward Marketing Strategy Key Barriers Statistics Icons PDF. This layout presents information on Difficult To Search, Insufficient Traffic, Setting Budget. It is also available for immediate download and adjustment. So, changes can be made in the color, design, graphics or any other component to create a unique layout.
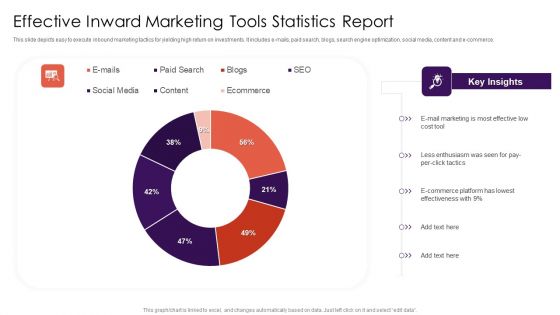
Effective Inward Marketing Tools Statistics Report Structure PDF
This slide depicts easy to execute inbound marketing tactics for yielding high return on investments. It includes e-mails, paid search, blogs, search engine optimization, social media, content and e-commerce.Showcasing this set of slides titled Effective Inward Marketing Tools Statistics Report Structure PDF. The topics addressed in these templates are E Commerce Platform, E Mail Marketing, Social Media. All the content presented in this PPT design is completely editable. Download it and make adjustments in color, background, font etc. as per your unique business setting.
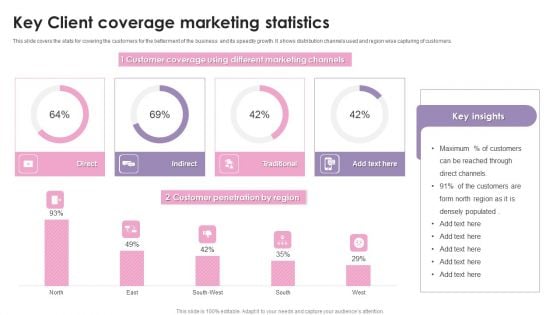
Key Client Coverage Marketing Statistics Ppt Inspiration Design Inspiration PDF
This slide covers the stats for covering the customers for the betterment of the business and its speedily growth. It shows distribution channels used and region wise capturing of customers. Pitch your topic with ease and precision using this Key Client Coverage Marketing Statistics Ppt Inspiration Design Inspiration PDF. This layout presents information on Customer Penetration, Traditional, Indirect, Direct. It is also available for immediate download and adjustment. So, changes can be made in the color, design, graphics or any other component to create a unique layout.
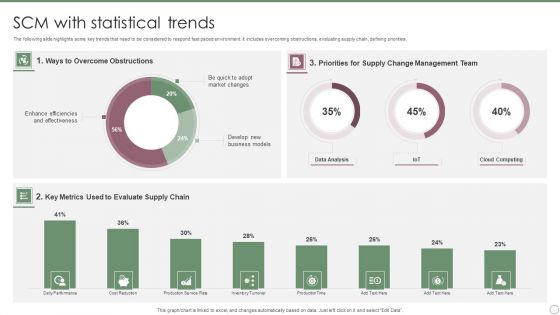
SCM With Statistical Trends Ppt PowerPoint Presentation Gallery Examples PDF
The following slide highlights some key trends that need to be considered to respond fast paced environment. It includes overcoming obstructions, evaluating supply chain, defining priorities. Pitch your topic with ease and precision using this SCM With Statistical Trends Ppt PowerPoint Presentation Gallery Examples PDF. This layout presents information on Ways To Overcome, Obstructions, Key Metrics, Evaluate Supply Chain. It is also available for immediate download and adjustment. So, changes can be made in the color, design, graphics or any other component to create a unique layout.
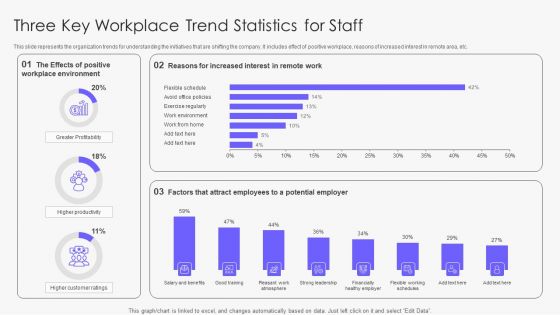
Three Key Workplace Trend Statistics For Staff Slides PDF
This slide represents the organization trends for understanding the initiatives that are shifting the company. It includes effect of positive workplace, reasons of increased interest in remote area, etc. Pitch your topic with ease and precision using this Three Key Workplace Trend Statistics For Staff Slides PDF. This layout presents information on Workplace Environment, Greater Profitability, Customer. It is also available for immediate download and adjustment. So, changes can be made in the color, design, graphics or any other component to create a unique layout.
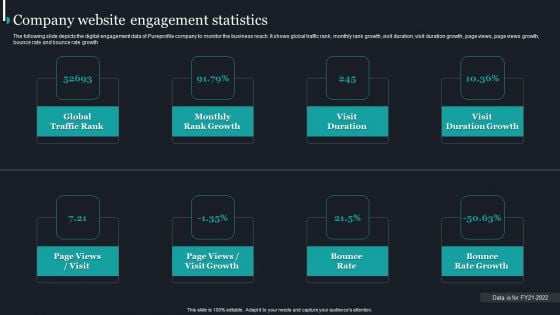
Pureprofile Business Overview Company Website Engagement Statistics Elements PDF
The following slide depicts the digital engagement data of Pureprofile company to monitor the business reach. It shows global traffic rank, monthly rank growth, visit duration, visit duration growth, page views, page views growth, bounce rate and bounce rate growthThis is a Pureprofile Business Overview Company Website Engagement Statistics Elements PDF template with various stages. Focus and dispense information on eight stages using this creative set, that comes with editable features. It contains large content boxes to add your information on topics like Global Traffic Rank, Monthly Rank Growth, Visit Duration. You can also showcase facts, figures, and other relevant content using this PPT layout. Grab it now.
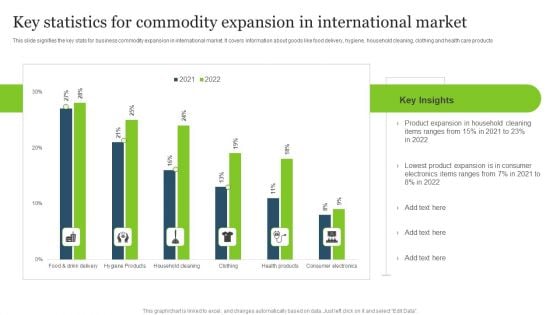
Key Statistics For Commodity Expansion In International Market Pictures PDF
This slide signifies the key stats for business commodity expansion in international market. It covers information about goods like food delivery, hygiene, household cleaning, clothing and health care products.Pitch your topic with ease and precision using this Key Statistics For Commodity Expansion In International Market Pictures PDF. This layout presents information on Product Expansion, Household Cleaning, Items Ranges. It is also available for immediate download and adjustment. So, changes can be made in the color, design, graphics or any other component to create a unique layout.


 Continue with Email

 Home
Home


