Technology Infographic
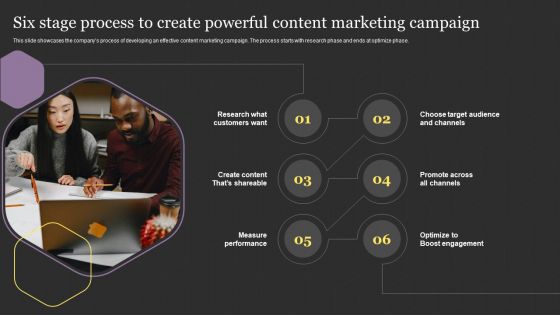
Successful Content Promotion Guide Six Stage Process To Create Powerful Content Marketing Campaign Infographics PDF
This slide showcases the companys process of developing an effective content marketing campaign. The process starts with research phase and ends at optimize phase. This is a Successful Content Promotion Guide Six Stage Process To Create Powerful Content Marketing Campaign Infographics PDF template with various stages. Focus and dispense information on six stages using this creative set, that comes with editable features. It contains large content boxes to add your information on topics like Promote Across All Channels, Optimize To Boost Engagement, Choose Target Audience Channels. You can also showcase facts, figures, and other relevant content using this PPT layout. Grab it now.
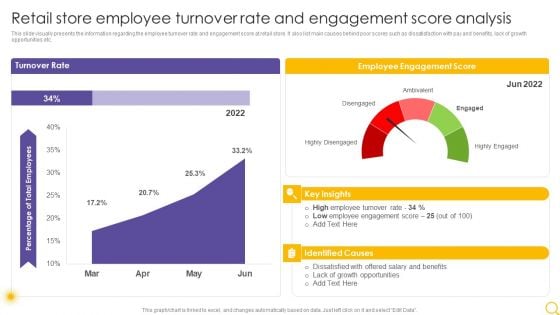
Retail Outlet Operational Efficiency Analytics Retail Store Employee Turnover Rate And Engagement Infographics PDF
This slide visually presents the information regarding the employee turnover rate and engagement score at retail store. It also list main causes behind poor scores such as dissatisfaction with pay and benefits, lack of growth opportunities etc. Deliver an awe inspiring pitch with this creative Retail Outlet Operational Efficiency Analytics Retail Store Employee Turnover Rate And Engagement Infographics PDF bundle. Topics like Turnover Rate, Employee Engagement Score, Identified Causes can be discussed with this completely editable template. It is available for immediate download depending on the needs and requirements of the user.
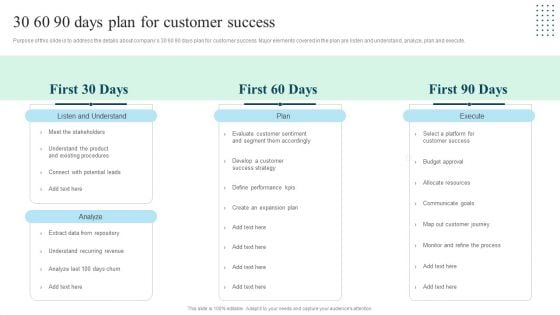
Client Success Playbook 30 60 90 Days Plan For Customer Success Infographics PDF
Purpose of this slide is to address the details about companys 30 60 90 days plan for customer success. Major elements covered in the plan are listen and understand, analyze, plan and execute. This is a Client Success Playbook 30 60 90 Days Plan For Customer Success Infographics PDF template with various stages. Focus and dispense information on three stages using this creative set, that comes with editable features. It contains large content boxes to add your information on topics like Listen And Understand, Execute, Plan. You can also showcase facts, figures, and other relevant content using this PPT layout. Grab it now.

Fraud Avoidance Playbook Addressing The Practices To Protect Business Against Fraud Infographics PDF
Purpose of this slide is to portray the existing ways of protecting business from fraud events such as WIFI hacking, business email compromise scams, and ransomware. This is a Fraud Avoidance Playbook Addressing The Practices To Protect Business Against Fraud Infographics PDF template with various stages. Focus and dispense information on three stages using this creative set, that comes with editable features. It contains large content boxes to add your information on topics like The Wi Fi Crack, Business Email Compromise Scams, Ransomware. You can also showcase facts, figures, and other relevant content using this PPT layout. Grab it now.

Kpis To Measure International Growth Performance Ppt Infographics Graphic Tips PDF
This slide shows various KPIs which can be used to evaluate international growth performance. It includes revenue, e-commerce conversion rate, cost per acquisition, bounce rate, etc. Pitch your topic with ease and precision using this Kpis To Measure International Growth Performance Ppt Infographics Graphic Tips PDF. This layout presents information on Revenue, Cost Per Acquisition, Bounce Rate. It is also available for immediate download and adjustment. So, changes can be made in the color, design, graphics or any other component to create a unique layout.
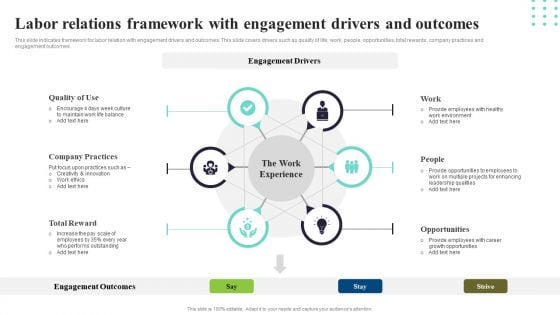
Labor Relations Framework With Engagement Drivers And Outcomes Ppt PowerPoint Presentation File Infographics PDF
This slide indicates framework for labor relation with engagement drivers and outcomes. This slide covers drivers such as quality of life, work, people, opportunities, total rewards, company practices and engagement outcomes. Persuade your audience using this Labor Relations Framework With Engagement Drivers And Outcomes Ppt PowerPoint Presentation File Infographics PDF. This PPT design covers six stages, thus making it a great tool to use. It also caters to a variety of topics including Engagement Drivers, Engagement Outcomes, Total Reward. Download this PPT design now to present a convincing pitch that not only emphasizes the topic but also showcases your presentation skills.
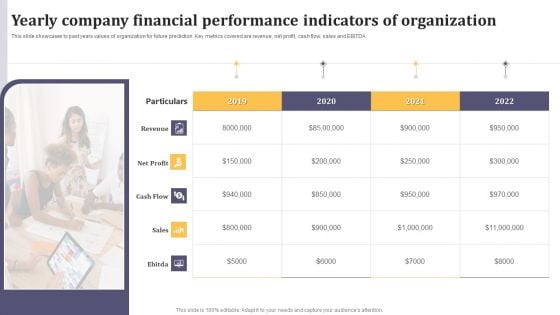
Yearly Company Financial Performance Indicators Of Organization Ppt Infographics Outline PDF
This slide showcases to past years values of organization for future prediction. Key metrics covered are revenue, net profit, cash flow, sales and EBITDA. Persuade your audience using this Yearly Company Financial Performance Indicators Of Organization Ppt Infographics Outline PDF. This PPT design covers five stages, thus making it a great tool to use. It also caters to a variety of topics including Revenue, Net Profit, Cash Flow. Download this PPT design now to present a convincing pitch that not only emphasizes the topic but also showcases your presentation skills.

B2B Effective Sales And Promotion Strategies Ppt PowerPoint Presentation Infographics Slides PDF
The following slide highlights the key sales and marketing techniques to improve sales and enhance market share. It includes strategies such as sample products SEO, online promotions, promotional merchandising, tradeShowcasing this set of slides titled B2B Effective Sales And Promotion Strategies Ppt PowerPoint Presentation Infographics Slides PDF. The topics addressed in these templates are Promotional Merchandising, Sample Products, Online Promotions. All the content presented in this PPT design is completely editable. Download it and make adjustments in color, background, font etc. as per your unique business setting.
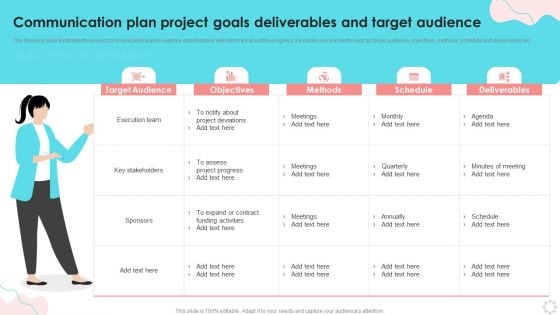
Communication Plan Project Goals Deliverables And Target Audience Ppt PowerPoint Presentation Infographics Styles PDF
The following slide illustrates the project communication plan to keep the stakeholders well informed about the progress. It includes key elements such as target audience, objectives, methods, schedule and deliverables etc.Showcasing this set of slides titled Communication Plan Project Goals Deliverables And Target Audience Ppt PowerPoint Presentation Infographics Styles PDF. The topics addressed in these templates are Execution Team, Project Deviations, Minutes Meeting. All the content presented in this PPT design is completely editable. Download it and make adjustments in color, background, font etc. as per your unique business setting.
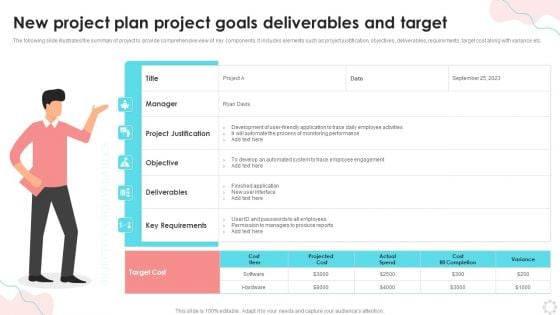
New Project Plan Project Goals Deliverables And Target Ppt PowerPoint Presentation Infographics Graphics Download PDF
The following slide illustrates the summary of project to provide comprehensive view of key components. It includes elements such as project justification, objectives, deliverables, requirements, target cost along with variance etc. Showcasing this set of slides titled New Project Plan Project Goals Deliverables And Target Ppt PowerPoint Presentation Infographics Graphics Download PDF. The topics addressed in these templates are Monitoring Performance, Key Requirements, Permission Managers. All the content presented in this PPT design is completely editable. Download it and make adjustments in color, background, font etc. as per your unique business setting.

5S Lean Production Strategies Audit Sheet For Safety Ppt Infographics Graphics Template PDF
This slide defines the 5s lean safety audit sheet for an organization. It includes information related observations, remarks and suggestions along with the scores. Pitch your topic with ease and precision using this 5S Lean Production Strategies Audit Sheet For Safety Ppt Infographics Graphics Template PDF. This layout presents information on Remarks And Suggestion, Safety Equipment, Extinguishers Available. It is also available for immediate download and adjustment. So, changes can be made in the color, design, graphics or any other component to create a unique layout.
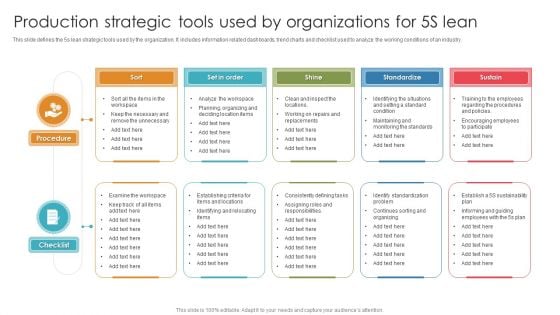
Production Strategic Tools Used By Organizations For 5S Lean Ppt Infographics Microsoft PDF
This slide defines the 5s lean strategic tools used by the organization. It includes information related dashboards, trend charts and checklist used to analyze the working conditions of an industry. Pitch your topic with ease and precision using this Production Strategic Tools Used By Organizations For 5S Lean Ppt Infographics Microsoft PDF. This layout presents information on Procedure, Checklist, Standardize. It is also available for immediate download and adjustment. So, changes can be made in the color, design, graphics or any other component to create a unique layout.
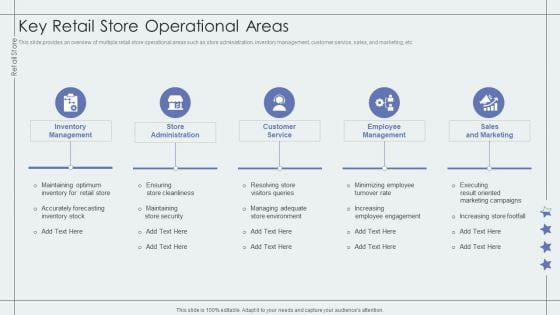
Key Retail Store Operational Areas Retail Outlet Performance Assessment Infographics PDF
This slide provides an overview of multiple retail store operational areas such as store administration, inventory management, customer service, sales, and marketing, etc. This is a Key Retail Store Operational Areas Retail Outlet Performance Assessment Infographics PDF template with various stages. Focus and dispense information on five stages using this creative set, that comes with editable features. It contains large content boxes to add your information on topics like Inventory Management, Store Administration, Customer Service. You can also showcase facts, figures, and other relevant content using this PPT layout. Grab it now.
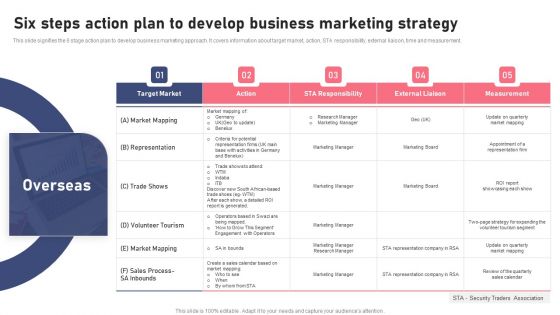
Six Steps Action Plan To Develop Business Marketing Strategy Ppt Infographics Templates PDF
This slide signifies the 6 stage action plan to develop business marketing approach. It covers information about target market, action, STA responsibility, external liaison, time and measurement. Showcasing this set of slides titled Six Steps Action Plan To Develop Business Marketing Strategy Ppt Infographics Templates PDF. The topics addressed in these templates are Target Market, Action, STA Responsibility. All the content presented in this PPT design is completely editable. Download it and make adjustments in color, background, font etc. as per your unique business setting.
Comparative Assessment Of Block Chain Enabled Altcoins Vs Fiat Currencies Ppt Infographics Icons PDF
This slide covers difference between crypto and fiat currencies as medium of exchanges. It includes comparison based on intermediary requirements, block chain enablement, control, circulation, etc. Pitch your topic with ease and precision using this Comparative Assessment Of Block Chain Enabled Altcoins Vs Fiat Currencies Ppt Infographics Icons PDF. This layout presents information on Cryptocurrencies, Fiat Currencies, Decentralized Control. It is also available for immediate download and adjustment. So, changes can be made in the color, design, graphics or any other component to create a unique layout.
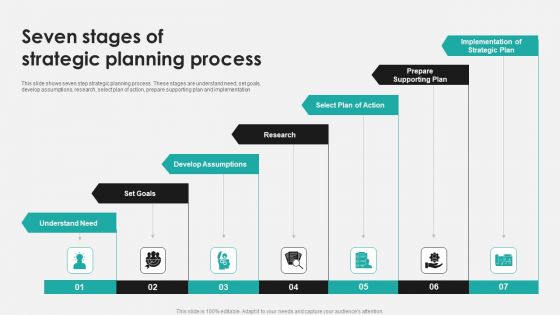
Seven Stages Of Strategic Planning Process Ppt PowerPoint Presentation Pictures Infographics PDF
This slide shows seven step strategic planning process . These stages are understand need, set goals, develop assumptions, research, select plan of action, prepare supporting plan and implementation.Presenting Seven Stages Of Strategic Planning Process Ppt PowerPoint Presentation Pictures Infographics PDF to dispense important information. This template comprises seven stages. It also presents valuable insights into the topics including Understand Need, Develop Assumptions, Plan Action. This is a completely customizable PowerPoint theme that can be put to use immediately. So, download it and address the topic impactfully.
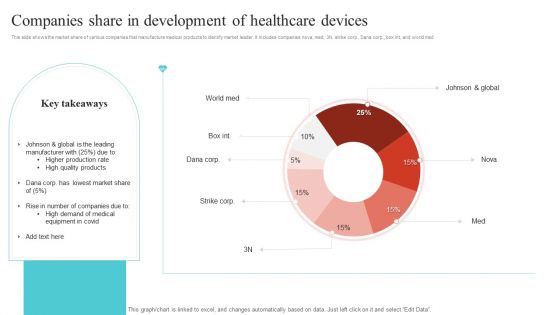
Companies Share In Development Of Healthcare Devices Ppt Summary Infographics PDF
This slide shows the market share of various companies that manufacture medical products to identify market leader. It includes companies nova, med, 3N, strike corp., Dana corp., box int, and world med. Showcasing this set of slides titled Companies Share In Development Of Healthcare Devices Ppt Summary Infographics PDF. The topics addressed in these templates are Johnson And Global, High Quality Products, Higher Production Rate. All the content presented in this PPT design is completely editable. Download it and make adjustments in color, background, font etc. as per your unique business setting.
Tactics For Medical Equipment Design And Development Ppt Icon Infographics PDF
The following slide showcases tactics to assist in designing and developing medical devices. Common tactics covered are record critical requirements, prototyping and obtaining clinical inputs. Persuade your audience using this Tactics For Medical Equipment Design And Development Ppt Icon Infographics PDF. This PPT design covers three stages, thus making it a great tool to use. It also caters to a variety of topics including Record Critical Requirements, Prototyping Obtain, Clinical Input. Download this PPT design now to present a convincing pitch that not only emphasizes the topic but also showcases your presentation skills.
Three Months New Technical Officer Manager Plan Ppt Icon Infographics PDF
This slide shows 3 months plan for new chief technical officer to make improvements in technical side. It includes 30 60 90 days activities like getting familiar to employees, monitoring progress and making reports. Pitch your topic with ease and precision using this Three Months New Technical Officer Manager Plan Ppt Icon Infographics PDF. This layout presents information on First 30 Days, 30 60 Days,60 90 Days. It is also available for immediate download and adjustment. So, changes can be made in the color, design, graphics or any other component to create a unique layout.
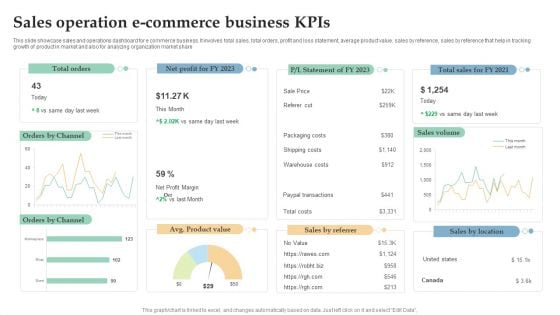
Sales Operation E Commerce Business Kpis Ppt Infographics Design Templates PDF
This slide showcase sales and operations dashboard for e commerce business. It involves total sales, total orders, profit and loss statement, average product value, sales by reference, sales by reference that help in tracking growth of product in market and also for analyzing organization market share. Pitch your topic with ease and precision using this Sales Operation E Commerce Business Kpis Ppt Infographics Design Templates PDF. This layout presents information on Total Orders, Sales Volume, Orders Channel. It is also available for immediate download and adjustment. So, changes can be made in the color, design, graphics or any other component to create a unique layout.
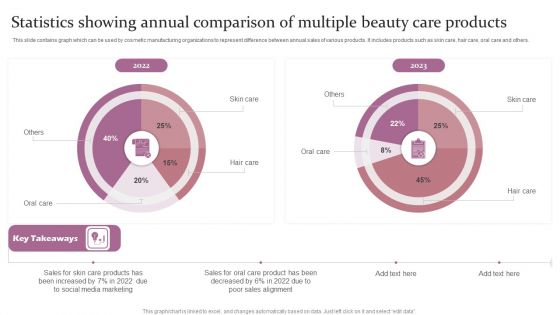
Statistics Showing Annual Comparison Of Multiple Beauty Care Products Ppt Infographics Objects PDF
This slide contains graph which can be used by cosmetic manufacturing organizations to represent difference between annual sales of various products. It includes products such as skin care, hair care, oral care and others. Showcasing this set of slides titled Statistics Showing Annual Comparison Of Multiple Beauty Care Products Ppt Infographics Objects PDF. The topics addressed in these templates are Skin Care, Hair Care, 2022 To 2023. All the content presented in this PPT design is completely editable. Download it and make adjustments in color, background, font etc. as per your unique business setting.

Brand Messaging Technique For Retail Business Ppt PowerPoint Presentation Visual Aids Infographics PDF
The slide contains various messaging strategies used by retailers to attract target audience. Various strategies included are social media, SMS marketing, video messaging and collaborative marketing.Persuade your audience using this Brand Messaging Technique For Retail Business Ppt PowerPoint Presentation Visual Aids Infographics PDF. This PPT design covers four stages, thus making it a great tool to use. It also caters to a variety of topics including Social Media, Video Messaging, Collaborative Marketing. Download this PPT design now to present a convincing pitch that not only emphasizes the topic but also showcases your presentation skills.
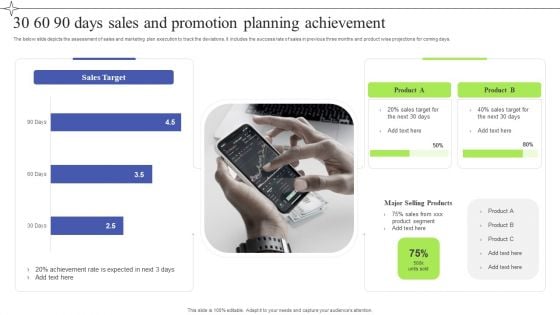
30 60 90 Days Sales And Promotion Planning Achievement Infographics PDF
The below slide depicts the assessment of sales and marketing plan execution to track the deviations. It includes the success rate of sales in previous three months and product wise projections for coming days. Showcasing this set of slides titled 30 60 90 Days Sales And Promotion Planning Achievement Infographics PDF. The topics addressed in these templates are 30 60 90 Days, Sales Promotion Planning, Achievement. All the content presented in this PPT design is completely editable. Download it and make adjustments in color, background, font etc. as per your unique business setting.
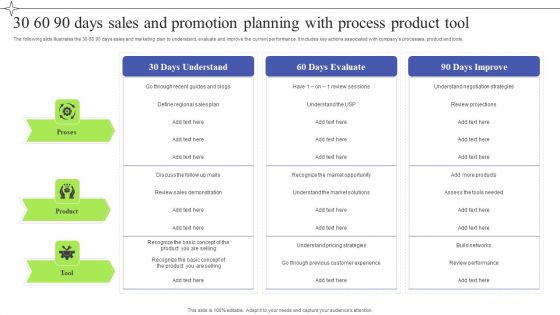
30 60 90 Days Sales And Promotion Planning With Process Product Tool Infographics PDF
The following slide illustrates the 30 60 90 days sales and marketing plan to understand, evaluate and improve the current performance. It includes key actions associated with companys processes, product and tools. Pitch your topic with ease and precision using this 30 60 90 Days Sales And Promotion Planning With Process Product Tool Infographics PDF. This layout presents information on 30 60 90 Days, Sales Promotion Planning, Process Product Tool. It is also available for immediate download and adjustment. So, changes can be made in the color, design, graphics or any other component to create a unique layout.
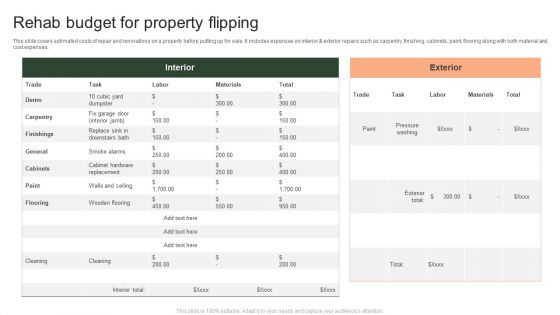
Rehab Budget For Property Flipping Ppt PowerPoint Presentation File Infographics PDF
This slide covers estimated costs of repair and renovations on a property before putting up for sale. It includes expenses on interior AND exterior repairs such as carpentry, finishing, cabinets, paint, flooring along with both material and cost expenses. Pitch your topic with ease and precision using this Rehab Budget For Property Flipping Ppt PowerPoint Presentation File Infographics PDF. This layout presents information on Interior, Exterior, Trade. It is also available for immediate download and adjustment. So, changes can be made in the color, design, graphics or any other component to create a unique layout.
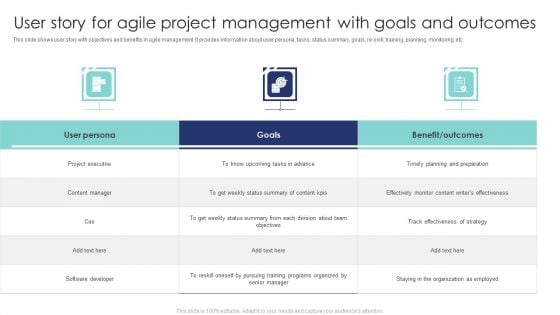
User Story For Agile Project Management With Goals And Outcomes Infographics PDF
This slide shows user story with objectives and benefits in agile management. It provides information about user persona, tasks, status summary, goals, re-skill, training, planning, monitoring, etc. Showcasing this set of slides titled User Story For Agile Project Management With Goals And Outcomes Infographics PDF. The topics addressed in these templates are Project Executive, Goals, Content Manager. All the content presented in this PPT design is completely editable. Download it and make adjustments in color, background, font etc. as per your unique business setting.
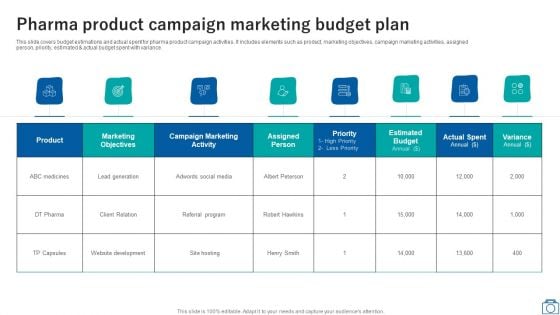
Pharma Product Campaign Marketing Budget Plan Ppt Visual Aids Infographics PDF
This slide covers budget estimations and actual spent for pharma product campaign activities. It includes elements such as product, marketing objectives, campaign marketing activities, assigned person, priority, estimated and actual budget spent with variance. Pitch your topic with ease and precision using this Pharma Product Campaign Marketing Budget Plan Ppt Visual Aids Infographics PDF. This layout presents information on Marketing Objectives, Product, Campaign Marketing Activity. It is also available for immediate download and adjustment. So, changes can be made in the color, design, graphics or any other component to create a unique layout.
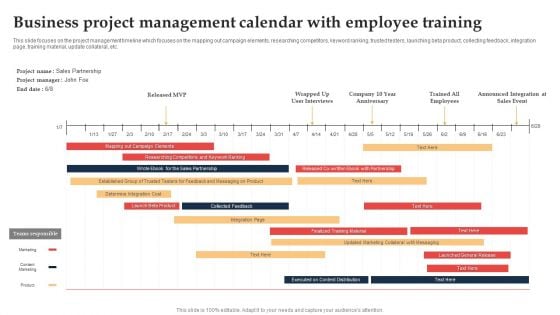
Business Project Management Calendar With Employee Training Ppt File Infographics PDF
This slide focuses on the project management timeline which focuses on the mapping out campaign elements, researching competitors, keyword ranking, trusted testers, launching beta product, collecting feedback, integration page, training material, update collateral, etc. Presenting Business Project Management Calendar With Employee Training Ppt File Infographics PDF to dispense important information. This template comprises one stages. It also presents valuable insights into the topics including Trained All Employees, Announced Integration, Sales Event. This is a completely customizable PowerPoint theme that can be put to use immediately. So, download it and address the topic impactfully.
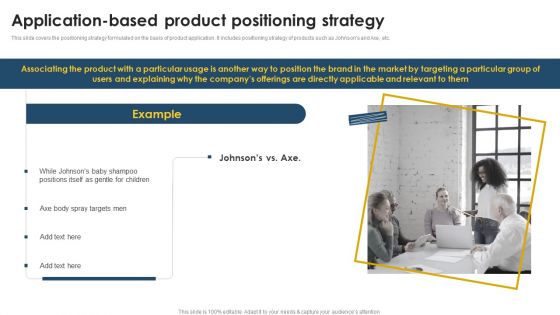
Positioning Techniques To Improve Application Based Product Positioning Strategy Infographics PDF
This slide covers the positioning strategy formulated on the basis of product application. It includes positioning strategy of products such as Johnsons and Axe, etc. Slidegeeks is one of the best resources for PowerPoint templates. You can download easily and regulate Positioning Techniques To Improve Application Based Product Positioning Strategy Infographics PDF for your personal presentations from our wonderful collection. A few clicks is all it takes to discover and get the most relevant and appropriate templates. Use our Templates to add a unique zing and appeal to your presentation and meetings. All the slides are easy to edit and you can use them even for advertisement purposes.
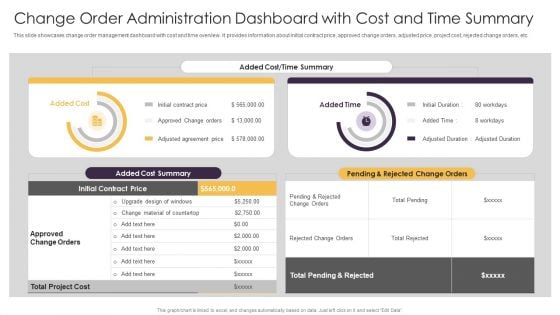
Change Order Administration Dashboard With Cost And Time Summary Ppt Infographics Sample PDF
This slide showcases change order management dashboard with cost and time overview. It provides information about initial contract price, approved change orders, adjusted price, project cost, rejected change orders, etc. Showcasing this set of slides titled Change Order Administration Dashboard With Cost And Time Summary Ppt Infographics Sample PDF. The topics addressed in these templates are Added Cost Summary, Initial Contract Price, Rejected Change Orders. All the content presented in this PPT design is completely editable. Download it and make adjustments in color, background, font etc. as per your unique business setting.
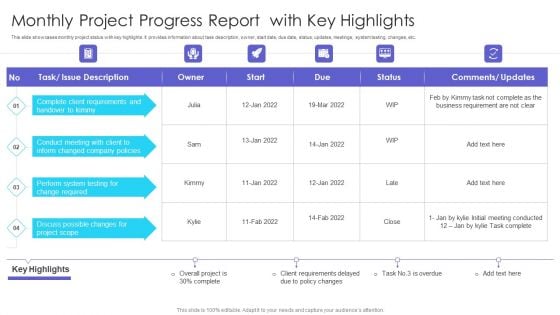
Monthly Project Progress Report With Key Highlights Ppt Infographics Design Ideas PDF
This slide showcases monthly project status with key highlights. It provides information about task description, owner, start date, due date, status, updates, meetings, system testing, changes, etc. Showcasing this set of slides titled Monthly Project Progress Report With Key Highlights Ppt Infographics Design Ideas PDF. The topics addressed in these templates are Business Requirement, Initial Meeting Conducted, Project Scope. All the content presented in this PPT design is completely editable. Download it and make adjustments in color, background, font etc. as per your unique business setting.
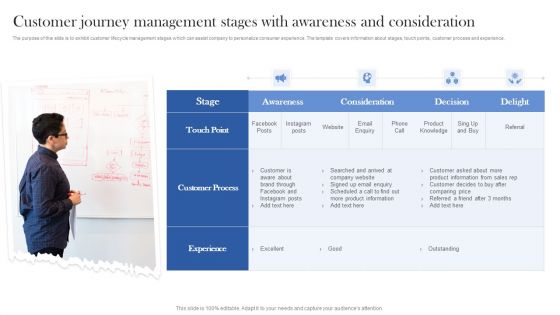
Customer Journey Management Stages With Awareness And Consideration Ppt Infographics Smartart PDF
The purpose of this slide is to exhibit customer lifecycle management stages which can assist company to personalize consumer experience. The template covers information about stages, touch points, customer process and experience. Persuade your audience using this Customer Journey Management Stages With Awareness And Consideration Ppt Infographics Smartart PDF. This PPT design covers four stages, thus making it a great tool to use. It also caters to a variety of topics including Awareness, Consideration, Decision, Delight. Download this PPT design now to present a convincing pitch that not only emphasizes the topic but also showcases your presentation skills.
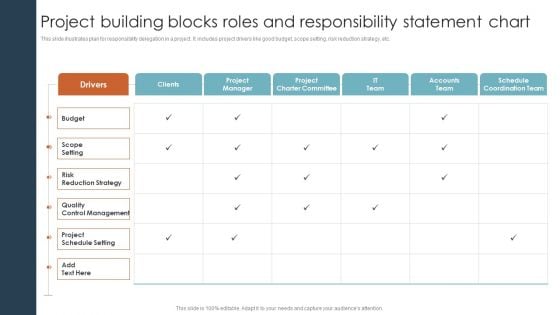
Project Building Blocks Roles And Responsibility Statement Chart Ppt Infographics Ideas PDF
This slide illustrates plan for responsibility delegation in a project. It includes project drivers like good budget, scope setting, risk reduction strategy, etc. Pitch your topic with ease and precision using this Project Building Blocks Roles And Responsibility Statement Chart Ppt Infographics Ideas PDF. This layout presents information on Scope Setting, Risk Reduction Strategy, Quality Control Management. It is also available for immediate download and adjustment. So, changes can be made in the color, design, graphics or any other component to create a unique layout.
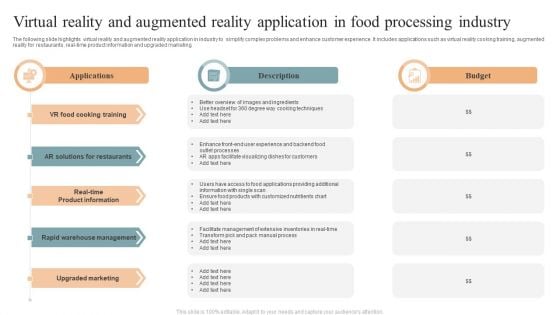
Virtual Reality And Augmented Reality Application In Food Processing Industry Infographics PDF
The following slide highlights virtual reality and augmented reality application in industry to simplify complex problems and enhance customer experience. It includes applications such as virtual reality cooking training, augmented reality for restaurants, real-time product information and upgraded marketing. Showcasing this set of slides titled Virtual Reality And Augmented Reality Application In Food Processing Industry Infographics PDF. The topics addressed in these templates are Applications, Budget, Upgraded Marketing. All the content presented in this PPT design is completely editable. Download it and make adjustments in color, background, font etc. as per your unique business setting.
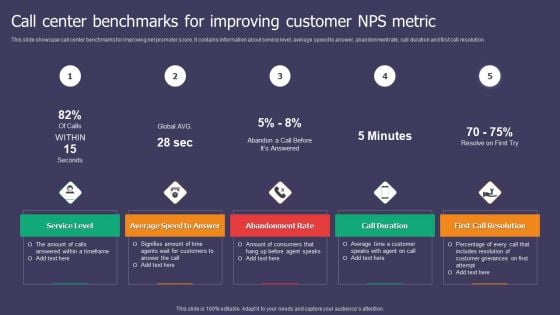
Call Center Benchmarks For Improving Customer NPS Metric Ppt Infographics Inspiration PDF
This slide showcase call center benchmarks for improving net promoter score. It contains information about service level, average speed to answer, abandonment rate, call duration and first call resolution. Showcasing this set of slides titled Call Center Benchmarks For Improving Customer NPS Metric Ppt Infographics Inspiration PDF. The topics addressed in these templates are Service Level, Abandonment Rate, Call Duration. All the content presented in this PPT design is completely editable. Download it and make adjustments in color, background, font etc. as per your unique business setting.
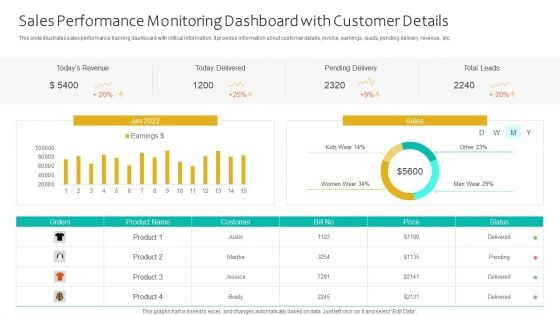
Sales Performance Monitoring Dashboard With Customer Details Ppt Infographics Themes PDF
This slide illustrates sales performance tracking dashboard with critical information. It provides information about customer details, invoice, earnings, leads, pending delivery, revenue, etc. Pitch your topic with ease and precision using this Sales Performance Monitoring Dashboard With Customer Details Ppt Infographics Themes PDF. This layout presents information on Todays Revenue, Today Delivered, Pending Delivery, Total Leads. It is also available for immediate download and adjustment. So, changes can be made in the color, design, graphics or any other component to create a unique layout.
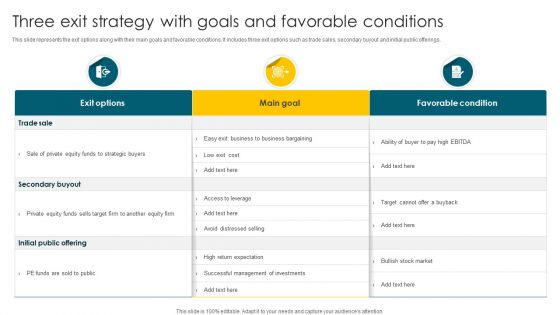
Three Exit Strategy With Goals And Favorable Conditions Ppt Infographics Microsoft PDF
This slide represents the exit options along with their main goals and favorable conditions. It includes three exit options such as trade sales, secondary buyout and initial public offerings. Pitch your topic with ease and precision using this Three Exit Strategy With Goals And Favorable Conditions Ppt Infographics Microsoft PDF. This layout presents information on Exit Options, Main Goal, Favorable Condition. It is also available for immediate download and adjustment. So, changes can be made in the color, design, graphics or any other component to create a unique layout.
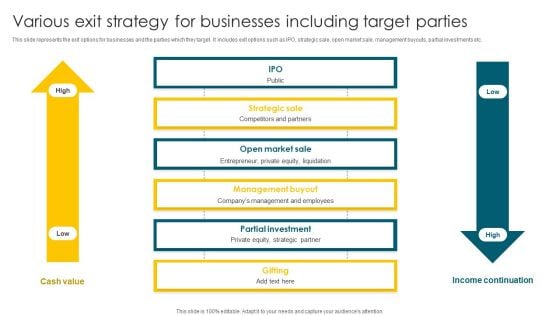
Various Exit Strategy For Businesses Including Target Parties Ppt Infographics Sample PDF
This slide represents the exit options for businesses and the parties which they target. It includes exit options such as IPO, strategic sale, open market sale, management buyouts, partial investments etc. Showcasing this set of slides titled Various Exit Strategy For Businesses Including Target Parties Ppt Infographics Sample PDF. The topics addressed in these templates are IPO, Strategic Sale, Management Buyout, Partial Investment. All the content presented in this PPT design is completely editable. Download it and make adjustments in color, background, font etc. as per your unique business setting.
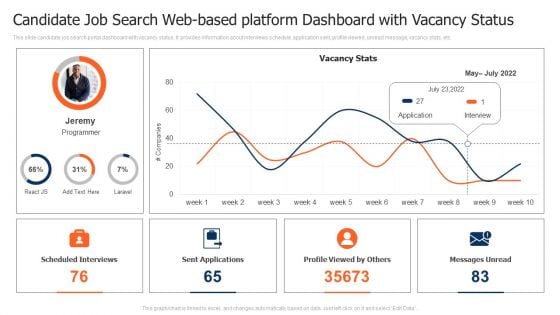
Candidate Job Search Web Based Platform Dashboard With Vacancy Status Infographics PDF
This slide candidate job search portal dashboard with vacancy status. It provides information about interviews schedule, application sent, profile viewed, unread message, vacancy stats, etc. Showcasing this set of slides titled Candidate Job Search Web Based Platform Dashboard With Vacancy Status Infographics PDF. The topics addressed in these templates are Candidate Job Search Web Based, Platform Dashboard. All the content presented in this PPT design is completely editable. Download it and make adjustments in color, background, font etc. as per your unique business setting.
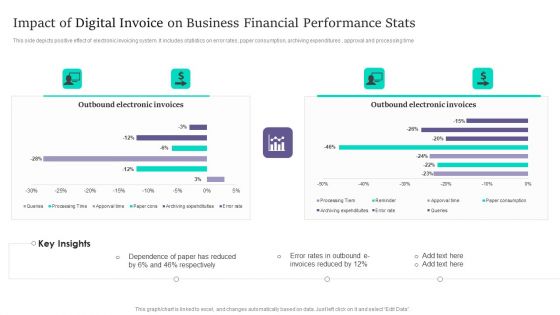
Impact Of Digital Invoice On Business Financial Performance Stats Infographics PDF
This side depicts positive effect of electronic invoicing system. It includes statistics on error rates, paper consumption, archiving expenditures , approval and processing time. Pitch your topic with ease and precision using this Impact Of Digital Invoice On Business Financial Performance Stats Infographics PDF. This layout presents information on Impact Of Digital Invoice, Business Financial Performance Stats. It is also available for immediate download and adjustment. So, changes can be made in the color, design, graphics or any other component to create a unique layout.

Company Details Of The Cafe Business Organization Structure Of The Coffee Shop Infographics PDF
The slide highlights the organizational structure of the coffee shop. It includes founder or CEO, HR team, marketing team, accounts team, baristas, admin executive etc. Slidegeeks is one of the best resources for PowerPoint templates. You can download easily and regulate Company Details Of The Cafe Business Organization Structure Of The Coffee Shop Infographics PDF for your personal presentations from our wonderful collection. A few clicks is all it takes to discover and get the most relevant and appropriate templates. Use our Templates to add a unique zing and appeal to your presentation and meetings. All the slides are easy to edit and you can use them even for advertisement purposes.
Annual Employee Attrition Tracking Report With Separation And Appointment Rates Infographics PDF
This slide covers summary report of employees separation rates with reasons. It also includes total appointments including transfers and promotion rates with percentage for cumulative turnover. Showcasing this set of slides titled Annual Employee Attrition Tracking Report With Separation And Appointment Rates Infographics PDF. The topics addressed in these templates are Organizational, Separation And Appointment Rates, Employee Attrition. All the content presented in this PPT design is completely editable. Download it and make adjustments in color, background, font etc. as per your unique business setting.
Issues Tracking Dashboard For Organizational Building Management Ppt Infographics Topics PDF
This slide showcases dashboard which can help organization to keep track of issues plus faults during facility management and rectify them within stipulated time. Its key elements are issues reported, fault tracking, etc. Pitch your topic with ease and precision using this Issues Tracking Dashboard For Organizational Building Management Ppt Infographics Topics PDF. This layout presents information on Fault Tracking, Issues Reported, Location. It is also available for immediate download and adjustment. So, changes can be made in the color, design, graphics or any other component to create a unique layout.
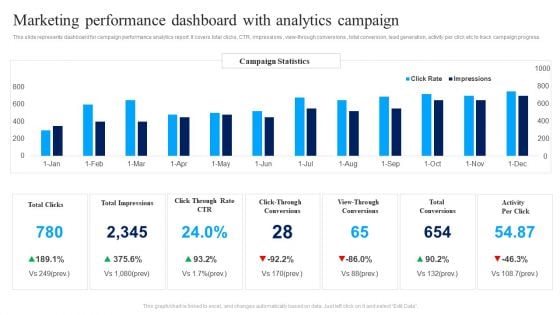
Marketing Performance Dashboard With Analytics Campaign Ppt Infographics Background Images PDF
This slide represents dashboard for campaign performance analytics report. It covers total clicks, CTR, impressions , view-through conversions , total conversion, lead generation, activity per click etc to track campaign progress. Showcasing this set of slides titled Marketing Performance Dashboard With Analytics Campaign Ppt Infographics Background Images PDF. The topics addressed in these templates are Total Clicks, Total Impressions, Total Conversions, Activity Per Click. All the content presented in this PPT design is completely editable. Download it and make adjustments in color, background, font etc. as per your unique business setting.
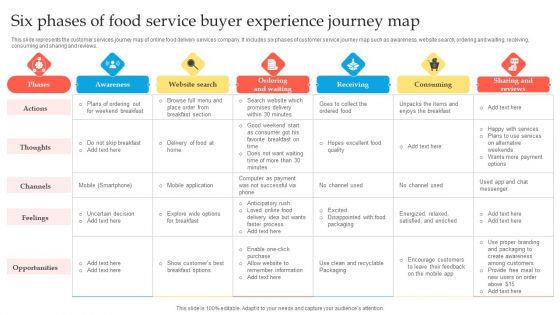
Six Phases Of Food Service Buyer Experience Journey Map Infographics PDF
This slide represents the customer services journey map of online food delivery services company. It includes six phases of customer service journey map such as awareness, website search, ordering and waiting, receiving, consuming and sharing and reviews. Showcasing this set of slides titled Six Phases Of Food Service Buyer Experience Journey Map Infographics PDF. The topics addressed in these templates are Awareness, Website Search, Receiving, Consuming. All the content presented in this PPT design is completely editable. Download it and make adjustments in color, background, font etc. as per your unique business setting.
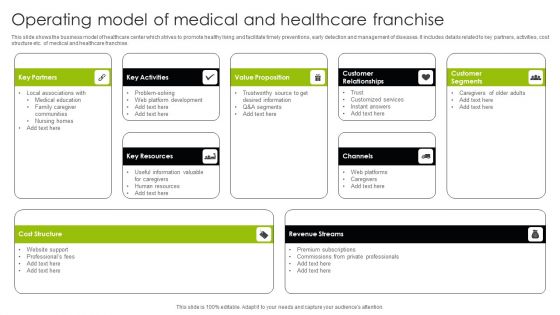
Operating Model Of Medical And Healthcare Franchise Ppt Infographics Microsoft PDF
This slide shows the business model of healthcare center which strives to promote healthy living and facilitate timely preventions, early detection and management of diseases. It includes details related to key partners, activities, cost structure etc. of medical and healthcare franchise. Pitch your topic with ease and precision using this Operating Model Of Medical And Healthcare Franchise Ppt Infographics Microsoft PDF. This layout presents information on Cost Structure, Revenue Streams, Key Resources, Value Propositions. It is also available for immediate download and adjustment. So, changes can be made in the color, design, graphics or any other component to create a unique layout.
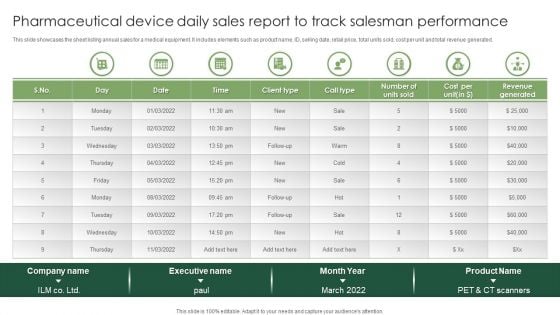
Pharmaceutical Device Daily Sales Report To Track Salesman Performance Infographics PDF
This slide showcases the sheet listing annual sales for a medical equipment. It includes elements such as product name, ID, selling date, retail price, total units sold, cost per unit and total revenue generated. Pitch your topic with ease and precision using this Pharmaceutical Device Daily Sales Report To Track Salesman Performance Infographics PDF. This layout presents information on Pharmaceutical Device Daily, Sales Report To Track, Salesman Performance. It is also available for immediate download and adjustment. So, changes can be made in the color, design, graphics or any other component to create a unique layout.

Customer Experience Focused Strategic Approach For Optimizing Digital Services Infographics PDF
This slide covers the model depicting companys digital customer experience strategy. The purpose of this template is to define the different levels of maturity through which a company moves before achieving the goal. It also includes details related to digital channels, services, etc.Pitch your topic with ease and precision using this Customer Experience Focused Strategic Approach For Optimizing Digital Services Infographics PDF. This layout presents information on Based Personalization, Humanified Design, Channel Journey. It is also available for immediate download and adjustment. So, changes can be made in the color, design, graphics or any other component to create a unique layout.
Tracking Employee Work Performance Tools With Features And Use Cases Infographics PDF
This slide contains the tools that are used for tracking employees performance with their comparison on the basis of features and price. It also shows the use cases of the same the tools are basecamp, workiq, desk time and google streak. Showcasing this set of slides titled Tracking Employee Work Performance Tools With Features And Use Cases Infographics PDF. The topics addressed in these templates are Nonproductive Applications, Categorize Applications, Targets. All the content presented in this PPT design is completely editable. Download it and make adjustments in color, background, font etc. as per your unique business setting.

Activity Schedule Map For Successfully Implementing Pre Launch Activities Marketing Infographics PDF
This slide signifies the activity schedule map for implementing pre launch activities marketing. It covers information about activity like use of landing page, develop Press kit, promote backlinks and host events. Showcasing this set of slides titled Activity Schedule Map For Successfully Implementing Pre Launch Activities Marketing Infographics PDF The topics addressed in these templates are Develop And Promote Backlinks, Promote Brand, Influencer Marketing Strategy. All the content presented in this PPT design is completely editable. Download it and make adjustments in color, background, font etc. as per your unique business setting.
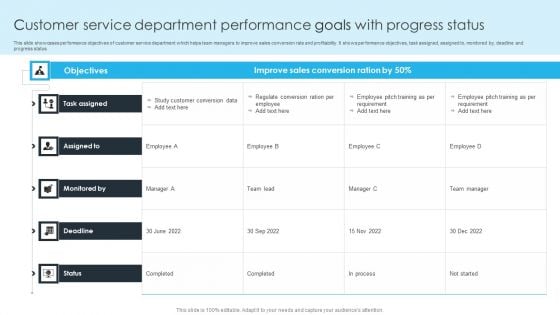
Customer Service Department Performance Goals With Progress Status Ppt PowerPoint Presentation Infographics Background Image PDF
This slide showcases performance objectives of customer service department which helps team managers to improve sales conversion rate and profitability. It shows performance objectives, task assigned, assigned to, monitored by, deadline and progress status. Showcasing this set of slides titled Customer Service Department Performance Goals With Progress Status Ppt PowerPoint Presentation Infographics Background Image PDF. The topics addressed in these templates are Task Assigned, Monitored, Improve Sales Conversion. All the content presented in this PPT design is completely editable. Download it and make adjustments in color, background, font etc. as per your unique business setting.
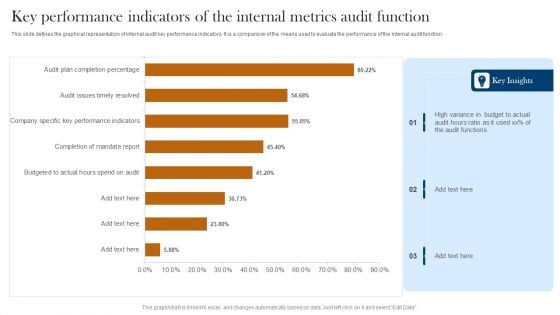
Key Performance Indicators Of The Internal Metrics Audit Function Infographics PDF
This slide defines the graphical representation of internal audit key performance indicators. It is a comparison of the means used to evaluate the performance of the internal audit function. Pitch your topic with ease and precision using this Key Performance Indicators Of The Internal Metrics Audit Function Infographics PDF. This layout presents information on High Variance, Budget To Actual, Audit Functions. It is also available for immediate download and adjustment. So, changes can be made in the color, design, graphics or any other component to create a unique layout.
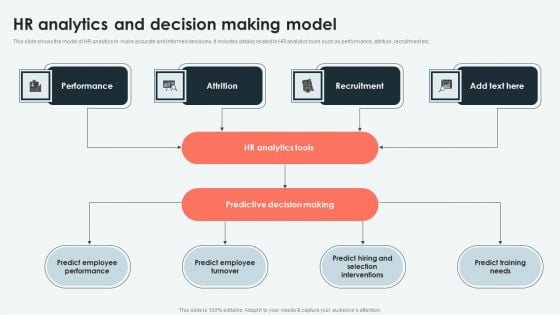
Analyzing And Deploying HR Analytics And Decision Making Model Infographics PDF
This slide shows the model of HR analytics to make accurate and informed decisions. It includes details related to HR analytics tools such as performance, attrition, recruitment etc. Slidegeeks is one of the best resources for PowerPoint templates. You can download easily and regulate Analyzing And Deploying HR Analytics And Decision Making Model Infographics PDF for your personal presentations from our wonderful collection. A few clicks is all it takes to discover and get the most relevant and appropriate templates. Use our Templates to add a unique zing and appeal to your presentation and meetings. All the slides are easy to edit and you can use them even for advertisement purposes.
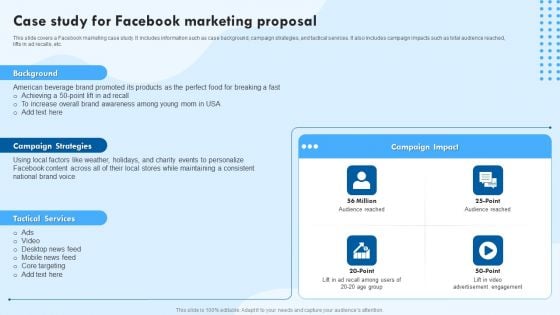
Case Study For Facebook Marketing Proposal Ppt Infographics Designs Download PDF
This slide covers a Facebook marketing case study. It includes information such as case background, campaign strategies, and tactical services. It also includes campaign impacts such as total audience reached, lifts in ad recalls, etc. Stand out from the crowd with our dynamic Case Study For Facebook Marketing Proposal Ppt Infographics Designs Download PDF template. Designed to help you make a statement, this single-slide PPT template is fully customizable to suit your unique needs. With eye-catching visuals and seamless editing options, you can create impactful presentations in minutes. Say goodbye to boring slides and unlock your presentation potential with our top-notch template.
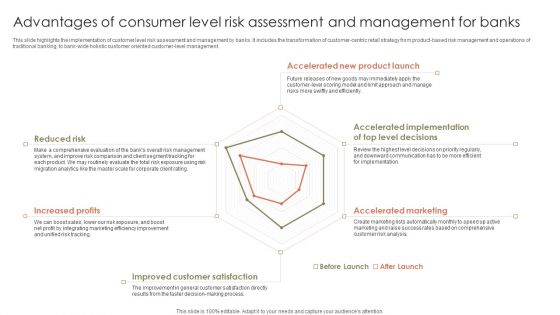
Advantages Of Consumer Level Risk Assessment And Management For Banks Infographics PDF
This slide highlights the implemention of customer level risk assessment and management by banks. it includes the transformation of customer centric retail strategy from product based risk management and operations of traditional banking to bank wide holistic customer oriented customer level management. Pitch your topic with ease and precision using this Advantages Of Consumer Level Risk Assessment And Management For Banks Infographics PDF. This layout presents information on Reduced Risk, Increased Profits, Accelerated Marketing. It is also available for immediate download and adjustment. So, changes can be made in the color, design, graphics or any other component to create a unique layout.
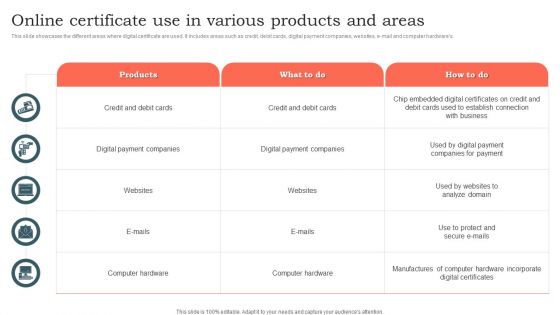
Online Certificate Use In Various Products And Areas Ppt Infographics Display PDF
This slide showcases the different areas where digital certificate are used. It includes areas such as credit, debit cards, digital payment companies, websites, e-mail and computer hardwares. Showcasing this set of slides titled Online Certificate Use In Various Products And Areas Ppt Infographics Display PDF. The topics addressed in these templates are Products, Digital Payment Companies, Computer Hardware. All the content presented in this PPT design is completely editable. Download it and make adjustments in color, background, font etc. as per your unique business setting.
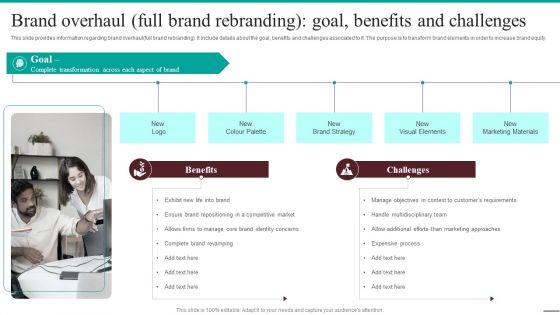
Guide For Systematic Brand Overhaul Full Brand Rebranding Goal Benefits Infographics PDF
This slide provides information regarding brand overhaul full brand rebranding. It include details about the goal, benefits and challenges associated to it. The purpose is to transform brand elements in order to increase brand. There are so many reasons you need a Guide For Systematic Brand Overhaul Full Brand Rebranding Goal Benefits Infographics PDF. The first reason is you cant spend time making everything from scratch, Thus, Slidegeeks has made presentation templates for you too. You can easily download these templates from our website easily.
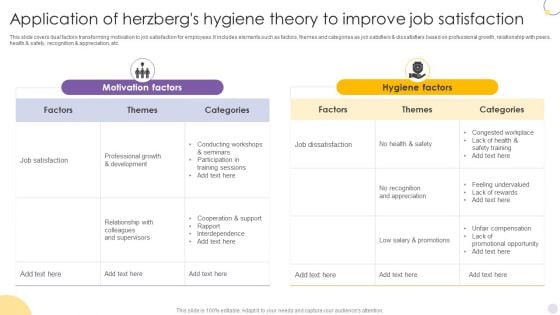
Application Of Herzbergs Hygiene Theory To Improve Job Satisfaction Infographics PDF
This slide covers dual factors transforming motivation to job satisfaction for employees. It includes elements such as factors, themes and categories as job satisfiers and dissatisfiers based on professional growth, relationship with peers, health and safety, recognition and appreciation, etc. Showcasing this set of slides titled Application Of Herzbergs Hygiene Theory To Improve Job Satisfaction Infographics PDF. The topics addressed in these templates are Motivation Factors, Hygiene Factors, Job Satisfaction. All the content presented in this PPT design is completely editable. Download it and make adjustments in color, background, font etc. as per your unique business setting.
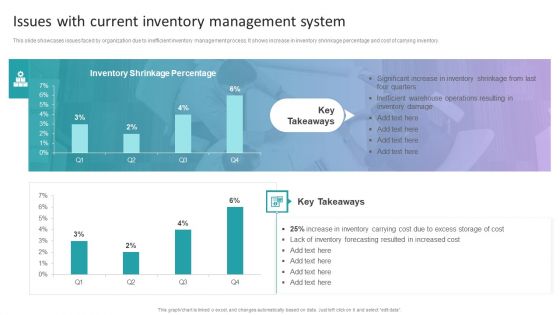
Stock Inventory Acquisition Issues With Current Inventory Management System Infographics PDF
This slide showcases issues faced by organization due to inefficient inventory management process. It shows increase in inventory shrinkage percentage and cost of carrying inventory. Slidegeeks is one of the best resources for PowerPoint templates. You can download easily and regulate Stock Inventory Acquisition Issues With Current Inventory Management System Infographics PDF for your personal presentations from our wonderful collection. A few clicks is all it takes to discover and get the most relevant and appropriate templates. Use our Templates to add a unique zing and appeal to your presentation and meetings. All the slides are easy to edit and you can use them even for advertisement purposes.
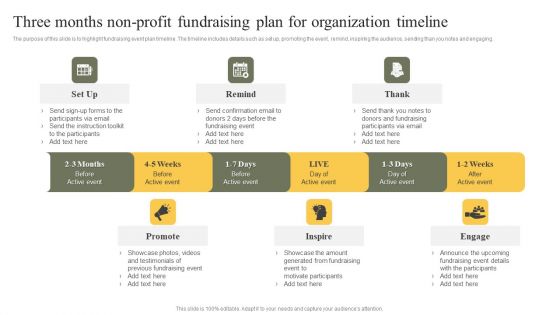
Three Months Non Profit Fundraising Plan For Organization Timeline Infographics PDF
The purpose of this slide is to highlight fundraising event plan timeline. The timeline includes details such as set up, promoting the event, remind, inspiring the audience, sending than you notes and engaging. Presenting Three Months Non Profit Fundraising Plan For Organization Timeline Infographics PDF to dispense important information. This template comprises six stages. It also presents valuable insights into the topics including Remind, Inspire, Promote. This is a completely customizable PowerPoint theme that can be put to use immediately. So, download it and address the topic impactfully.


 Continue with Email

 Home
Home


