Testing Dashboards
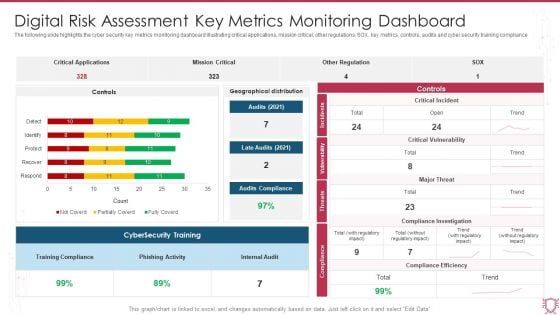
Digital Risk Assessment Key Metrics Monitoring Dashboard Ppt Ideas Diagrams PDF
The following slide highlights the cyber security key metrics monitoring dashboard illustrating critical applications, mission critical, other regulations, SOX, key metrics, controls, audits and cyber security training compliance. Showcasing this set of slides titled Digital Risk Assessment Key Metrics Monitoring Dashboard Ppt Ideas Diagrams PDF. The topics addressed in these templates are Critical Applications, Mission Critical, Other Regulation. All the content presented in this PPT design is completely editable. Download it and make adjustments in color, background, font etc. as per your unique business setting.
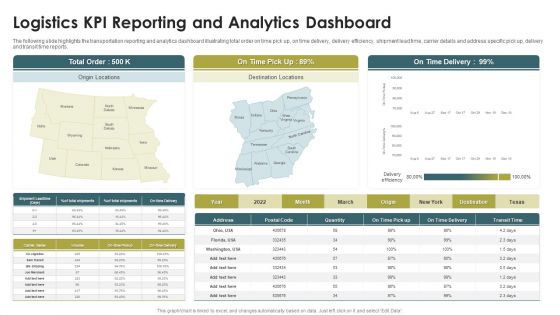
Logistics KPI Reporting And Analytics Dashboard Ppt Infographic Template Background PDF
The following slide highlights the transportation reporting and analytics dashboard illustrating total order on time pick up, on time delivery, delivery efficiency, shipment lead time, carrier details and address specific pick up, delivery and transit time reports. Presenting Logistics KPI Reporting And Analytics Dashboard Ppt Infographic Template Background PDF to dispense important information. This template comprises one stages. It also presents valuable insights into the topics including On Time Delivery, Total Order, Origin Locations. This is a completely customizable PowerPoint theme that can be put to use immediately. So, download it and address the topic impactfully.
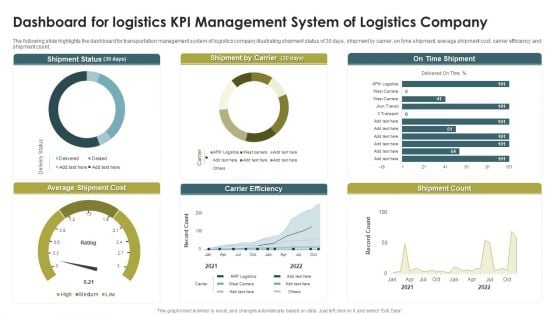
Dashboard For Logistics KPI Management System Of Logistics Company Infographics PDF
The following slide highlights the dashboard for transportation management system of logistics company illustrating shipment status of 30 days, shipment by carrier, on time shipment, average shipment cost, carrier efficiency and shipment count. Pitch your topic with ease and precision using this Dashboard For Logistics KPI Management System Of Logistics Company Infographics PDF. This layout presents information on Shipment Status, Shipment By Carrier, On Time Shipment. It is also available for immediate download and adjustment. So, changes can be made in the color, design, graphics or any other component to create a unique layout.
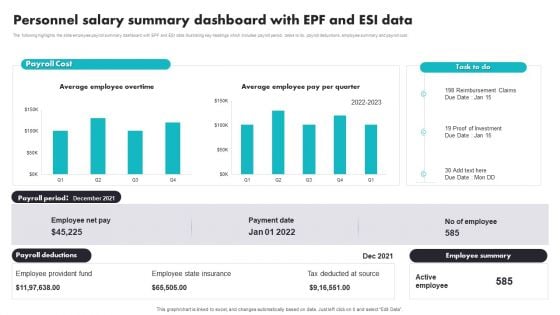
Personnel Salary Summary Dashboard With EPF And ESI Data Brochure PDF
The following highlights the slide employee payroll summary dashboard with EPF and ESI data illustrating key headings which includes payroll period, tasks to do, payroll deductions, employee summary and payroll cost. Pitch your topic with ease and precision using this Personnel Salary Summary Dashboard With EPF And ESI Data Brochure PDF. This layout presents information on Employee Provident Fund, Employee State Insurance, Tax Deducted At Source. It is also available for immediate download and adjustment. So, changes can be made in the color, design, graphics or any other component to create a unique layout.
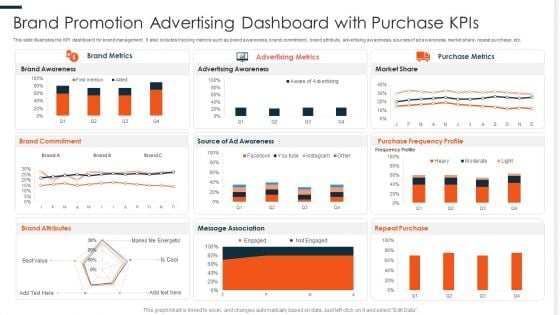
Brand Promotion Advertising Dashboard With Purchase Kpis Ppt PowerPoint Presentation File Format PDF
This slide illustrates the KPI dashboard for brand management. It also includes tracking metrics such as brand awareness, brand commitment, brand attribute, advertising awareness, sources of ad awareness, market share, repeat purchase, etc. Showcasing this set of slides titled Brand Promotion Advertising Dashboard With Purchase Kpis Ppt PowerPoint Presentation File Format PDF. The topics addressed in these templates are Brand Awareness, Advertising Awareness, Purchase Frequency. All the content presented in this PPT design is completely editable. Download it and make adjustments in color, background, font etc. as per your unique business setting.
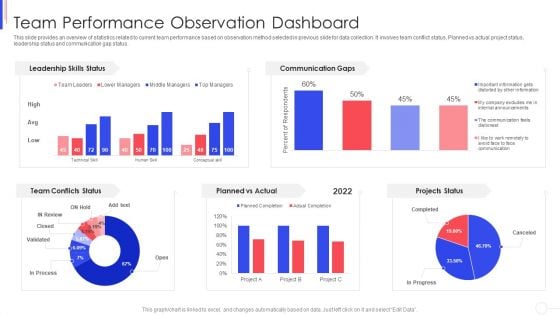
Strategy To Improve Team Proficiency Team Performance Observation Dashboard Diagrams PDF
This slide provides an overview of statistics related to current team performance based on observation method selected in previous slide for data collection. It involves team conflict status, Planned vs actual project status, leadership status and communication gap status. Deliver an awe inspiring pitch with this creative proficiency team performance observation dashboard diagrams pdf bundle. Topics like team performance observation dashboard can be discussed with this completely editable template. It is available for immediate download depending on the needs and requirements of the user.
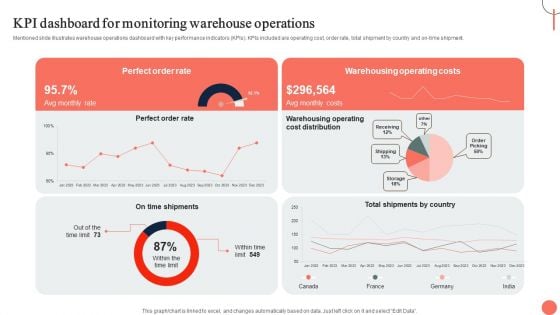
Strategies For Dynamic Supply Chain Agility KPI Dashboard For Monitoring Warehouse Operations Download PDF
Mentioned slide illustrates warehouse operations dashboard with key performance indicators KPIs. KPIs included are operating cost, order rate, total shipment by country and on-time shipment. Slidegeeks is one of the best resources for PowerPoint templates. You can download easily and regulate Strategies For Dynamic Supply Chain Agility KPI Dashboard For Monitoring Warehouse Operations Download PDF for your personal presentations from our wonderful collection. A few clicks is all it takes to discover and get the most relevant and appropriate templates. Use our Templates to add a unique zing and appeal to your presentation and meetings. All the slides are easy to edit and you can use them even for advertisement purposes.
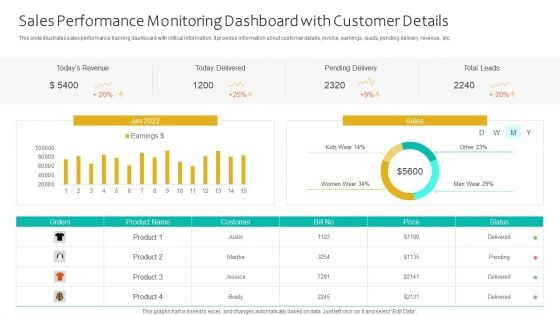
Sales Performance Monitoring Dashboard With Customer Details Ppt Infographics Themes PDF
This slide illustrates sales performance tracking dashboard with critical information. It provides information about customer details, invoice, earnings, leads, pending delivery, revenue, etc. Pitch your topic with ease and precision using this Sales Performance Monitoring Dashboard With Customer Details Ppt Infographics Themes PDF. This layout presents information on Todays Revenue, Today Delivered, Pending Delivery, Total Leads. It is also available for immediate download and adjustment. So, changes can be made in the color, design, graphics or any other component to create a unique layout.

Dashboard To Analyze City Ecological And Carbon Footprints Consumption Mockup PDF
This slide illustrates the dashboard to analyze ecological and carbon footprint of a city. The purpose of this template is to provide layout to analyze footprint data and define measures to protect environment. It includes metrics related to carbon emissions, usage of air, water and energy. Showcasing this set of slides titled Dashboard To Analyze City Ecological And Carbon Footprints Consumption Mockup PDF. The topics addressed in these templates are Installing Rooftop Photovoltaic, Using Mass Transport, Composting. All the content presented in this PPT design is completely editable. Download it and make adjustments in color, background, font etc. as per your unique business setting.
Monthly Sales KPI Dashboard For Tracking Brand Recommendation Progress Background PDF
Following slide demonstrates key performance indicator dashboard for tracking monthly sales to monitor business performance. It includes components such as monthly execution cost, sales, state wise events, Brand market, and programs. Showcasing this set of slides titled Monthly Sales KPI Dashboard For Tracking Brand Recommendation Progress Background PDF. The topics addressed in these templates are Products Sold, Engagements, Events, Active Markets, Sampled, Attendance. All the content presented in this PPT design is completely editable. Download it and make adjustments in color, background, font etc. as per your unique business setting.
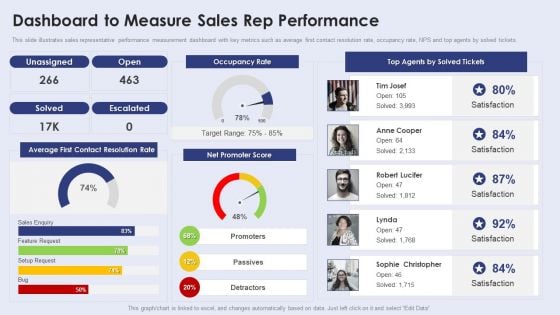
Creating New Product Launch Campaign Strategy Dashboard To Measure Sales Rep Performance Introduction PDF
This slide illustrates sales representative performance measurement dashboard with key metrics such as average first contact resolution rate, occupancy rate, NPS and top agents by solved tickets. Make sure to capture your audiences attention in your business displays with our gratis customizable Creating New Product Launch Campaign Strategy Dashboard To Measure Sales Rep Performance Introduction PDF. These are great for business strategies, office conferences, capital raising or task suggestions. If you desire to acquire more customers for your tech business and ensure they stay satisfied, create your own sales presentation with these plain slides.
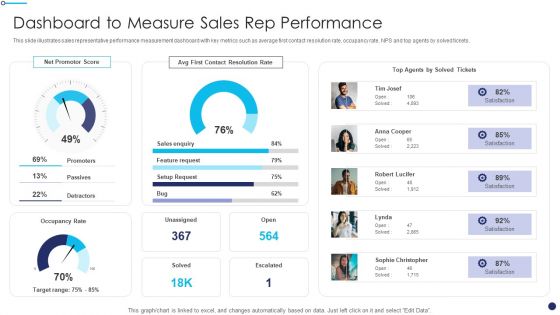
Effective Sales Technique For New Product Launch Dashboard To Measure Sales Rep Performance Themes PDF
This slide illustrates sales representative performance measurement dashboard with key metrics such as average first contact resolution rate, occupancy rate, NPS and top agents by solved tickets.Deliver and pitch your topic in the best possible manner with this Effective Sales Technique For New Product Launch Dashboard To Measure Sales Rep Performance Themes PDF Use them to share invaluable insights on Contact Resolution, Feature Request, Promoters and impress your audience. This template can be altered and modified as per your expectations. So, grab it now.
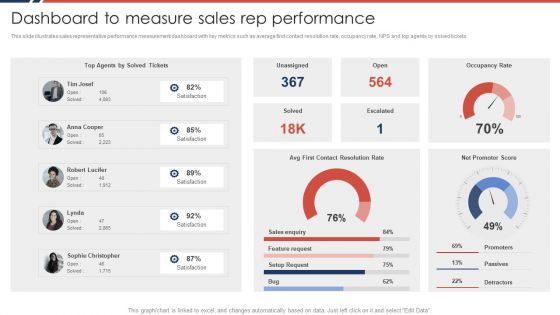
Effective Sales Plan For New Product Introduction In Market Dashboard To Measure Sales Download PDF
This slide illustrates sales representative performance measurement dashboard with key metrics such as average first contact resolution rate, occupancy rate, NPS and top agents by solved tickets.Deliver and pitch your topic in the best possible manner with this Effective Sales Plan For New Product Introduction In Market Dashboard To Measure Sales Download PDF Use them to share invaluable insights on Sales Enquiry, Feature Request, Setup Request and impress your audience. This template can be altered and modified as per your expectations. So, grab it now.
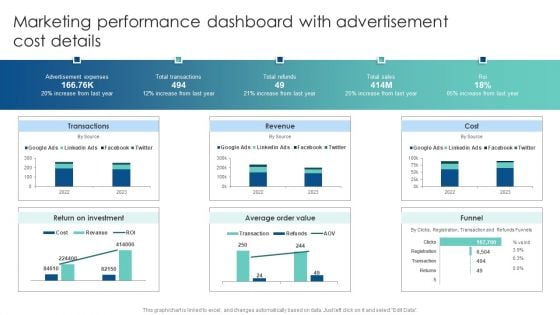
Marketing Performance Dashboard With Advertisement Cost Details Customer Acquisition Through Advertising Guidelines PDF
Explore a selection of the finest Marketing Performance Dashboard With Advertisement Cost Details Customer Acquisition Through Advertising Guidelines PDF here. With a plethora of professionally designed and pre-made slide templates, you can quickly and easily find the right one for your upcoming presentation. You can use our Marketing Performance Dashboard With Advertisement Cost Details Customer Acquisition Through Advertising Guidelines PDF to effectively convey your message to a wider audience. Slidegeeks has done a lot of research before preparing these presentation templates. The content can be personalized and the slides are highly editable. Grab templates today from Slidegeeks.
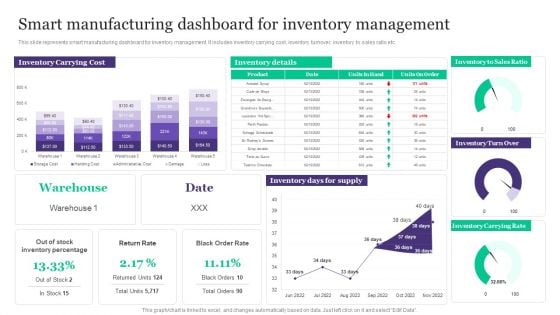
Deployment Of Automated Production Technology Smart Manufacturing Dashboard For Inventory Management Brochure PDF
This slide represents smart manufacturing dashboard for inventory management. It includes inventory carrying cost, inventory turnover, inventory to sales ratio etc.Welcome to our selection of the Deployment Of Automated Production Technology Smart Manufacturing Dashboard For Inventory Management Brochure PDF. These are designed to help you showcase your creativity and bring your sphere to life. Planning and Innovation are essential for any business that is just starting out. This collection contains the designs that you need for your everyday presentations. All of our PowerPoints are 100 precent editable, so you can customize them to suit your needs. This multi-purpose template can be used in various situations. Grab these presentation templates today.
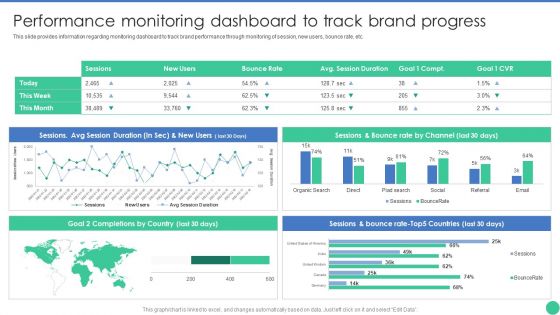
Brand Management To Enhance Performance Monitoring Dashboard To Track Brand Pictures PDF
This slide provides information regarding monitoring dashboard to track brand performance through monitoring of session, new users, bounce rate, etc. Do you know about Slidesgeeks Brand Management To Enhance Performance Monitoring Dashboard To Track Brand Pictures PDF These are perfect for delivering any kind od presentation. Using it, create PowerPoint presentations that communicate your ideas and engage audiences. Save time and effort by using our pre-designed presentation templates that are perfect for a wide range of topic. Our vast selection of designs covers a range of styles, from creative to business, and are all highly customizable and easy to edit. Download as a PowerPoint template or use them as Google Slides themes.
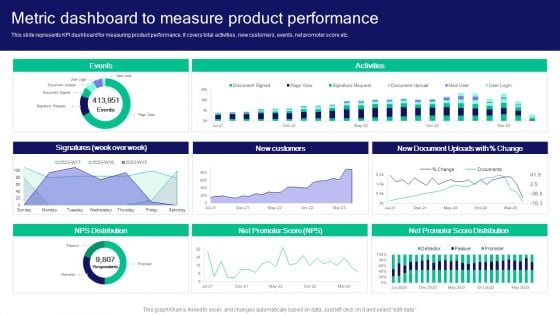
Strategies For Effective Product Metric Dashboard To Measure Product Performance Download PDF
This slide represents KPI dashboard for measuring product performance. It covers total activities, new customers, events, net promoter score etc. Welcome to our selection of the Strategies For Effective Product Metric Dashboard To Measure Product Performance Download PDF. These are designed to help you showcase your creativity and bring your sphere to life. Planning and Innovation are essential for any business that is just starting out. This collection contains the designs that you need for your everyday presentations. All of our PowerPoints are 100 percent editable, so you can customize them to suit your needs. This multi-purpose template can be used in various situations. Grab these presentation templates today.
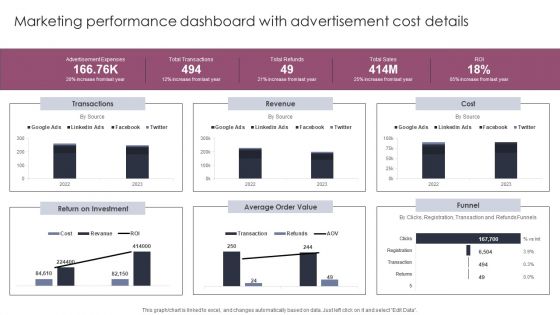
Marketing Performance Dashboard With Advertisement Stages To Develop Demand Generation Tactics Themes PDF
Explore a selection of the finest Marketing Performance Dashboard With Advertisement Stages To Develop Demand Generation Tactics Themes PDF here. With a plethora of professionally designed and pre-made slide templates, you can quickly and easily find the right one for your upcoming presentation. You can use our Marketing Performance Dashboard With Advertisement Stages To Develop Demand Generation Tactics Themes PDF to effectively convey your message to a wider audience. Slidegeeks has done a lot of research before preparing these presentation templates. The content can be personalized and the slides are highly editable. Grab templates today from Slidegeeks.
Optimizing AI Strategies To Improve Financial Services Digital Media Tracking Dashboard Professional PDF
This slide covers the digital marketing dashboard along with the lead breakdown, google analytics traffic, and social media channels. Do you know about Slidesgeeks Optimizing AI Strategies To Improve Financial Services Digital Media Tracking Dashboard Professional PDF These are perfect for delivering any kind od presentation. Using it, create PowerPoint presentations that communicate your ideas and engage audiences. Save time and effort by using our pre designed presentation templates that are perfect for a wide range of topic. Our vast selection of designs covers a range of styles, from creative to business, and are all highly customizable and easy to edit. Download as a PowerPoint template or use them as Google Slides themes.
Product Branding Performance Tracking Dashboard Ppt PowerPoint Presentation File Styles PDF
This slide provides information regarding product branding performance tracking dashboard in terms of revenues, new customers, customer satisfaction rate. Retrieve professionally designed Product Branding Performance Tracking Dashboard Ppt PowerPoint Presentation File Styles PDF to effectively convey your message and captivate your listeners. Save time by selecting pre made slideshows that are appropriate for various topics, from business to educational purposes. These themes come in many different styles, from creative to corporate, and all of them are easily adjustable and can be edited quickly. Access them as PowerPoint templates or as Google Slides themes. You don not have to go on a hunt for the perfect presentation because Slidegeeks got you covered from everywhere.
Corporate Product And Overall Product Branding Performance Tracking Dashboard Summary PDF
This slide provides information regarding product branding performance tracking dashboard in terms of revenues, new customers, customer satisfaction rate. Do you know about Slidesgeeks Corporate Product And Overall Product Branding Performance Tracking Dashboard Summary PDF These are perfect for delivering any kind od presentation. Using it, create PowerPoint presentations that communicate your ideas and engage audiences. Save time and effort by using our pre-designed presentation templates that are perfect for a wide range of topic. Our vast selection of designs covers a range of styles, from creative to business, and are all highly customizable and easy to edit. Download as a PowerPoint template or use them as Google Slides themes.

Marketing And Sales Qualified Lead MQL Dashboard Of Telecom Industry Ppt Outline PDF
This slide represents dashboard showing marketing and sales qualified leads generation for telecom industry. It shows details related to average daily opportunities by role, by representatives etc. Presenting Marketing And Sales Qualified Lead MQL Dashboard Of Telecom Industry Ppt Outline PDF to dispense important information. This template comprises one stages. It also presents valuable insights into the topics including Average Daily, Opportunities By Role, Select Users, Committed Deals. This is a completely customizable PowerPoint theme that can be put to use immediately. So, download it and address the topic impactfully.
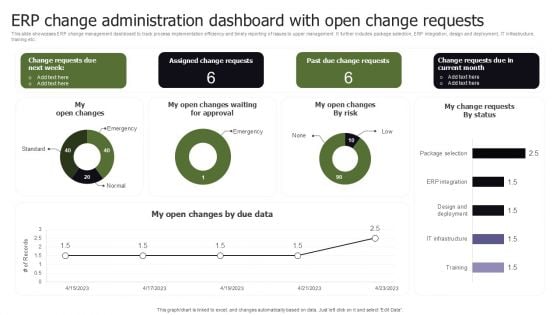
ERP Change Administration Dashboard With Open Change Requests Wd Topics PDF
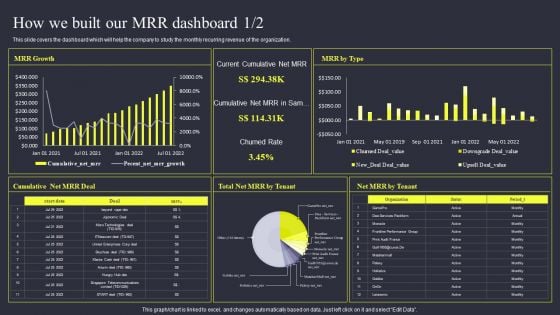
Strategies To Enhance Managed Service Business How We Built Our MRR Dashboard Introduction PDF
This slide covers the dashboard which will help the company to study the monthly recurring revenue of the organization. Welcome to our selection of the Strategies To Enhance Managed Service Business How We Built Our MRR Dashboard Introduction PDF. These are designed to help you showcase your creativity and bring your sphere to life. Planning and Innovation are essential for any business that is just starting out. This collection contains the designs that you need for your everyday presentations. All of our PowerPoints are 100 percent editable, so you can customize them to suit your needs. This multi purpose template can be used in various situations. Grab these presentation templates today.
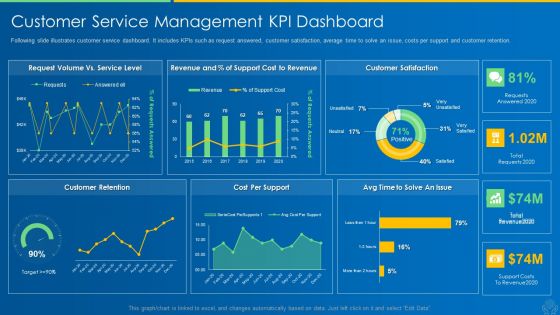
AI And ML Driving Monetary Value For Organization Customer Service Management Kpi Dashboard Formats PDF
Following slide illustrates customer service dashboard. It includes KPIs such as request answered, customer satisfaction, average time to solve an issue, costs per support and customer retention. Deliver and pitch your topic in the best possible manner with this ai and ml driving monetary value for organization customer service management kpi dashboard formats pdf. Use them to share invaluable insights on customer retention, cost per support, customer satisfaction, cost to revenue and impress your audience. This template can be altered and modified as per your expectations. So, grab it now.
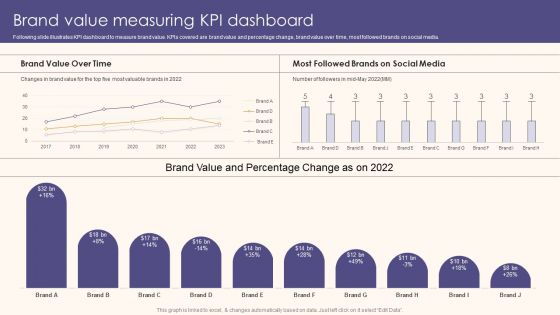
Brand Value Measuring KPI Dashboard Guide To Understand Evaluate And Enhance Brand Value Slides PDF
Following slide illustrates KPI dashboard to measure brand value. KPIs covered are brand value and percentage change, brand value over time, most followed brands on social media.Take your projects to the next level with our ultimate collection of Brand Value Measuring KPI Dashboard Guide To Understand Evaluate And Enhance Brand Value Slides PDF. Slidegeeks has designed a range of layouts that are perfect for representing task or activity duration, keeping track of all your deadlines at a glance. Tailor these designs to your exact needs and give them a truly corporate look with your own brand colors they all make your projects stand out from the rest
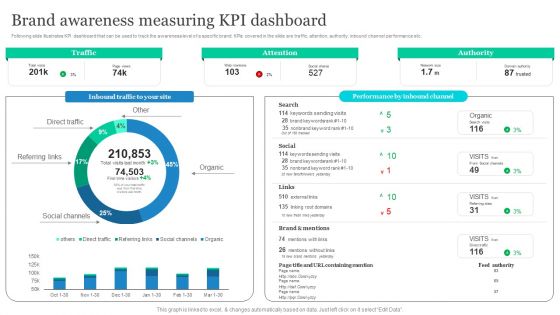
Effective Product Positioning Approach Brand Awareness Measuring Kpi Dashboard Ideas PDF
Following slide illustrates KPI dashboard that can be used to track the awareness level of a specific brand. KPIs covered in the slide are traffic, attention, authority, inbound channel performance etc. Boost your pitch with our creative Effective Product Positioning Approach Brand Awareness Measuring Kpi Dashboard Ideas PDF. Deliver an awe-inspiring pitch that will mesmerize everyone. Using these presentation templates you will surely catch everyones attention. You can browse the ppts collection on our website. We have researchers who are experts at creating the right content for the templates. So you do not have to invest time in any additional work. Just grab the template now and use them.
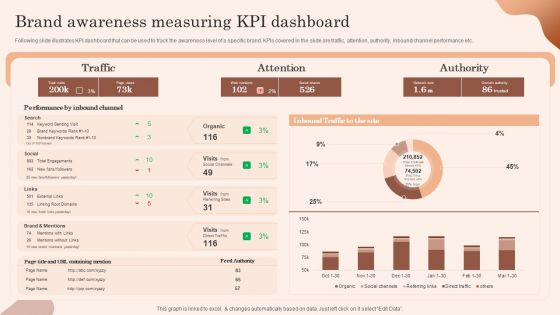
Building Market Brand Leadership Strategies Brand Awareness Measuring Kpi Dashboard Structure PDF
Following slide illustrates KPI dashboard that can be used to track the awareness level of a specific brand. KPIs covered in the slide are traffic, attention, authority, inbound channel performance etc. Boost your pitch with our creative Building Market Brand Leadership Strategies Brand Awareness Measuring Kpi Dashboard Structure PDF. Deliver an awe-inspiring pitch that will mesmerize everyone. Using these presentation templates you will surely catch everyones attention. You can browse the ppts collection on our website. We have researchers who are experts at creating the right content for the templates. So you do not have to invest time in any additional work. Just grab the template now and use them.
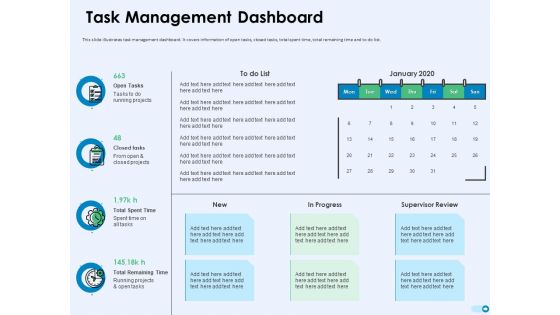
Tools For Prioritization Task Management Dashboard Ppt PowerPoint Presentation Visual Aids Outline PDF
This slide illustrates task management dashboard. It covers information of open tasks, closed tasks, total spent time, total remaining time and to do list. Deliver an awe-inspiring pitch with this creative tools for prioritization task management dashboard ppt powerpoint presentation visual aids outline pdf bundle. Topics like open tasks, closed tasks, total spent time, total remaining time, tasks running projects, spent time all tasks, running projects and open tasks can be discussed with this completely editable template. It is available for immediate download depending on the needs and requirements of the user.
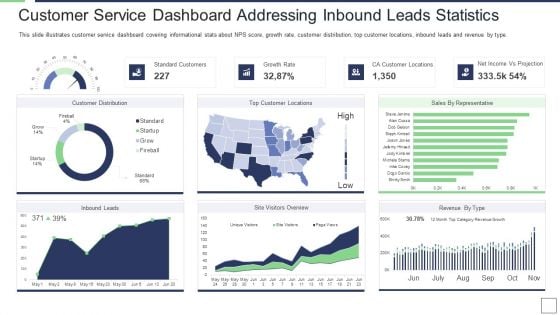
IT Service Incorporation And Administration Customer Service Dashboard Addressing Inbound Leads Statistics Clipart PDF
This slide illustrates customer service dashboard covering informational stats about NPS score, growth rate, customer distribution, top customer locations, inbound leads and revenue by type. Deliver an awe inspiring pitch with this creative it service incorporation and administration customer service dashboard addressing inbound leads statistics clipart pdf bundle. Topics like standard customers, growth rate, net income vs projection, ca customer locations can be discussed with this completely editable template. It is available for immediate download depending on the needs and requirements of the user.
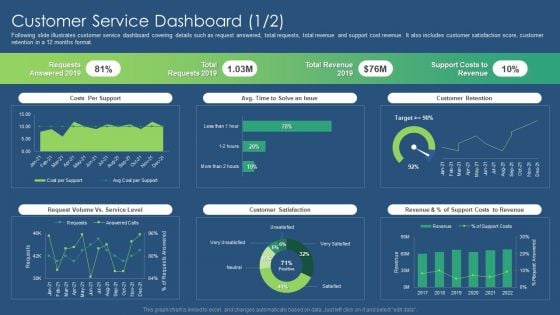
Sustainability Calculation With KPI Customer Service Dashboard Revenue Ideas PDF Graphics PDF
Following slide illustrates customer service dashboard covering details such as request answered, total requests, total revenue and support cost revenue. It also includes customer satisfaction score, customer retention in a 12 months format. Deliver and pitch your topic in the best possible manner with this sustainability calculation with kpi customer service dashboard microsoft pdf. Use them to share invaluable insights on customer satisfaction, revenue, customer retention and impress your audience. This template can be altered and modified as per your expectations. So, grab it now.
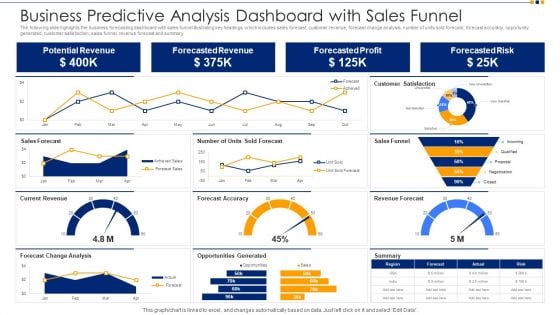
Business Predictive Analysis Dashboard With Sales Funnel Ppt Show Images PDF
The following slide highlights the business forecasting dashboard with sales funnel illustrating key headings which includes sales forecast, customer revenue, forecast change analysis, number of units sold forecast, forecast accuracy, opportunity generated, customer satisfaction, sales funnel, revenue forecast and summary. Pitch your topic with ease and precision using this business predictive analysis dashboard with sales funnel ppt show images pdf. This layout presents information on potential revenue, forecasted revenue, forecasted profit, forecasted risk. It is also available for immediate download and adjustment. So, changes can be made in the color, design, graphics or any other component to create a unique layout.
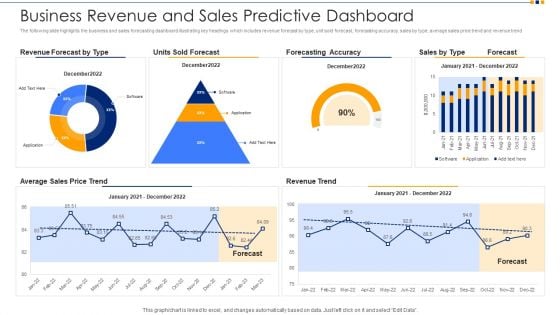
Business Revenue And Sales Predictive Dashboard Ppt Inspiration Background Designs PDF
The following slide highlights the business and sales forecasting dashboard illustrating key headings which includes revenue forecast by type, unit sold forecast, forecasting accuracy, sales by type, average sales price trend and revenue trend. Pitch your topic with ease and precision using this business revenue and sales predictive dashboard ppt inspiration background designs pdf. This layout presents information on revenue forecast by type, units sold forecast, forecasting accuracy, average sales price trend, revenue trend. It is also available for immediate download and adjustment. So, changes can be made in the color, design, graphics or any other component to create a unique layout.
Guide For Software Developers KPI Dashboard For Tracking Project Team Performance Guidelines PDF
Following slide illustrates performance monitoring dashboard that can be used by managers to track their developers team efficiency. It also includes details about billable and non-billable hours along with task summary. Deliver an awe inspiring pitch with this creative guide for software developers kpi dashboard for tracking project team performance guidelines pdf bundle. Topics like task milestone, employee productivity, estimated time, actual time can be discussed with this completely editable template. It is available for immediate download depending on the needs and requirements of the user.
Software Developer Playbook Kpi Dashboard For Tracking Project Team Performance Guidelines PDF
Following slide illustrates performance monitoring dashboard that can be used by managers to track their developers team efficiency. It also includes details about billable and non-billable hours along with task summary. Deliver an awe inspiring pitch with this creative software developer playbook kpi dashboard for tracking project team performance guidelines pdf bundle. Topics like task milestone, employee productivity, estimated time, actual time can be discussed with this completely editable template. It is available for immediate download depending on the needs and requirements of the user.
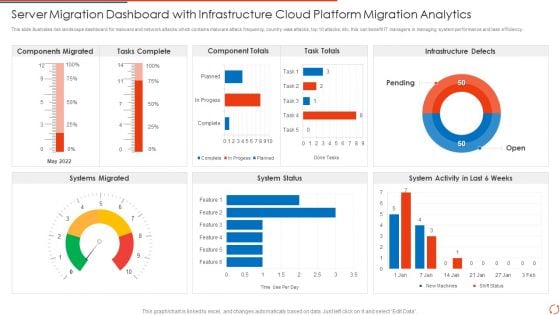
Server Migration Dashboard With Infrastructure Cloud Platform Migration Analytics Elements PDF Portrait PDF
This slide illustrates risk landscape dashboard for malware and network attacks which contains malware attack frequency, country wise attacks, top 10 attacks, etc. this can benefit IT managers in managing system performance and task efficiency Pitch your topic with ease and precision using this Server Migration Dashboard With Infrastructure Cloud Platform Migration Analytics Elements PDF Portrait PDF. This layout presents information on Tasks Complete, Component Totals, Task Totals. It is also available for immediate download and adjustment. So, changes can be made in the color, design, graphics or any other component to create a unique layout.
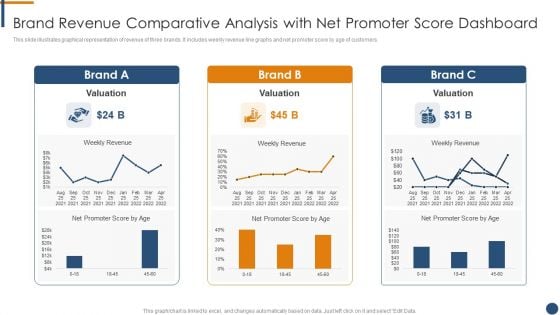
Brand Revenue Comparative Analysis With Net Promoter Score Dashboard Mockup PDF
This slide illustrates graphical representation of revenue of three brands. It includes weekly revenue line graphs and net promoter score by age of customers.Pitch your topic with ease and precision using this Brand Revenue Comparative Analysis With Net Promoter Score Dashboard Mockup PDF. This layout presents information on Brand Revenue Comparative Analysis With Net Promoter Score Dashboard. It is also available for immediate download and adjustment. So, changes can be made in the color, design, graphics or any other component to create a unique layout.
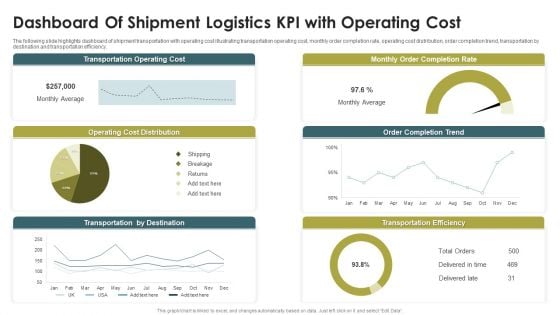
Dashboard Of Shipment Logistics KPI With Operating Cost Ppt Styles Example Topics PDF
The following slide highlights dashboard of shipment transportation with operating cost illustrating transportation operating cost, monthly order completion rate, operating cost distribution, order completion trend, transportation by destination and transportation efficiency. Showcasing this set of slides titled Dashboard Of Shipment Logistics KPI With Operating Cost Ppt Styles Example Topics PDF. The topics addressed in these templates are Transportation Operating Cost, Monthly Order, Completion Rate, Operating Cost Distribution. All the content presented in this PPT design is completely editable. Download it and make adjustments in color, background, font etc. as per your unique business setting.
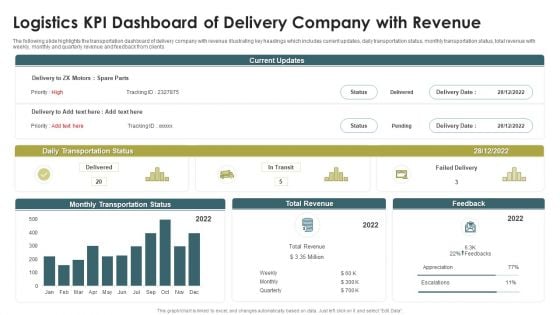
Logistics KPI Dashboard Of Delivery Company With Revenue Ppt Show PDF
The following slide highlights the transportation dashboard of delivery company with revenue illustrating key headings which includes current updates, daily transportation status, monthly transportation status, total revenue with weekly, monthly and quarterly revenue and feedback from clients. Showcasing this set of slides titled Logistics KPI Dashboard Of Delivery Company With Revenue Ppt Show PDF. The topics addressed in these templates are Daily Transportation Status, Monthly Transportation Status, Total Revenue. All the content presented in this PPT design is completely editable. Download it and make adjustments in color, background, font etc. as per your unique business setting.
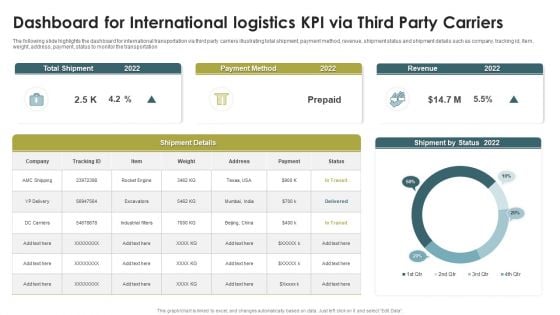
Dashboard For International Logistics KPI Via Third Party Carriers Rules PDF
The following slide highlights the dashboard for international transportation via third party carriers illustrating total shipment, payment method, revenue, shipment status and shipment details such as company, tracking id, Item, weight, address, payment, status to monitor the transportation. Showcasing this set of slides titled Dashboard For International Logistics KPI Via Third Party Carriers Rules PDF. The topics addressed in these templates are Total Shipment, Payment Method, Revenue, 20. All the content presented in this PPT design is completely editable. Download it and make adjustments in color, background, font etc. as per your unique business setting.
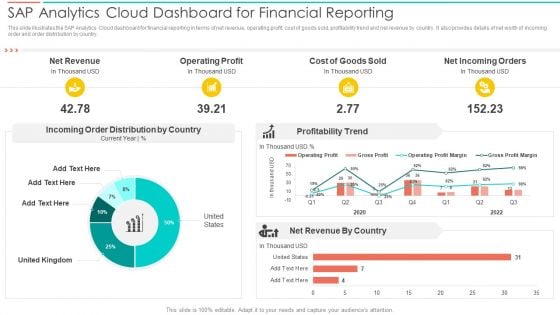
SAC Planning And Implementation SAP Analytics Cloud Dashboard For Financial Reporting Introduction PDF
This slide illustrates the SAP Analytics Cloud dashboard for financial reporting in terms of net revenue, operating profit, cost of goods sold, profitability trend and net revenue by country. It also provides details of net worth of incoming order and order distribution by country. Deliver an awe inspiring pitch with this creative SAC Planning And Implementation SAP Analytics Cloud Dashboard For Financial Reporting Introduction PDF bundle. Topics like Net Revenue, Operating Profit, Cost Goods Sold can be discussed with this completely editable template. It is available for immediate download depending on the needs and requirements of the user.
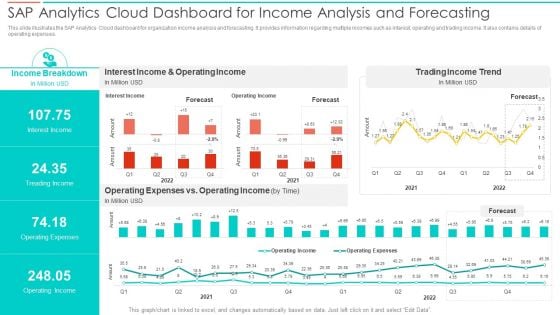
SAC Planning And Implementation SAP Analytics Cloud Dashboard For Income Analysis Summary PDF
This slide illustrates the SAP Analytics Cloud dashboard for organization income analysis and forecasting. It provides information regarding multiple incomes such as interest, operating and trading income. It also contains details of operating expenses. Deliver an awe inspiring pitch with this creative SAC Planning And Implementation SAP Analytics Cloud Dashboard For Income Analysis Summary PDF bundle. Topics like Income Breakdown, Interest Income, Operating Income, Trading Income Trend can be discussed with this completely editable template. It is available for immediate download depending on the needs and requirements of the user.
SAC Planning And Implementation SAP Analytics Cloud Dashboard For Product Sales Analysis Icons PDF
This slide illustrates the SAP Analytics Cloud dashboard to monitor product sales performance. It provides information regarding the gross margin and net revenue earned, product performance state wise and year wise. Deliver and pitch your topic in the best possible manner with this SAC Planning And Implementation SAP Analytics Cloud Dashboard For Product Sales Analysis Icons PDF. Use them to share invaluable insights on Gross Margin, Earned Quarter Wise, Gross Margin, Net Revenue and impress your audience. This template can be altered and modified as per your expectations. So, grab it now.
Product Launch Time Project Dashboard With Average Delay Ppt Infographic Template Icon PDF
The following slide highlights the time to market dashboard with average delay illustrating projects completed on time, projects delayed, projects cancelled, completion rate vs Time and project types by new product, major feature release, medium feature release and minor feature release. Showcasing this set of slides titled Product Launch Time Project Dashboard With Average Delay Ppt Infographic Template Icon PDF. The topics addressed in these templates are Projects Completed Time, Projects Delayed, Projects Cancelled. All the content presented in this PPT design is completely editable. Download it and make adjustments in color, background, font etc. as per your unique business setting.
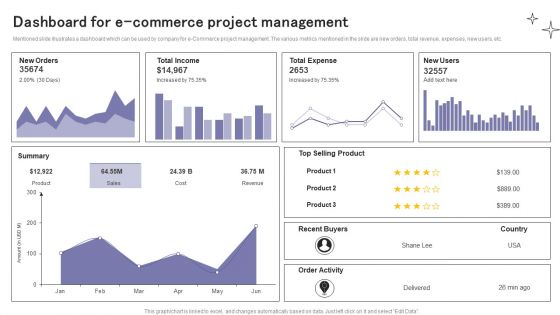
Dashboard For E Commerce Project Management Ppt Ideas Design Inspiration PDF
Mentioned slide illustrates a dashboard which can be used by company for e-Commerce project management. The various metrics mentioned in the slide are new orders, total revenue, expenses, new users, etc. Showcasing this set of slides titled Dashboard For E Commerce Project Management Ppt Ideas Design Inspiration PDF. The topics addressed in these templates are New Orders, Total Income, Total Expense. All the content presented in this PPT design is completely editable. Download it and make adjustments in color, background, font etc. as per your unique business setting.
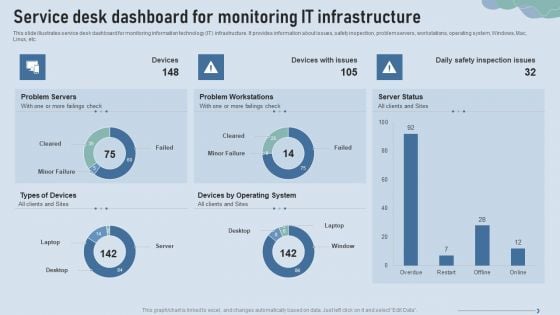
Improve IT Service Desk Service Desk Dashboard For Monitoring IT Infrastructure Introduction PDF
This slide illustrates service desk dashboard for monitoring information technology IT infrastructure. It provides information about issues, safety inspection, problem servers, workstations, operating system, Windows, Mac, Linux, etc.Deliver and pitch your topic in the best possible manner with this Improve IT Service Desk Service Desk Dashboard For Monitoring IT Infrastructure Introduction PDF. Use them to share invaluable insights on Problem Servers, Problem Workstations, Operating System and impress your audience. This template can be altered and modified as per your expectations. So, grab it now.
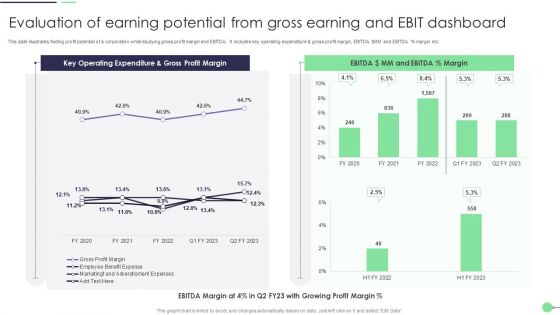
Evaluation Of Earning Potential From Gross Earning And Ebit Dashboard Professional PDF
This slide illustrates finding profit potential of a corporation while studying gross profit margin and EBITDA. It includes key operating expenditure and gross profit margin, EBITDA dollar MM and EBITDA percent margin etc. Showcasing this set of slides titled Evaluation Of Earning Potential From Gross Earning And Ebit Dashboard Professional PDF. The topics addressed in these templates are Evaluation Of Earning Potential, Gross Earning, Ebit Dashboard. All the content presented in this PPT design is completely editable. Download it and make adjustments in color, background, font etc. as per your unique business setting.
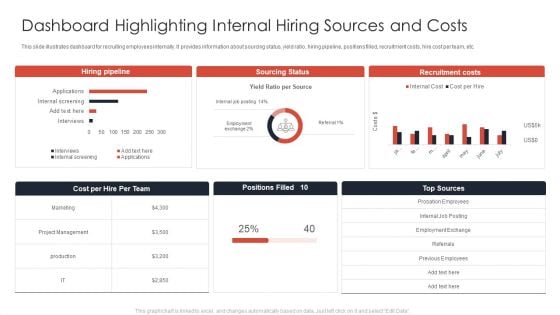
Dashboard Highlighting Internal Hiring Sources And Costs Ppt Show Templates PDF
This slide illustrates dashboard for recruiting employees internally. It provides information about sourcing status, yield ratio, hiring pipeline, positions filled, recruitment costs, hire cost per team, etc. Showcasing this set of slides titled Dashboard Highlighting Internal Hiring Sources And Costs Ppt Show Templates PDF. The topics addressed in these templates are Hiring Pipeline, Sourcing Status, Recruitment Costs. All the content presented in this PPT design is completely editable. Download it and make adjustments in color, background, font etc. as per your unique business setting.
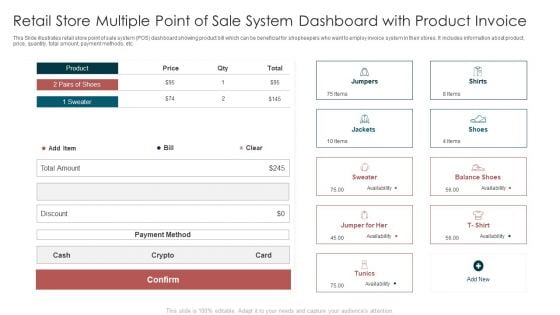
Retail Store Multiple Point Of Sale System Dashboard With Product Invoice Inspiration PDF
This Slide illustrates retail store point of sale system POS dashboard showing product bill which can be beneficial for shopkeepers who want to employ invoice system in their stores. It includes information about product, price, quantity, total amount, payment methods, etc. Pitch your topic with ease and precision using this Retail Store Multiple Point Of Sale System Dashboard With Product Invoice Inspiration PDF. This layout presents information on Payment Method, Product, Availability. It is also available for immediate download and adjustment. So, changes can be made in the color, design, graphics or any other component to create a unique layout.
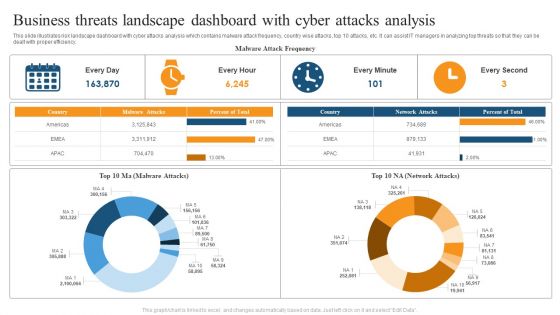
Business Threats Landscape Dashboard With Cyber Attacks Analysis Ppt Summary Brochure PDF
This slide illustrates risk landscape dashboard with cyber attacks analysis which contains malware attack frequency, country wise attacks, top 10 attacks, etc. It can assist IT managers in analyzing top threats so that they can be dealt with proper efficiency. Pitch your topic with ease and precision using this Business Threats Landscape Dashboard With Cyber Attacks Analysis Ppt Summary Brochure PDF. This layout presents information on Malware Attack Frequency, Every Minute, Every Second. It is also available for immediate download and adjustment. So, changes can be made in the color, design, graphics or any other component to create a unique layout.
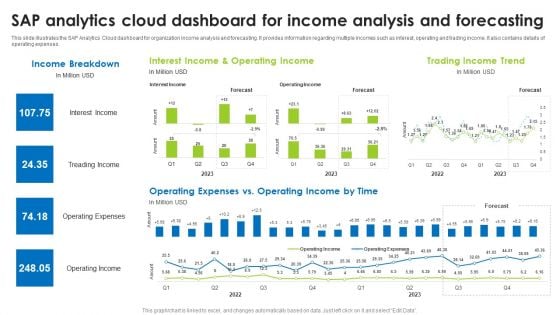
Sap Analytics Cloud Dashboard For Income Analysis And Forecasting Formats PDF
This slide illustrates the SAP Analytics Cloud dashboard for organization income analysis and forecasting. It provides information regarding multiple incomes such as interest, operating and trading income. It also contains details of operating expenses. The best PPT templates are a great way to save time, energy, and resources. Slidegeeks have 100 percent editable powerpoint slides making them incredibly versatile. With these quality presentation templates, you can create a captivating and memorable presentation by combining visually appealing slides and effectively communicating your message. Download Sap Analytics Cloud Dashboard To Asses Digital Marketing Campaigns Performance Ideas PDF from Slidegeeks and deliver a wonderful presentation.
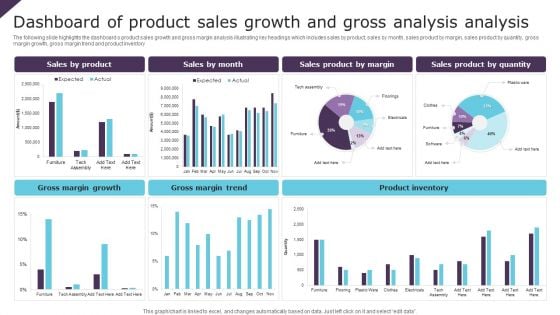
Dashboard Of Product Sales Growth And Gross Analysis Analysis Ppt Styles Good PDF
The following slide highlights the dashboard o product sales growth and gross margin analysis illustrating key headings which includes sales by product, sales by month, sales product by margin, sales product by quantity, gross margin growth, gross margin trend and product inventory. Showcasing this set of slides titled Dashboard Of Product Sales Growth And Gross Analysis Analysis Ppt Styles Good PDF. The topics addressed in these templates are Gross Margin Growth, Gross Margin Trend, Product Inventory. All the content presented in this PPT design is completely editable. Download it and make adjustments in color, background, font etc. as per your unique business setting.
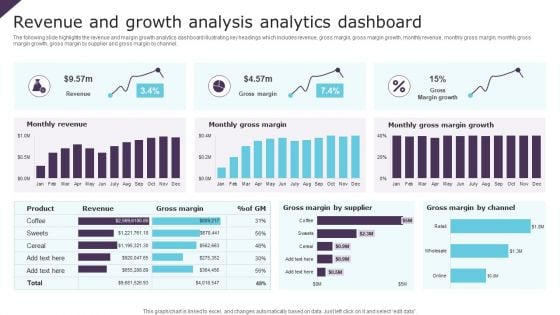
Revenue And Growth Analysis Analytics Dashboard Ppt Infographic Template Brochure PDF
The following slide highlights the revenue and margin growth analytics dashboard illustrating key headings which includes revenue, gross margin, gross margin growth, monthly revenue, monthly gross margin, monthly gross margin growth, gross margin by supplier and gross margin by channel. Pitch your topic with ease and precision using this Revenue And Growth Analysis Analytics Dashboard Ppt Infographic Template Brochure PDF. This layout presents information on Monthly Revenue, Monthly Gross Margin, Gross Margin Growth. It is also available for immediate download and adjustment. So, changes can be made in the color, design, graphics or any other component to create a unique layout.
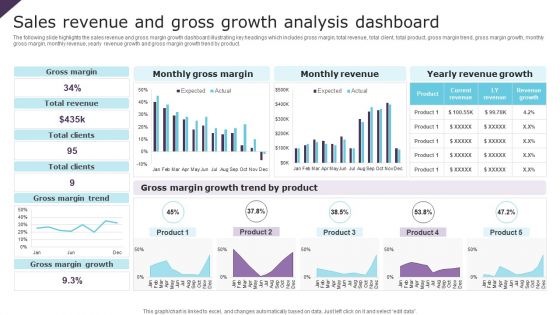
Sales Revenue And Gross Growth Analysis Dashboard Ppt Inspiration Background Image PDF
The following slide highlights the sales revenue and gross margin growth dashboard illustrating key headings which includes gross margin, total revenue, total client, total product, gross margin trend, gross margin growth, monthly gross margin, monthly revenue, yearly revenue growth and gross margin growth trend by product. Showcasing this set of slides titled Sales Revenue And Gross Growth Analysis Dashboard Ppt Inspiration Background Image PDF. The topics addressed in these templates are Gross Margin, Total Revenue, Total Clients. All the content presented in this PPT design is completely editable. Download it and make adjustments in color, background, font etc. as per your unique business setting.
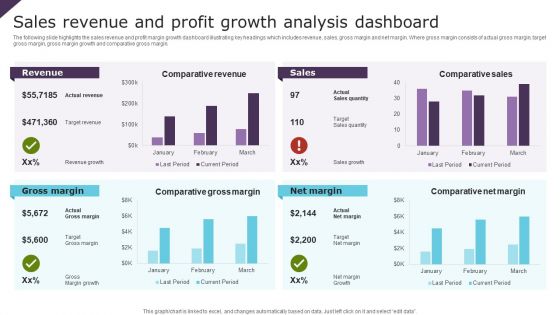
Sales Revenue And Profit Growth Analysis Dashboard Ppt Portfolio Slide PDF
The following slide highlights the sales revenue and profit margin growth dashboard illustrating key headings which includes revenue, sales, gross margin and net margin. Where gross margin consists of actual gross margin, target gross margin, gross margin growth and comparative gross margin. Showcasing this set of slides titled Sales Revenue And Profit Growth Analysis Dashboard Ppt Portfolio Slide PDF. The topics addressed in these templates are Revenue, Sales, Gross Margin, Net Margin. All the content presented in this PPT design is completely editable. Download it and make adjustments in color, background, font etc. as per your unique business setting.
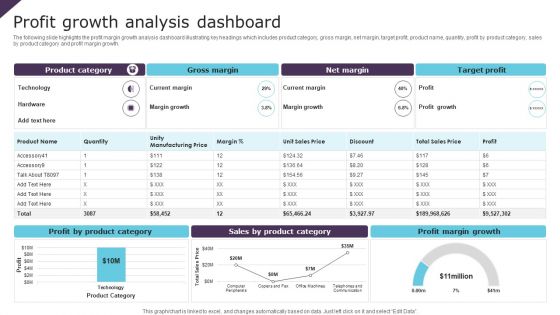
Profit Growth Analysis Dashboard Ppt PowerPoint Presentation File Design Templates PDF
The following slide highlights the profit margin growth analysis dashboard illustrating key headings which includes product category, gross margin, net margin, target profit, product name, quantity, profit by product category, sales by product category and profit margin growth. Showcasing this set of slides titled Profit Growth Analysis Dashboard Ppt PowerPoint Presentation File Design Templates PDF. The topics addressed in these templates are Gross Margin, Net Margin, Target Profit. All the content presented in this PPT design is completely editable. Download it and make adjustments in color, background, font etc. as per your unique business setting.
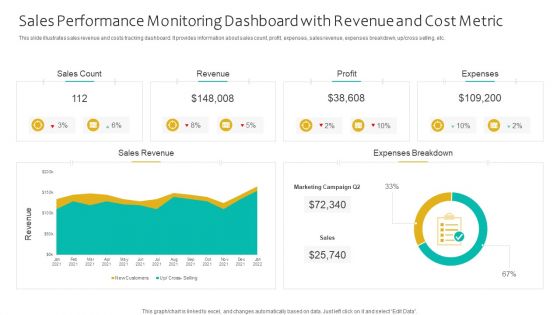
Sales Performance Monitoring Dashboard With Revenue And Cost Metric Ppt Portfolio Good PDF
This slide illustrates sales revenue and costs tracking dashboard. It provides information about sales count, profit, expenses, sales revenue, expenses breakdown, up or cross selling, etc. Showcasing this set of slides titled Sales Performance Monitoring Dashboard With Revenue And Cost Metric Ppt Portfolio Good PDF. The topics addressed in these templates are Sales Count, Revenue, Profit, Expenses. All the content presented in this PPT design is completely editable. Download it and make adjustments in color, background, font etc. as per your unique business setting.
Robotic Process Automation Metrics Dashboard For Tracking Business Return On Investment Information PDF
This slide illustrates KPI Dashboard for measuring time and money saved after RPA deployment. It also include metrics for analysis such as productivity in robot hours, hours saved per process, money saved per process, etc. Pitch your topic with ease and precision using this Robotic Process Automation Metrics Dashboard For Tracking Business Return On Investment Information PDF. This layout presents information on Management, Goal, Productivity. It is also available for immediate download and adjustment. So, changes can be made in the color, design, graphics or any other component to create a unique layout.
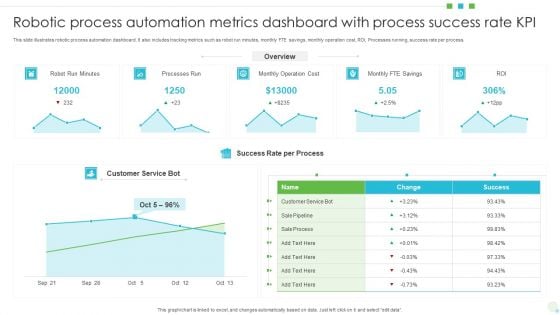
Robotic Process Automation Metrics Dashboard With Process Success Rate KPI Professional PDF
This slide illustrates robotic process automation dashboard. It also includes tracking metrics such as robot run minutes, monthly FTE savings, monthly operation cost, ROI, Processes running, success rate per process. Showcasing this set of slides titled Robotic Process Automation Metrics Dashboard With Process Success Rate KPI Professional PDF The topics addressed in these templates are Processes Run, Monthly Operation Cost, Customer Service Bot. All the content presented in this PPT design is completely editable. Download it and make adjustments in color, background, font etc. as per your unique business setting.
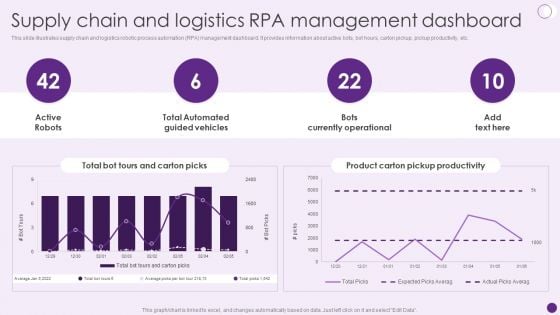
Supply Chain And Logistics Rpa Management Dashboard Deploying Automation To Enhance Diagrams PDF
This slide illustrates supply chain and logistics robotic process automation RPA management dashboard. It provides information about active bots, bot hours, carton pickup, pickup productivity, etc. Boost your pitch with our creative Supply Chain And Logistics Rpa Management Dashboard Deploying Automation To Enhance Diagrams PDF. Deliver an awe-inspiring pitch that will mesmerize everyone. Using these presentation templates you will surely catch everyones attention. You can browse the ppts collection on our website. We have researchers who are experts at creating the right content for the templates. So you do not have to invest time in any additional work. Just grab the template now and use them.


 Continue with Email

 Home
Home


