Total Cost
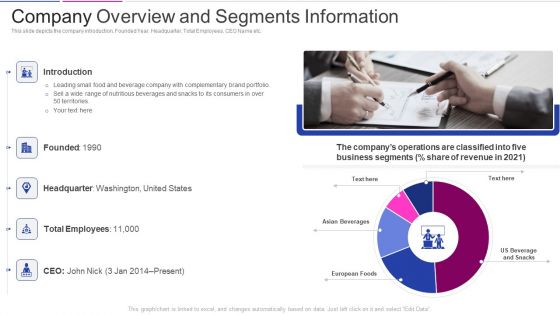
Fundraising From Corporate Investment Company Overview And Segments Information Elements PDF
This slide depicts the company introduction, Founded Year, Headquarter, Total Employees, CEO Name etc. Deliver and pitch your topic in the best possible manner with this fundraising from corporate investment company overview and segments information elements pdf. Use them to share invaluable insights on introduction, total employees, headquarter, ceo and impress your audience. This template can be altered and modified as per your expectations. So, grab it now.
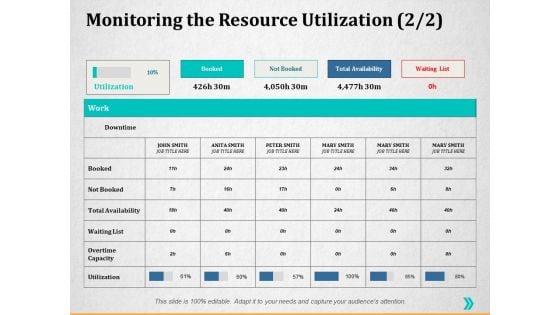
Monitoring The Resource Utilization Overtime Capacity Ppt PowerPoint Presentation Visual Aids Diagrams
This is a monitoring the resource utilization overtime capacity ppt powerpoint presentation visual aids diagrams. This is a five stage process. The stages in this process are utilization, overtime capacity, total availability.
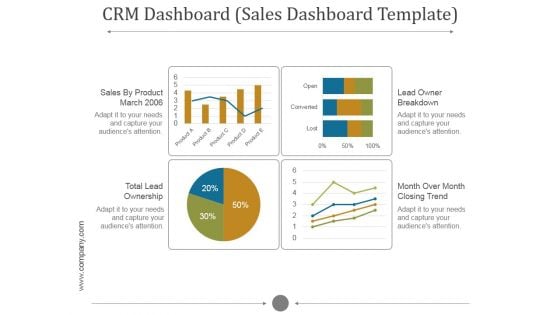
Crm Dashboard Sales Dashboard Template Ppt PowerPoint Presentation Inspiration
This is a crm dashboard sales dashboard template ppt powerpoint presentation inspiration. This is a five stage process. The stages in this process are sales by product march, lead owner breakdown, total lead ownership, month over month closing trend.

Balance Sheet Kpis Template 1 Ppt PowerPoint Presentation Gallery Ideas
This is a balance sheet kpis template 1 ppt powerpoint presentation gallery ideas. This is a four stage process. The stages in this process are total fixed assets, non current investments, long term loans and advances, current investments, inventories.
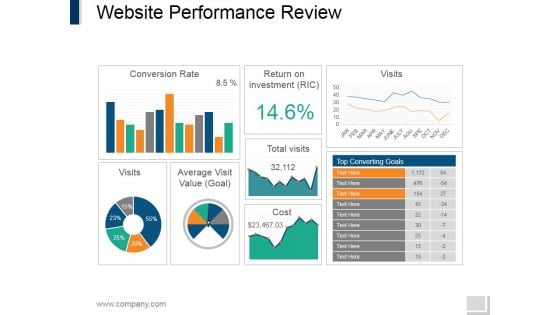
Website Performance Review Template 2 Ppt PowerPoint Presentation Infographics Vector
This is a website performance review template 2 ppt powerpoint presentation infographics vector. This is a three stage process. The stages in this process are conversion rate, return on investment, visits, average visit value, total visits.
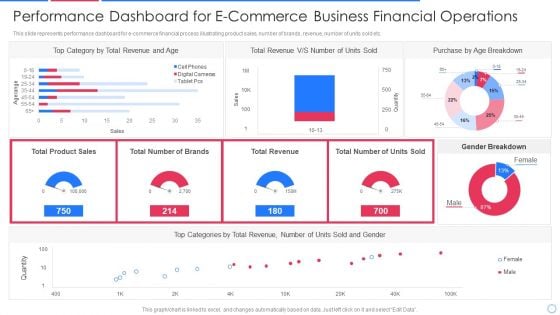
Performance Dashboard For E Commerce Business Financial Operations Infographics PDF
This slide represents performance dashboard for e-commerce financial process illustrating product sales, number of brands, revenue, number of units sold etc.Pitch your topic with ease and precision using this performance dashboard for e commerce business financial operations infographics pdf This layout presents information on category by total revenue, total revenue, purchase by age breakdown It is also available for immediate download and adjustment. So, changes can be made in the color, design, graphics or any other component to create a unique layout.
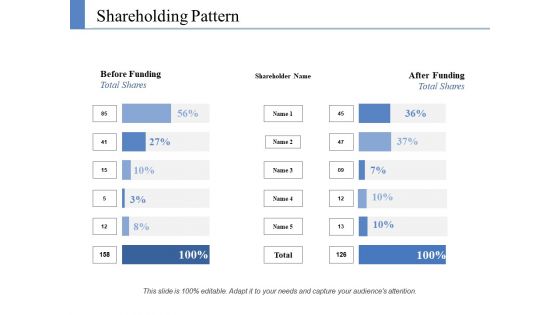
Shareholding Pattern Ppt PowerPoint Presentation Inspiration Smartart
This is a shareholding pattern ppt powerpoint presentation inspiration smartart. This is a two stage process. The stages in this process are before funding, shareholder name, after funding, total shares.
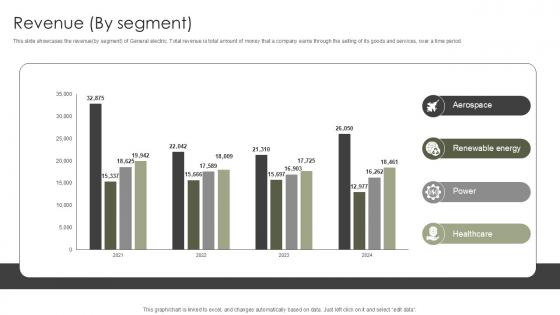
Revenue By Segment Military Aircraft Engine Manufacturing PPT Slide CP SS V
This slide showcases the revenueby segment of General electric. Total revenue is total amount of money that a company earns through the selling of its goods and services, over a time period. Slidegeeks is one of the best resources for PowerPoint templates. You can download easily and regulate Revenue By Segment Military Aircraft Engine Manufacturing PPT Slide CP SS V for your personal presentations from our wonderful collection. A few clicks is all it takes to discover and get the most relevant and appropriate templates. Use our Templates to add a unique zing and appeal to your presentation and meetings. All the slides are easy to edit and you can use them even for advertisement purposes. This slide showcases the revenueby segment of General electric. Total revenue is total amount of money that a company earns through the selling of its goods and services, over a time period.
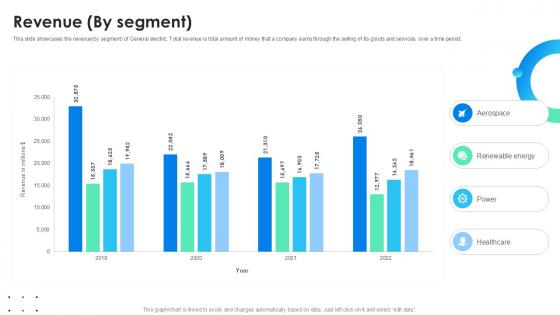
Revenue By Segment Global Energy Company Profile PPT Slide CP SS V
This slide showcases the revenueby segment of General electric. Total revenue is total amount of money that a company earns through the selling of its goods and services, over a time period. Slidegeeks is one of the best resources for PowerPoint templates. You can download easily and regulate Revenue By Segment Global Energy Company Profile PPT Slide CP SS V for your personal presentations from our wonderful collection. A few clicks is all it takes to discover and get the most relevant and appropriate templates. Use our Templates to add a unique zing and appeal to your presentation and meetings. All the slides are easy to edit and you can use them even for advertisement purposes. This slide showcases the revenueby segment of General electric. Total revenue is total amount of money that a company earns through the selling of its goods and services, over a time period.

Funding Updates Equity Ppt PowerPoint Presentation Model Outline
This is a funding updates equity ppt powerpoint presentation model outline. This is a eleven stage process. The stages in this process are shareholding pattern, shareholder name, total shares.
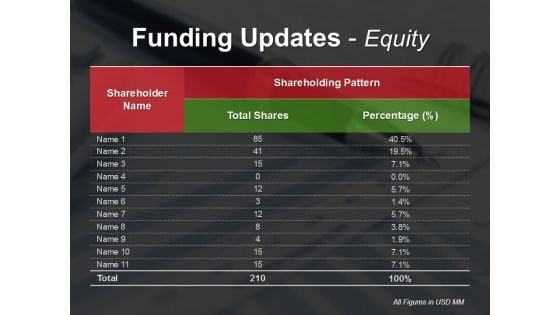
Funding Updates Equity Ppt PowerPoint Presentation Ideas Slide Download
This is a funding updates equity ppt powerpoint presentation ideas slide download. This is a two stage process. The stages in this process are shareholder name, shareholding pattern, total shares, percentage.
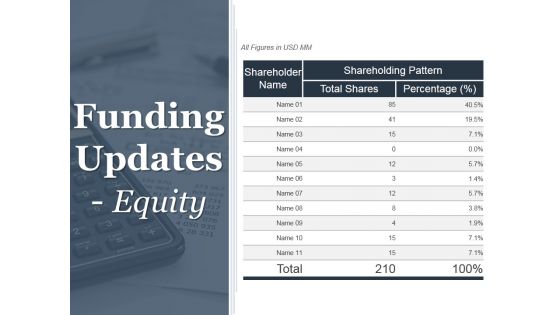
Funding Updates Equity Ppt PowerPoint Presentation Portfolio Tips
This is a funding updates equity ppt powerpoint presentation portfolio tips. This is a three stage process. The stages in this process are shareholder name, total shares, shareholding pattern, percentage.
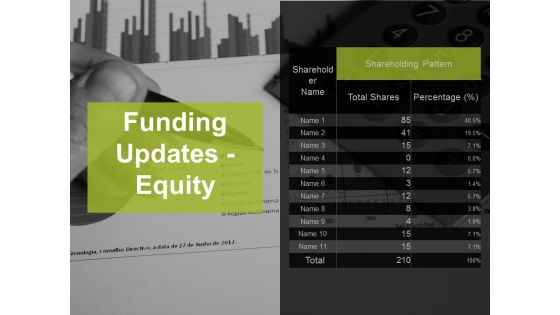
Funding Updates Equity Ppt PowerPoint Presentation Infographic Template Format
This is a funding updates equity ppt powerpoint presentation infographic template format. This is a three stage process. The stages in this process are total shares, percentage, business, marketing, planning.
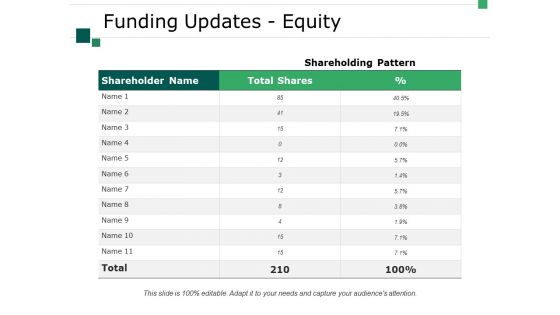
Funding Updates Equity Ppt PowerPoint Presentation Infographic Template Picture
This is a funding updates equity ppt powerpoint presentation infographic template picture. This is a three stage process. The stages in this process are business, marketing, shareholder name, total shares, table.
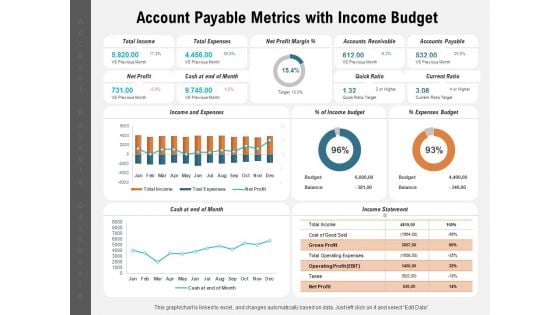
Account Payable Metrics With Income Budget Ppt PowerPoint Presentation Layouts Master Slide PDF
Presenting this set of slides with name account payable metrics with income budget ppt powerpoint presentation layouts master slide pdf. The topics discussed in these slides are total income, total expenses, net profit margin, accounts receivable, accounts payable, net profit, cash at end of month, quick ratio, current ratio, expenses budget, income budget, cash at end of month. This is a completely editable PowerPoint presentation and is available for immediate download. Download now and impress your audience.

Major Milestones Achieved Furniture Manufacturing Firm Investor Funding Ppt Slide
This slide provides glimpse about aspirations achieved by the company including total units manufactured, total units sold, etc. If you are looking for a format to display your unique thoughts, then the professionally designed Major Milestones Achieved Furniture Manufacturing Firm Investor Funding Ppt Slide is the one for you. You can use it as a Google Slides template or a PowerPoint template. Incorporate impressive visuals, symbols, images, and other charts. Modify or reorganize the text boxes as you desire. Experiment with shade schemes and font pairings. Alter, share or cooperate with other people on your work. Download Major Milestones Achieved Furniture Manufacturing Firm Investor Funding Ppt Slide and find out how to give a successful presentation. Present a perfect display to your team and make your presentation unforgettable. This slide provides glimpse about aspirations achieved by the company including total units manufactured, total units sold, etc.
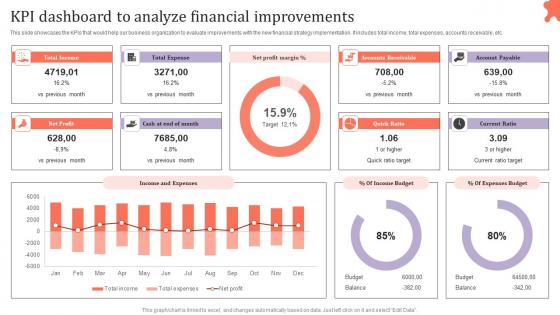
KPI Dashboard To Analyze Financial Assessing Corporate Financial Techniques Clipart Pdf
This slide showcases the KPIs that would help our business organization to evaluate improvements with the new financial strategy implementation. It includes total income, total expenses, accounts receivable, etc. Retrieve professionally designed KPI Dashboard To Analyze Financial Assessing Corporate Financial Techniques Clipart Pdf to effectively convey your message and captivate your listeners. Save time by selecting pre made slideshows that are appropriate for various topics, from business to educational purposes. These themes come in many different styles, from creative to corporate, and all of them are easily adjustable and can be edited quickly. Access them as PowerPoint templates or as Google Slides themes. You do not have to go on a hunt for the perfect presentation because Slidegeeks got you covered from everywhere. This slide showcases the KPIs that would help our business organization to evaluate improvements with the new financial strategy implementation. It includes total income, total expenses, accounts receivable, etc.
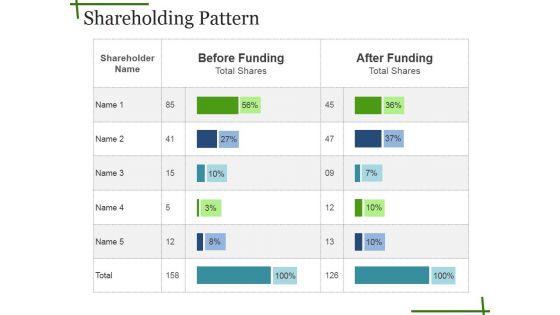
Shareholding Pattern Ppt PowerPoint Presentation Gallery Layouts
This is a shareholding pattern ppt powerpoint presentation gallery layouts. This is a five stage process. The stages in this process are shareholder name, before funding, after funding, total shares.
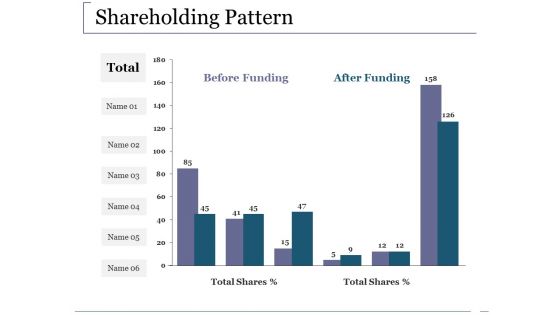
Shareholding Pattern Ppt PowerPoint Presentation Inspiration Outline
This is a shareholding pattern ppt powerpoint presentation inspiration outline. This is a six stage process. The stages in this process are business, marketing, graph, before funding, after funding, total shares, percentage.
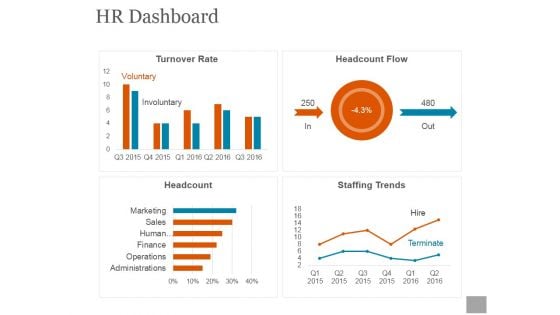
Hr Dashboard Ppt PowerPoint Presentation Shapes
This is a hr dashboard ppt powerpoint presentation shapes. This is a four stage process. The stages in this process are total employees, key metrics, employee churn, open positions by divisions.
Income Statement Kpis Ppt PowerPoint Presentation Icon Background Images
This is a income statement kpis ppt powerpoint presentation icon background images. This is a four stage process. The stages in this process are net sales, other income, expenses, other expenses, total material consumed.

Facebook Marketing Plan KPI Dashboard To Monitor Facebook Marketing Strategy SS V
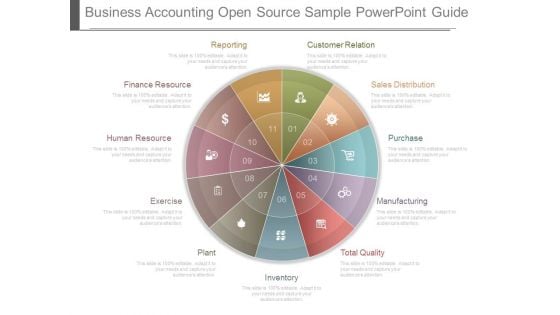
Business Accounting Open Source Sample Powerpoint Guide
This is a business accounting open source sample powerpoint guide. This is a eleven stage process. The stages in this process are reporting, customer relation, sales distribution, purchase, manufacturing, total quality, plant, inventory, exercise, human resource, finance resource.
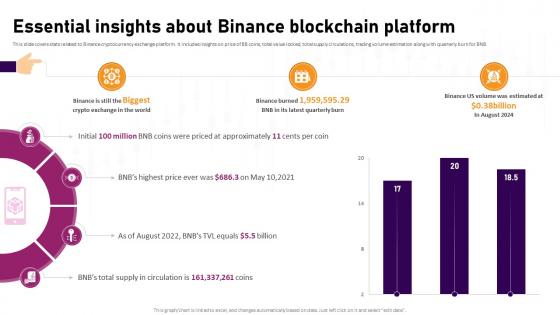
Essential Insights About Binance Blockchain Platform Complete Roadmap To Blockchain BCT SS V
This slide covers stats related to Binance cryptocurrency exchange platform. It includes insights on price of BB coins, total value locked, total supply circulations, trading volume estimation along with quarterly burn for BNB. This Different Layers Present In Blockchain Technology Complete Roadmap To Blockchain BCT SS V is perfect for any presentation, be it in front of clients or colleagues. It is a versatile and stylish solution for organizing your meetings. The Different Layers Present In Blockchain Technology Complete Roadmap To Blockchain BCT SS V features a modern design for your presentation meetings. The adjustable and customizable slides provide unlimited possibilities for acing up your presentation. Slidegeeks has done all the homework before launching the product for you. So, do not wait, grab the presentation templates today This slide covers stats related to Binance cryptocurrency exchange platform. It includes insights on price of BB coins, total value locked, total supply circulations, trading volume estimation along with quarterly burn for BNB.
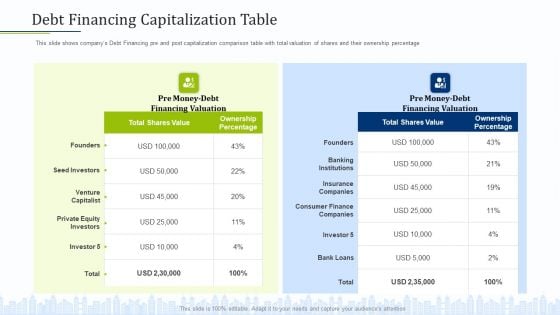
Pitch Deck To Draw External Capital From Commercial Banking Institution Debt Financing Capitalization Table Rules PDF
This slide shows companys Debt Financing pre and post capitalization comparison table with total valuation of shares and their ownership percentage Deliver and pitch your topic in the best possible manner with this pitch deck to draw external capital from commercial banking institution debt financing capitalization table rules pdf. Use them to share invaluable insights on total shares value, ownership percentage, private equity investors and impress your audience. This template can be altered and modified as per your expectations. So, grab it now.
Net Assets Position C2C Ecommerce Platform Company Profile CP SS V
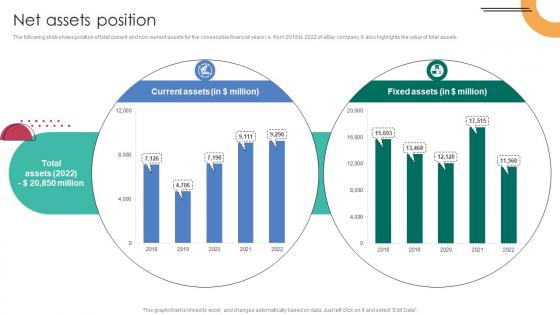
The following slide shows position of total current and non-current assets for five consecutive financial years i.e. from 2018 to 2022 of eBay company. It also highlights the value of total assets. Welcome to our selection of the Net Assets Position C2C Ecommerce Platform Company Profile CP SS V. These are designed to help you showcase your creativity and bring your sphere to life. Planning and Innovation are essential for any business that is just starting out. This collection contains the designs that you need for your everyday presentations. All of our PowerPoints are 100 percent editable, so you can customize them to suit your needs. This multi-purpose template can be used in various situations. Grab these presentation templates today. The following slide shows position of total current and non-current assets for five consecutive financial years i.e. from 2018 to 2022 of eBay company. It also highlights the value of total assets.
Revenue By Region Military Aircraft Engine Manufacturing PPT Example CP SS V
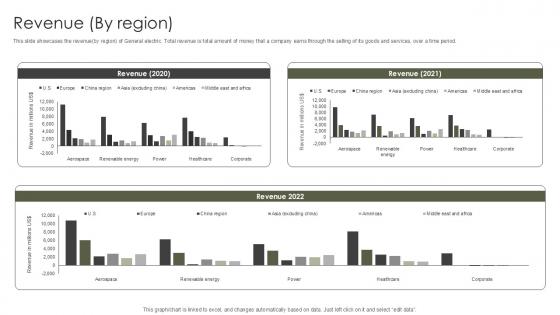
This slide showcases the revenueby region of General electric. Total revenue is total amount of money that a company earns through the selling of its goods and services, over a time period. Create an editable Revenue By Region Military Aircraft Engine Manufacturing PPT Example CP SS V that communicates your idea and engages your audience. Whether you are presenting a business or an educational presentation, pre-designed presentation templates help save time. Revenue By Region Military Aircraft Engine Manufacturing PPT Example CP SS V is highly customizable and very easy to edit, covering many different styles from creative to business presentations. Slidegeeks has creative team members who have crafted amazing templates. So, go and get them without any delay. This slide showcases the revenueby region of General electric. Total revenue is total amount of money that a company earns through the selling of its goods and services, over a time period.
Revenue Military Aircraft Engine Manufacturing PPT PowerPoint CP SS V
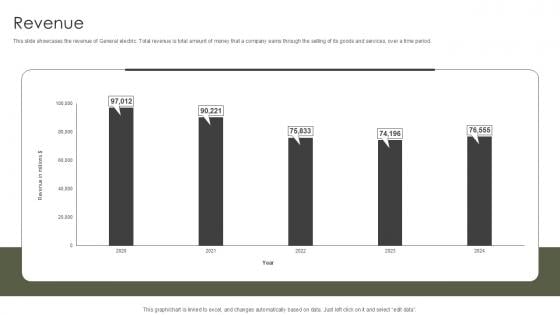
This slide showcases the revenue of General electric. Total revenue is total amount of money that a company earns through the selling of its goods and services, over a time period. Want to ace your presentation in front of a live audience Our Revenue Military Aircraft Engine Manufacturing PPT PowerPoint CP SS V can help you do that by engaging all the users towards you. Slidegeeks experts have put their efforts and expertise into creating these impeccable powerpoint presentations so that you can communicate your ideas clearly. Moreover, all the templates are customizable, and easy-to-edit and downloadable. Use these for both personal and commercial use. This slide showcases the revenue of General electric. Total revenue is total amount of money that a company earns through the selling of its goods and services, over a time period.
Revenue By Region Global Energy Company Profile PPT Sample CP SS V
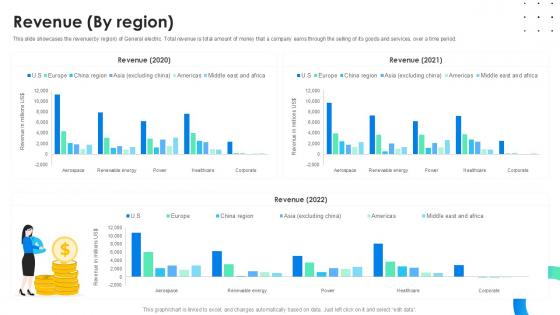
This slide showcases the revenueby region of General electric. Total revenue is total amount of money that a company earns through the selling of its goods and services, over a time period. Create an editable Revenue By Region Global Energy Company Profile PPT Sample CP SS V that communicates your idea and engages your audience. Whether you are presenting a business or an educational presentation, pre-designed presentation templates help save time. Revenue By Region Global Energy Company Profile PPT Sample CP SS V is highly customizable and very easy to edit, covering many different styles from creative to business presentations. Slidegeeks has creative team members who have crafted amazing templates. So, go and get them without any delay. This slide showcases the revenueby region of General electric. Total revenue is total amount of money that a company earns through the selling of its goods and services, over a time period.
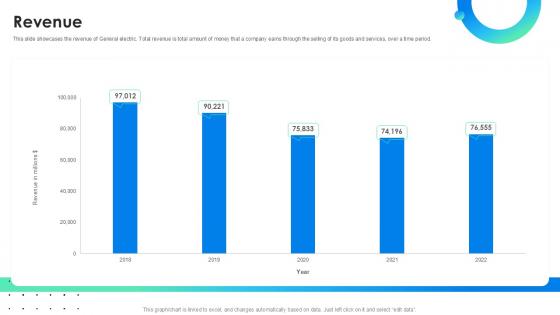
Revenue Global Energy Company Profile PPT Sample CP SS V
This slide showcases the revenue of General electric. Total revenue is total amount of money that a company earns through the selling of its goods and services, over a time period. Want to ace your presentation in front of a live audience Our Revenue Global Energy Company Profile PPT Sample CP SS V can help you do that by engaging all the users towards you. Slidegeeks experts have put their efforts and expertise into creating these impeccable powerpoint presentations so that you can communicate your ideas clearly. Moreover, all the templates are customizable, and easy-to-edit and downloadable. Use these for both personal and commercial use. This slide showcases the revenue of General electric. Total revenue is total amount of money that a company earns through the selling of its goods and services, over a time period.
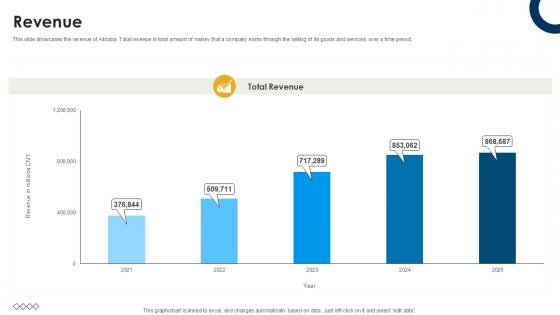
Revenue International Trade Of Products And Services PPT Slide CP SS V
This slide showcases the revenue of Alibaba. Total revenue is total amount of money that a company earns through the selling of its goods and services, over a time period. This Revenue International Trade Of Products And Services PPT Slide CP SS V from Slidegeeks makes it easy to present information on your topic with precision. It provides customization options, so you can make changes to the colors, design, graphics, or any other component to create a unique layout. It is also available for immediate download, so you can begin using it right away. Slidegeeks has done good research to ensure that you have everything you need to make your presentation stand out. Make a name out there for a brilliant performance. This slide showcases the revenue of Alibaba. Total revenue is total amount of money that a company earns through the selling of its goods and services, over a time period.
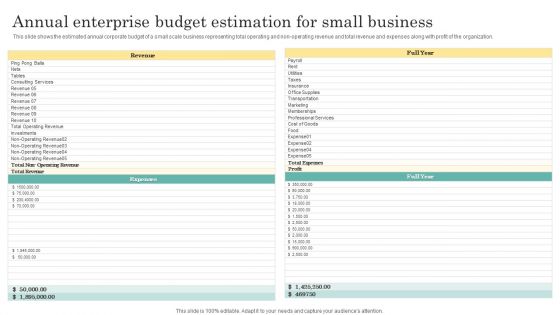
Annual Enterprise Budget Estimation For Small Business Introduction PDF
This slide shows the estimated annual corporate budget of a small scale business representing total operating and non-operating revenue and total revenue and expenses along with profit of the organization. Showcasing this set of slides titled Annual Enterprise Budget Estimation For Small Business Introduction PDF. The topics addressed in these templates are Expenses, Revenue, Operating Revenue. All the content presented in this PPT design is completely editable. Download it and make adjustments in color, background, font etc. as per your unique business setting.
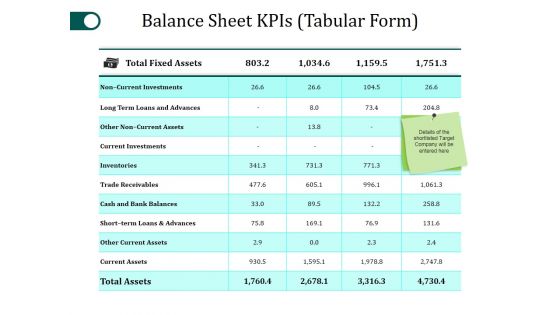
Balance Sheet Kpis Template 1 Ppt PowerPoint Presentation Pictures Example Introduction
This is a balance sheet kpis template 1 ppt powerpoint presentation pictures example introduction. This is a four stage process. The stages in this process are total fixed assets, non current investments, inventories, trade receivables.
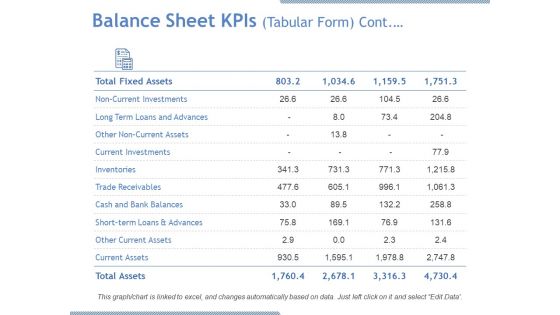
Balance Sheet Kpis Tabular Form Continuous Ppt PowerPoint Presentation Model Graphic Images
This is a balance sheet kpis tabular form continuous ppt powerpoint presentation model graphic images. This is a four stage process. The stages in this process are current investments, inventories, current assets, total assets, trade receivables.

Revenue Projections For Next Financial Year Demonstration Pdf
This slide depicts sales budget for upcoming financial year to generate achievable sales goals and formulate strategies future proof. It include elements such as sales unit forecast, price per unit, total gross sale, total net sale, discount and allowance. Showcasing this set of slides titled Revenue Projections For Next Financial Year Demonstration Pdf The topics addressed in these templates are Particular, Sales Budget, Sales Unit Forecasted All the content presented in this PPT design is completely editable. Download it and make adjustments in color, background, font etc. as per your unique business setting. This slide depicts sales budget for upcoming financial year to generate achievable sales goals and formulate strategies future proof. It include elements such as sales unit forecast, price per unit, total gross sale, total net sale, discount and allowance.
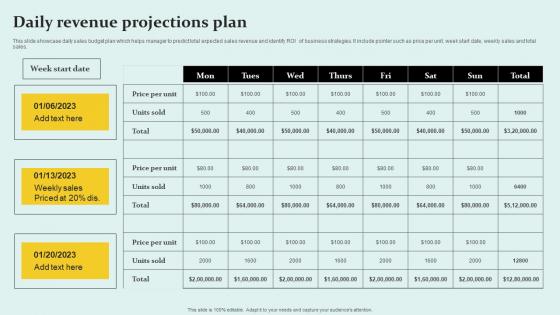
Daily Revenue Projections Plan Infographics Pdf
This slide showcase daily sales budget plan which helps manager to predict total expected sales revenue and identify ROI of business strategies. It include pointer such as price per unit, week start date, weekly sales and total sales. Showcasing this set of slides titled Daily Revenue Projections Plan Infographics Pdf The topics addressed in these templates are Units Sold, Daily Income, Forecast Plan All the content presented in this PPT design is completely editable. Download it and make adjustments in color, background, font etc. as per your unique business setting. This slide showcase daily sales budget plan which helps manager to predict total expected sales revenue and identify ROI of business strategies. It include pointer such as price per unit, week start date, weekly sales and total sales.
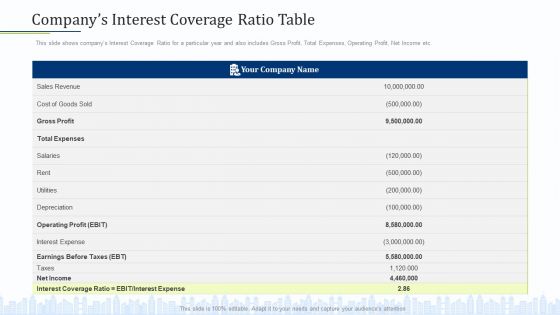
Pitch Deck Draw External Capital From Commercial Banking Institution Companys Interest Coverage Ratio Table Clipart PDF
This slide shows companys Interest Coverage Ratio for a particular year and also includes Gross Profit, Total Expenses, Operating Profit, Net Income etc.Deliver and pitch your topic in the best possible manner with this pitch deck draw external capital from commercial banking institution companys interest coverage ratio table clipart pdf. Use them to share invaluable insights on interest expense, total expenses, sales revenue and impress your audience. This template can be altered and modified as per your expectations. So, grab it now.
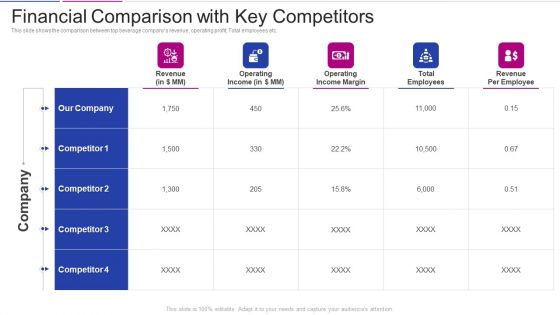
Fundraising From Corporate Investment Financial Comparison With Key Competitors Mockup PDF
This slide shows the comparison between top beverage companys revenue, operating profit, Total employees etc. Deliver and pitch your topic in the best possible manner with this fundraising from corporate investment financial comparison with key competitors mockup pdf. Use them to share invaluable insights on revenue, operating income, operating income margin, total employees, revenue per employee and impress your audience. This template can be altered and modified as per your expectations. So, grab it now.
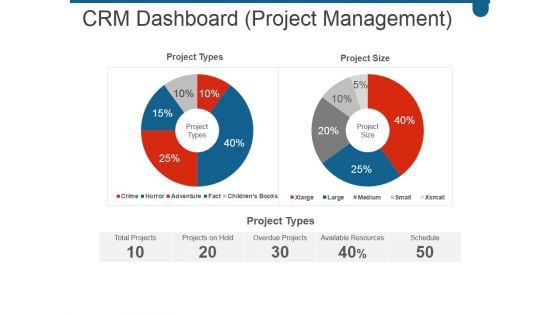
Crm Dashboard Project Management Ppt PowerPoint Presentation Show
This is a crm dashboard project management ppt powerpoint presentation show. This is a two stage process. The stages in this process are total projects, projects on hold, overdue projects, available resources, schedule.
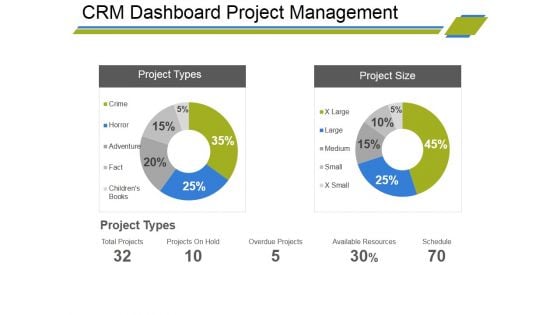
Crm Dashboard Project Management Ppt PowerPoint Presentation Professional Background Designs
This is a crm dashboard project management ppt powerpoint presentation professional background designs. This is a two stage process. The stages in this process are total projects, projects on hold, overdue projects, available resources, schedule.
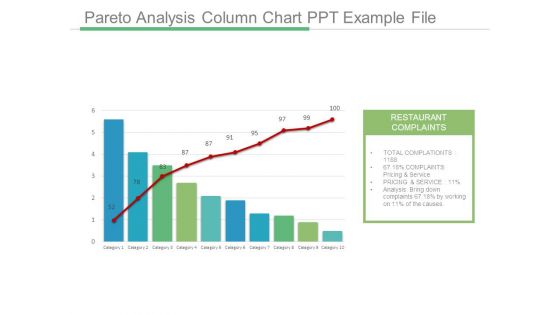
Pareto Analysis Column Chart Ppt Example File
This is a pareto analysis column chart ppt example file. This is a ten stage process. The stages in this process are restaurant complaints, total complaints, complaints pricing and service, pricing and service, analysis bring down complaints, category.

Pareto Graph Powerpoint Slide Designs
This is a pareto graph powerpoint slide designs. This is a ten stage process. The stages in this process are restaurant complaints, total complaints, complaints pricing and service, pricing and service, analysis bring down complaints, category.

Pareto Analysis Bar Graph Powerpoint Slide Deck
This is a pareto analysis bar graph powerpoint slide deck. This is a ten stage process. The stages in this process are restaurant complaints, total complaints, complaints pricing and service, pricing and service, analysis bring down complaints, category.
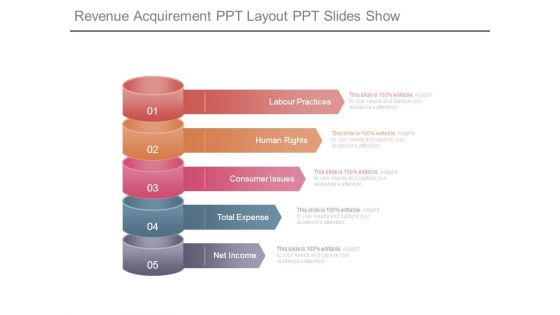
Revenue Acquirement Ppt Layout Ppt Slides Show
This is a revenue acquirement ppt layout ppt slides show. This is a five stage process. The stages in this process are labour practices, human rights, consumer issues, total expense, net income.
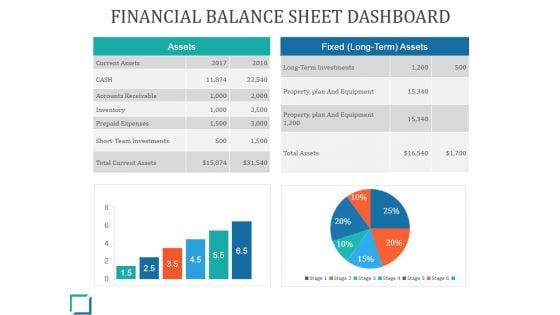
Financial Balance Sheet Dashboard Ppt PowerPoint Presentation Background Image
This is a financial balance sheet dashboard ppt powerpoint presentation background image. This is a two stage process. The stages in this process are current assets, cash, inventory, prepaid expenses, total assets.
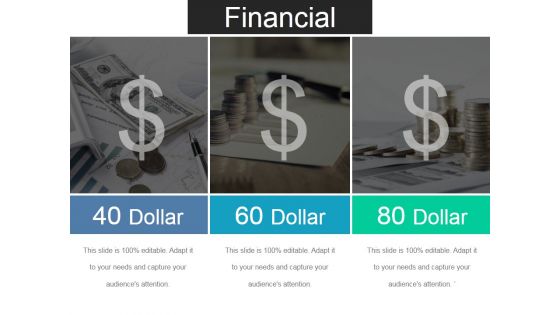
Financial Ppt PowerPoint Presentation Show Graphic Tips
This is a financial ppt powerpoint presentation show graphic tips. This is a six stage process. The stages in this process are target market, users, net revenue, total expenses.
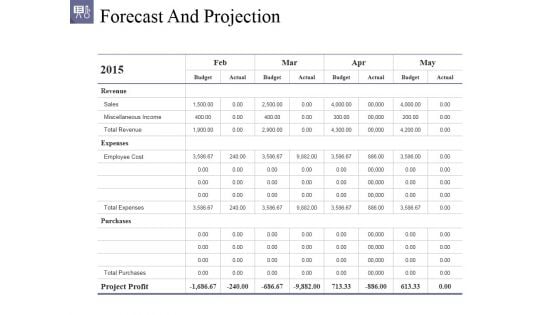
Forecast And Projection Ppt PowerPoint Presentation Pictures Gridlines
This is a forecast and projection ppt powerpoint presentation pictures gridlines. This is a four stage process. The stages in this process are revenue, sales, total revenue, expenses, purchases.

Financial Ppt PowerPoint Presentation Pictures Inspiration
This is a financial ppt powerpoint presentation pictures inspiration. This is a six stage process. The stages in this process are target market, users, net revenue, total expenses, pat margin.
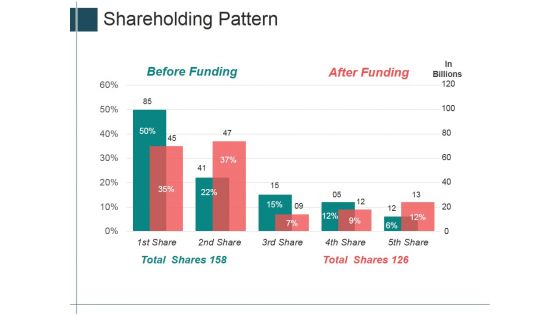
Shareholding Pattern Ppt PowerPoint Presentation Outline Model
This is a shareholding pattern ppt powerpoint presentation outline model. This is a five stage process. The stages in this process are before funding, after funding, total shares, in billions.

Shareholding Pattern Ppt PowerPoint Presentation Inspiration Layout Ideas
This is a shareholding pattern ppt powerpoint presentation inspiration layout ideas. This is a two stage process. The stages in this process are shareholder name, before funding, after funding, total shares.
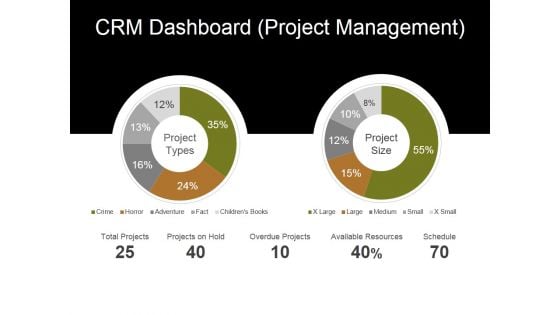
Crm Dashboard Project Management Ppt PowerPoint Presentation Layouts Ideas
This is a crm dashboard project management ppt powerpoint presentation layouts ideas. This is a two stage process. The stages in this process are total projects, projects on hold, overdue projects, available resources, schedule.
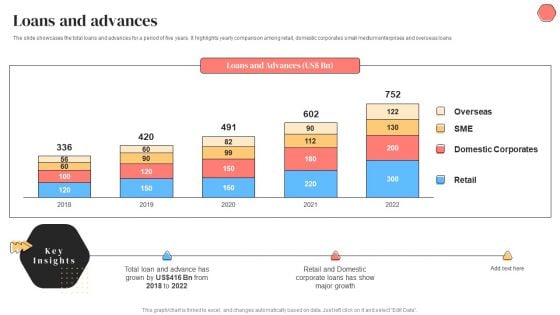
Banking Solutions Company Overview Loans And Advances Inspiration PDF
The slide showcases the total loans and advances for a period of five years. It highlights yearly comparison among retail, domestic corporates small medium enterprises and overseas loans. Deliver and pitch your topic in the best possible manner with this Banking Solutions Company Overview Loans And Advances Inspiration PDF. Use them to share invaluable insights on Major Growth, Retail And Domestic, Total Loan and impress your audience. This template can be altered and modified as per your expectations. So, grab it now.
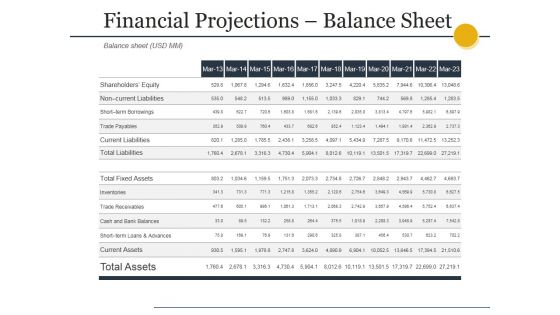
Financial Projections Balance Sheet Ppt PowerPoint Presentation Model Template
This is a financial projections balance sheet ppt powerpoint presentation model template. This is a eleven stage process. The stages in this process are current assets, cash and bank balances, trade receivables, inventories, total fixed assets.
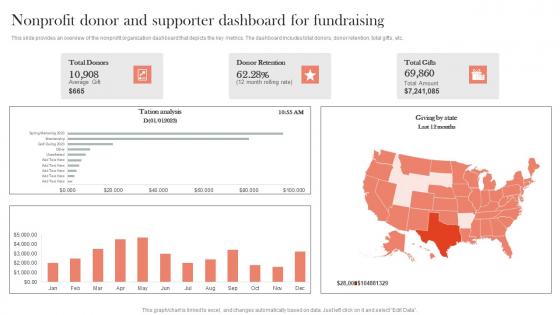
Non profit Donor And Supporter Dashboard For Efficient Nonprofit Marketing Template Pdf
This slide provides an overview of the nonprofit organization dashboard that depicts the key metrics. The dashboard includes total donors, donor retention, total gifts, etc.Create an editable Non profit Donor And Supporter Dashboard For Efficient Nonprofit Marketing Template Pdf that communicates your idea and engages your audience. Whether you are presenting a business or an educational presentation, pre-designed presentation templates help save time. Non profit Donor And Supporter Dashboard For Efficient Nonprofit Marketing Template Pdf is highly customizable and very easy to edit, covering many different styles from creative to business presentations. Slidegeeks has creative team members who have crafted amazing templates. So, go and get them without any delay. This slide provides an overview of the nonprofit organization dashboard that depicts the key metrics. The dashboard includes total donors, donor retention, total gifts, etc.
KPI Dashboard For Tracking Holistic Marketing Strategies To Optimize Guidelines Pdf
This slide showcases the KPI dashboard that would help the business organization to track shareholder and companys valuation. It includes parameters such as total dividend growth rate, total capital return, share count reduced, etc. Explore a selection of the finest KPI Dashboard For Tracking Holistic Marketing Strategies To Optimize Guidelines Pdf here. With a plethora of professionally designed and pre made slide templates, you can quickly and easily find the right one for your upcoming presentation. You can use our KPI Dashboard For Tracking Holistic Marketing Strategies To Optimize Guidelines Pdf to effectively convey your message to a wider audience. Slidegeeks has done a lot of research before preparing these presentation templates. The content can be personalized and the slides are highly editable. Grab templates today from Slidegeeks. This slide showcases the KPI dashboard that would help the business organization to track shareholder and companys valuation. It includes parameters such as total dividend growth rate, total capital return, share count reduced, etc.
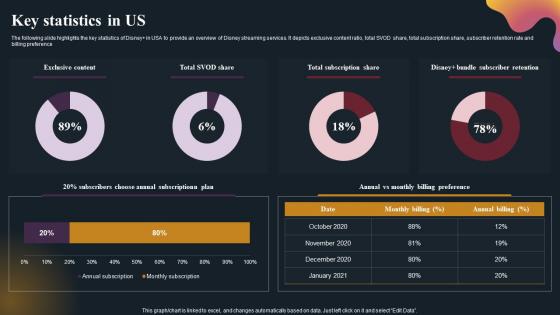
Key Statistics In Us OTT Platform Company Outline Brochure Pdf
The following slide highlights the key statistics of DisneyPlus in USA to provide an overview of Disney streaming services. It depicts exclusive content ratio, total SVOD share, total subscription share, subscriber retention rate and billing preference. Crafting an eye-catching presentation has never been more straightforward. Let your presentation shine with this tasteful yet straightforward Key Statistics In Us OTT Platform Company Outline Brochure Pdf template. It offers a minimalistic and classy look that is great for making a statement. The colors have been employed intelligently to add a bit of playfulness while still remaining professional. Construct the ideal Key Statistics In Us OTT Platform Company Outline Brochure Pdf that effortlessly grabs the attention of your audience Begin now and be certain to wow your customers The following slide highlights the key statistics of DisneyPlus in USA to provide an overview of Disney streaming services. It depicts exclusive content ratio, total SVOD share, total subscription share, subscriber retention rate and billing preference
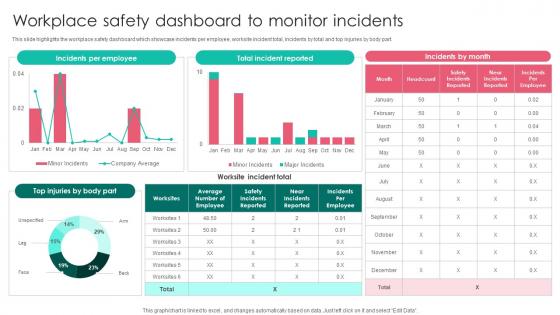
Workplace Safety Dashboard Monitor Workplace Safety Protocol And Security Practices Demonstration Pdf
This slide highlights the workplace safety dashboard which showcase incidents per employee, worksite incident total, incidents by total and top injuries by body part. Present like a pro with Workplace Safety Dashboard Monitor Workplace Safety Protocol And Security Practices Demonstration Pdf Create beautiful presentations together with your team, using our easy to use presentation slides. Share your ideas in real time and make changes on the fly by downloading our templates. So whether you are in the office, on the go, or in a remote location, you can stay in sync with your team and present your ideas with confidence. With Slidegeeks presentation got a whole lot easier. Grab these presentations today. This slide highlights the workplace safety dashboard which showcase incidents per employee, worksite incident total, incidents by total and top injuries by body part.
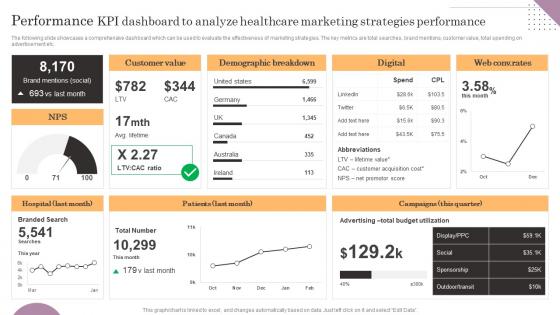
Performance KPI Dashboard To Analyze Healthcare Marketing General Management Brochure Pdf
The following slide showcases a comprehensive dashboard which can be used to evaluate the effectiveness of marketing strategies. The key metrics are total searches, brand mentions, customer value, total spending on advertisement etc. Find a pre-designed and impeccable Performance KPI Dashboard To Analyze Healthcare Marketing General Management Brochure Pdf. The templates can ace your presentation without additional effort. You can download these easy-to-edit presentation templates to make your presentation stand out from others. So, what are you waiting for Download the template from Slidegeeks today and give a unique touch to your presentation. The following slide showcases a comprehensive dashboard which can be used to evaluate the effectiveness of marketing strategies. The key metrics are total searches, brand mentions, customer value, total spending on advertisement etc.
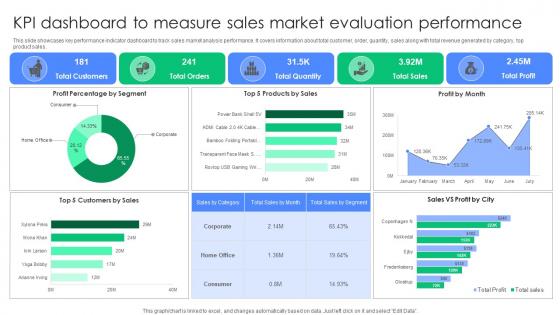
KPI Dashboard To Measure Sales Market Evaluation Performance Summary Pdf
This slide showcases key performance indicator dashboard to track sales market analysis performance. It covers information about total customer, order, quantity, sales along with total revenue generated by category, top product sales. Pitch your topic with ease and precision using this KPI Dashboard To Measure Sales Market Evaluation Performance Summary Pdf. This layout presents information on Profit Percentage Segment, Products Sales, Profit Month. It is also available for immediate download and adjustment. So, changes can be made in the color, design, graphics or any other component to create a unique layout. This slide showcases key performance indicator dashboard to track sales market analysis performance. It covers information about total customer, order, quantity, sales along with total revenue generated by category, top product sales.
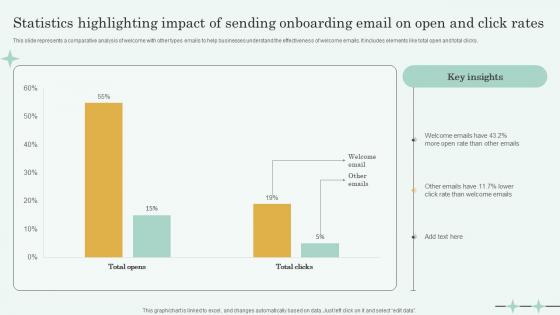
Statistics Highlighting Impact Of Sending Onboarding Email On Open And Click Rates Sample Pdf
This slide represents a comparative analysis of welcome with other types emails to help businesses understand the effectiveness of welcome emails. It includes elements like total open and total clicks. Pitch your topic with ease and precision using this Statistics Highlighting Impact Of Sending Onboarding Email On Open And Click Rates Sample Pdf. This layout presents information on Welcome Emails, Open Rate, Sending Onboarding Email. It is also available for immediate download and adjustment. So, changes can be made in the color, design, graphics or any other component to create a unique layout. This slide represents a comparative analysis of welcome with other types emails to help businesses understand the effectiveness of welcome emails. It includes elements like total open and total clicks.


 Continue with Email

 Home
Home


