Total Cost
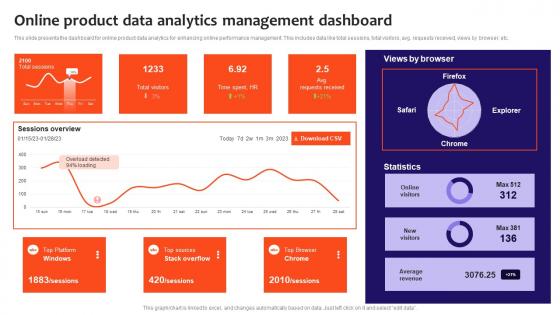
Online Product Data Analytics Management Dashboard Information Pdf
This slide presents the dashboard for online product data analytics for enhancing online performance management. This includes data like total sessions, total visitors, avg. requests received, views by browser, etc. Showcasing this set of slides titled Online Product Data Analytics Management Dashboard Information Pdf. The topics addressed in these templates are Online Product Data Analytics, Management Dashboard. All the content presented in this PPT design is completely editable. Download it and make adjustments in color, background, font etc. as per your unique business setting. This slide presents the dashboard for online product data analytics for enhancing online performance management. This includes data like total sessions, total visitors, avg. requests received, views by browser, etc.
Ultimate Guide To Cold Sales Agents Call Performance Tracking Dashboard SA SS V
This slide showcases company monthly call activity that helps to track agents performance including total answered calls, total agents, CSAT, etc. Take your projects to the next level with our ultimate collection of Ultimate Guide To Cold Sales Agents Call Performance Tracking Dashboard SA SS V. Slidegeeks has designed a range of layouts that are perfect for representing task or activity duration, keeping track of all your deadlines at a glance. Tailor these designs to your exact needs and give them a truly corporate look with your own brand colors they will make your projects stand out from the rest This slide showcases company monthly call activity that helps to track agents performance including total answered calls, total agents, CSAT, etc.
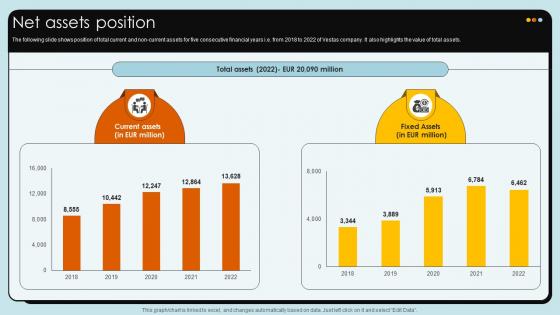
Net Assets Position Wind Turbines Manufacturer Company Profile CP SS V
The following slide shows position of total current and non-current assets for five consecutive financial years i.e. from 2018 to 2022 of Vestas company. It also highlights the value of total assets. Coming up with a presentation necessitates that the majority of the effort goes into the content and the message you intend to convey. The visuals of a PowerPoint presentation can only be effective if it supplements and supports the story that is being told. Keeping this in mind our experts created Net Assets Position Wind Turbines Manufacturer Company Profile CP SS V to reduce the time that goes into designing the presentation. This way, you can concentrate on the message while our designers take care of providing you with the right template for the situation. The following slide shows position of total current and non-current assets for five consecutive financial years i.e. from 2018 to 2022 of Vestas company. It also highlights the value of total assets.
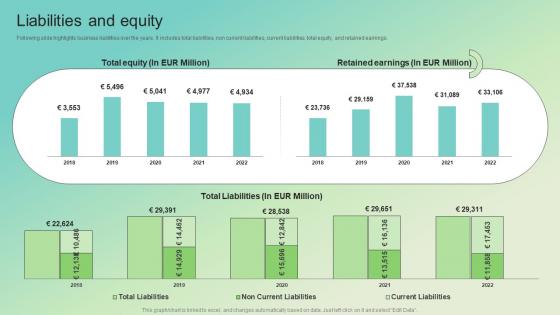
Liabilities And Equity Enterprise Software Solution Providing Company Profile CP SS V
Following slide highlights business liabilities over the years. It includes total liabilities, non current liabilities, current liabilities, total equity, and retained earnings. Here you can discover an assortment of the finest PowerPoint and Google Slides templates. With these templates, you can create presentations for a variety of purposes while simultaneously providing your audience with an eye-catching visual experience. Download Liabilities And Equity Enterprise Software Solution Providing Company Profile CP SS V to deliver an impeccable presentation. These templates will make your job of preparing presentations much quicker, yet still, maintain a high level of quality. Slidegeeks has experienced researchers who prepare these templates and write high-quality content for you. Later on, you can personalize the content by editing the Liabilities And Equity Enterprise Software Solution Providing Company Profile CP SS V. Following slide highlights business liabilities over the years. It includes total liabilities, non current liabilities, current liabilities, total equity, and retained earnings.
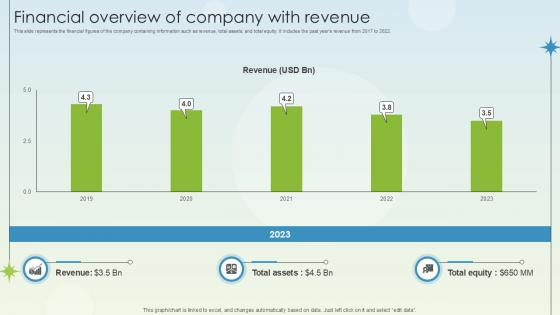
Financial Overview Of Company With Revenue Business Growth Ppt Slides
This slide represents the financial figures of the company containing information such as revenue, total assets, and total equity. It includes the past years revenue from 2017 to 2022. Get a simple yet stunning designed Financial Overview Of Company With Revenue Business Growth Ppt Slides. It is the best one to establish the tone in your meetings. It is an excellent way to make your presentations highly effective. So, download this PPT today from Slidegeeks and see the positive impacts. Our easy-to-edit Financial Overview Of Company With Revenue Business Growth Ppt Slides can be your go-to option for all upcoming conferences and meetings. So, what are you waiting for Grab this template today. This slide represents the financial figures of the company containing information such as revenue, total assets, and total equity. It includes the past years revenue from 2017 to 2022.
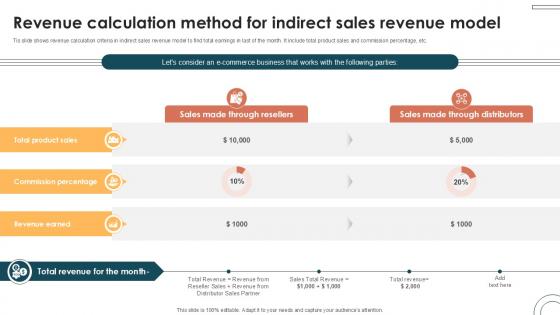
Revenue Calculation Method For Indirect Internet Based Trade Structure Ppt Powerpoint
Tis slide shows revenue calculation criteria in indirect sales revenue model to find total earnings in last of the month. It include total product sales and commission percentage, etc. Are you in need of a template that can accommodate all of your creative concepts This one is crafted professionally and can be altered to fit any style. Use it with Google Slides or PowerPoint. Include striking photographs, symbols, depictions, and other visuals. Fill, move around, or remove text boxes as desired. Test out color palettes and font mixtures. Edit and save your work, or work with colleagues. Download Revenue Calculation Method For Indirect Internet Based Trade Structure Ppt Powerpoint and observe how to make your presentation outstanding. Give an impeccable presentation to your group and make your presentation unforgettable. Tis slide shows revenue calculation criteria in indirect sales revenue model to find total earnings in last of the month. It include total product sales and commission percentage, etc.
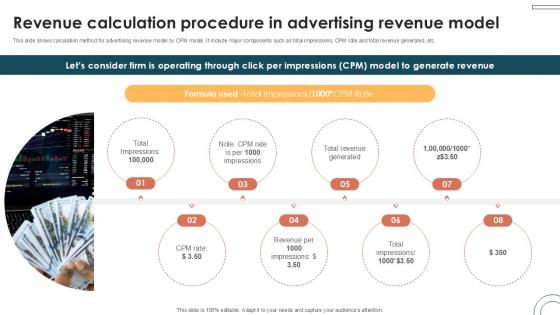
Revenue Calculation Procedure In Internet Based Trade Structure Ppt Slide
This slide shows calculation method for advertising revenue model by CPM model. It include major components such as total impressions, CPM rate and total revenue generated, etc. Make sure to capture your audiences attention in your business displays with our gratis customizable Revenue Calculation Procedure In Internet Based Trade Structure Ppt Slide. These are great for business strategies, office conferences, capital raising or task suggestions. If you desire to acquire more customers for your tech business and ensure they stay satisfied, create your own sales presentation with these plain slides. This slide shows calculation method for advertising revenue model by CPM model. It include major components such as total impressions, CPM rate and total revenue generated, etc.
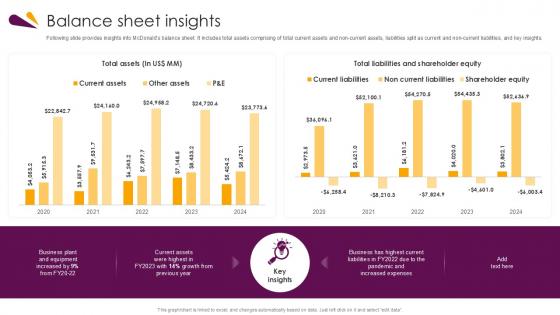
Balance Sheet Insights Food And Beverages Company Profile Ppt Template CP SS V
Following slide provides insights into McDonalds balance sheet. It includes total assets comprising of total current assets and non-current assets, liabilities split as current and non-current liabilities, and key insights. Do you have to make sure that everyone on your team knows about any specific topic I yes, then you should give Balance Sheet Insights Food And Beverages Company Profile Ppt Template CP SS V a try. Our experts have put a lot of knowledge and effort into creating this impeccable Balance Sheet Insights Food And Beverages Company Profile Ppt Template CP SS V You can use this template for your upcoming presentations, as the slides are perfect to represent even the tiniest detail. You can download these templates from the Slidegeeks website and these are easy to edit. So grab these today Following slide provides insights into McDonalds balance sheet. It includes total assets comprising of total current assets and non-current assets, liabilities split as current and non-current liabilities, and key insights.
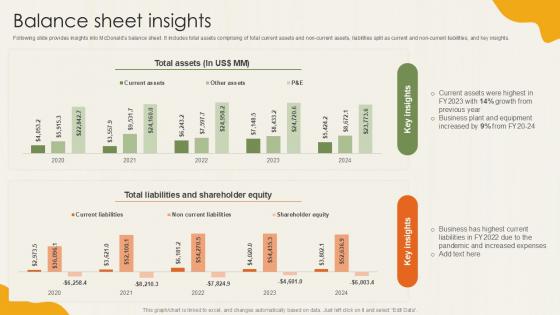
Balance Sheet Insights Food Retailer Company Profile Ppt Example CP SS V
Following slide provides insights into McDonalds balance sheet. It includes total assets comprising of total current assets and non-current assets, liabilities split as current and non-current liabilities, and key insights. Do you know about Slidesgeeks Balance Sheet Insights Food Retailer Company Profile Ppt Example CP SS V These are perfect for delivering any kind od presentation. Using it, create PowerPoint presentations that communicate your ideas and engage audiences. Save time and effort by using our pre-designed presentation templates that are perfect for a wide range of topic. Our vast selection of designs covers a range of styles, from creative to business, and are all highly customizable and easy to edit. Download as a PowerPoint template or use them as Google Slides themes. Following slide provides insights into McDonalds balance sheet. It includes total assets comprising of total current assets and non-current assets, liabilities split as current and non-current liabilities, and key insights.
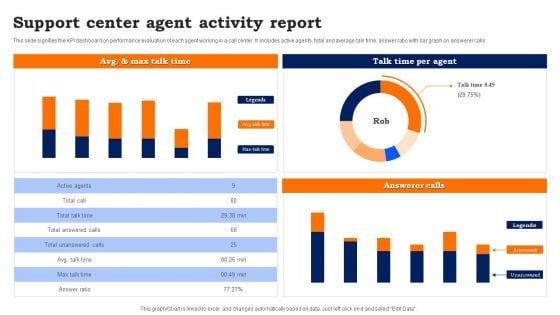
Support Center Agent Activity Report Guidelines PDF
This slide signifies the KPI dashboard on performance evaluation of each agent working in a call center. It includes active agents, total and average talk time, answer ratio with bar graph on answerer calls.
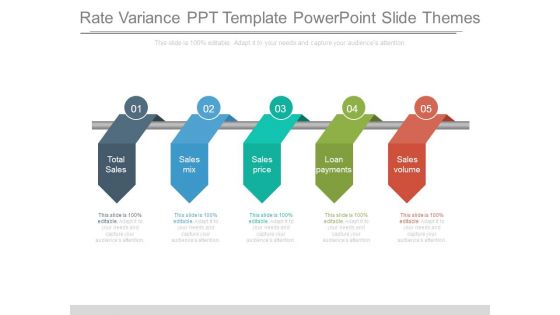
Rate Variance Ppt Template Powerpoint Slide Themes
This is a rate variance ppt template powerpoint slide themes. This is a five stage process. The stages in this process are total sales, sales mix, sales price, loan payments, sales volume.
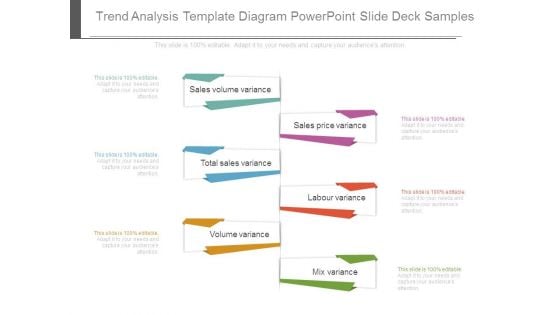
Trend Analysis Template Diagram Powerpoint Slide Deck Samples
This is a trend analysis template diagram powerpoint slide deck samples. This is a six stage process. The stages in this process are sales volume variance, total sales variance, sales price variance, labour variance, mix variance, volume variance.
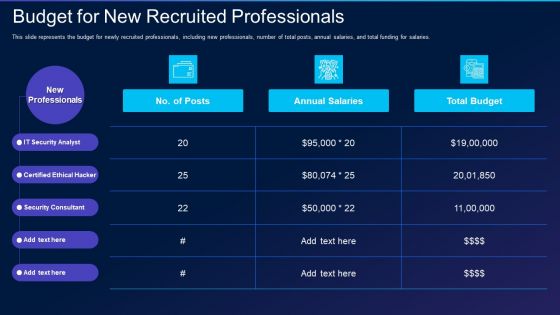
Cyber Exploitation IT Budget For New Recruited Professionals Demonstration PDF
This slide represents the budget for newly recruited professionals, including new professionals, number of total posts, annual salaries, and total funding for salaries. Deliver and pitch your topic in the best possible manner with this cyber exploitation it budget for new recruited professionals demonstration pdf. Use them to share invaluable insights on it security analyst, certified ethical hacker, security consultant and impress your audience. This template can be altered and modified as per your expectations. So, grab it now.
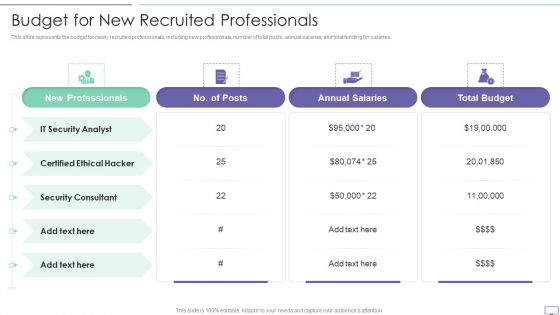
IT Security Hacker Budget For New Recruited Professionals Infographics PDF
This slide represents the budget for newly recruited professionals, including new professionals, number of total posts, annual salaries, and total funding for salaries.Deliver and pitch your topic in the best possible manner with this IT Security Hacker Budget For New Recruited Professionals Infographics PDF. Use them to share invaluable insights on New Professionals, Certified Ethical, Annual Salaries and impress your audience. This template can be altered and modified as per your expectations. So, grab it now.
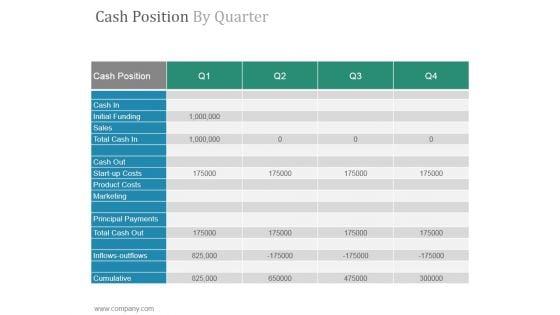
Cash Position By Quarter Ppt PowerPoint Presentation Outline
This is a cash position by quarter ppt powerpoint presentation outline. This is a four stage process. The stages in this process are cash position, cash in, initial funding, sales, total cash in.
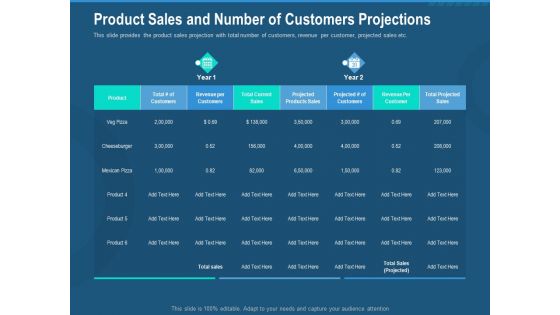
Investment Pitch To Generate Capital From Series B Venture Round Product Sales And Number Of Customers Projections Graphics PDF
Deliver and pitch your topic in the best possible manner with this investment pitch to generate capital from series b venture round product sales and number of customers projections graphics pdf. Use them to share invaluable insights on total customers, product, revenue per customers, total current sales, projected products sales, projected customers and impress your audience. This template can be altered and modified as per your expectations. So, grab it now.
Highlights Ppt PowerPoint Presentation Icon Infographics
This is a highlights ppt powerpoint presentation icon infographics. This is a five stage process. The stages in this process are countries, stores worldwide, total revenue, associates, monthly website visitors.
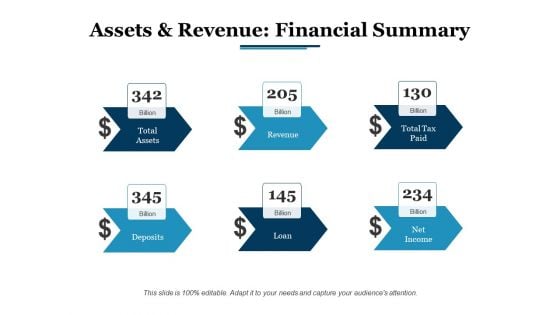
Assets And Revenue Financial Summary Ppt PowerPoint Presentation Diagram Lists
This is a assets and revenue financial summary ppt powerpoint presentation diagram lists. This is a six stage process. The stages in this process are total assets, revenue, deposits, loan, net income.
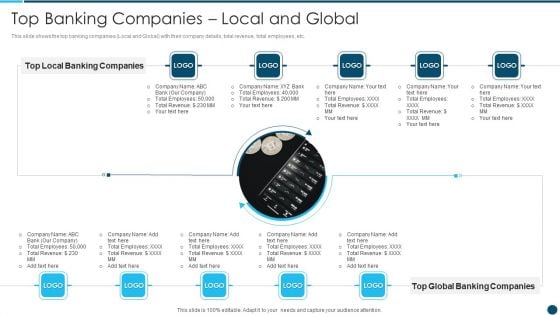
Digital Technology Adoption In Banking Industry Case Competition Top Banking Designs PDF
This slide shows the top banking companies Local and Global with their company details, total revenue, total employees, etc.Deliver and pitch your topic in the best possible manner with this Digital Technology Adoption In Banking Industry Case Competition Top Banking Designs PDF Use them to share invaluable insights on Local Banking Companies, Top Banking Companie, Local And Global and impress your audience. This template can be altered and modified as per your expectations. So, grab it now.
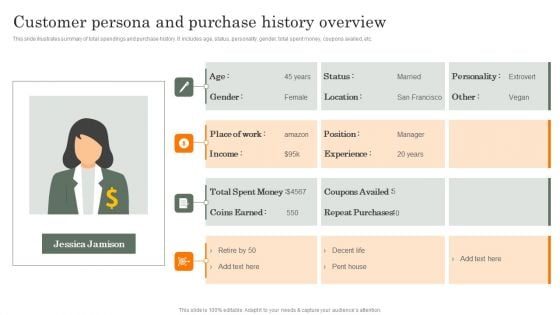
Customer Persona And Purchase History Overview Rules PDF
This slide illustrates summary of total spendings and purchase history. It includes age, status, personality, gender, total spent money, coupons availed, etc. Presenting Customer Persona And Purchase History Overview Rules PDF to dispense important information. This template comprises Four stages. It also presents valuable insights into the topics including Customer Persona, Purchase History Overview. This is a completely customizable PowerPoint theme that can be put to use immediately. So, download it and address the topic impactfully.
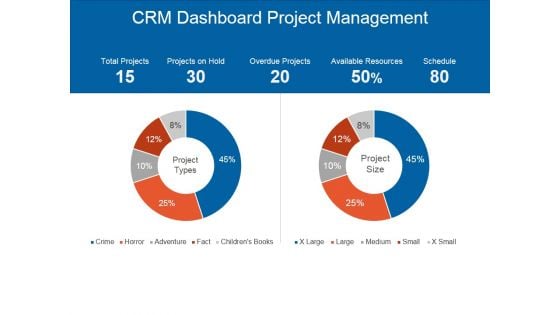
Crm Dashboard Project Management Ppt PowerPoint Presentation Graphics
This is a crm dashboard project management ppt powerpoint presentation graphics. This is a two stage process. The stages in this process are total projects, projects on hold, overdue projects, available resources, schedule.
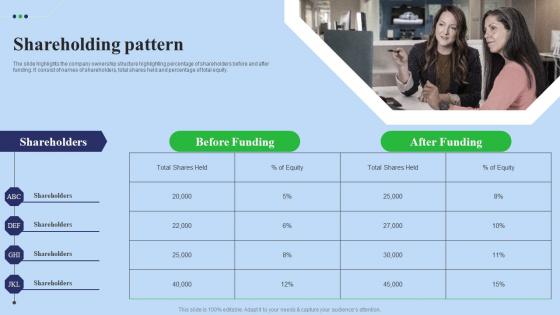
Shareholding Pattern Fundraising Pitch Deck For Digital Software Company Professional Pdf
The slide highlights the company ownership structure highlighting percentage of shareholders before and after funding. It consist of names of shareholders, total shares held and percentage of total equity. Make sure to capture your audiences attention in your business displays with our gratis customizable Shareholding Pattern Fundraising Pitch Deck For Digital Software Company Professional Pdf. These are great for business strategies, office conferences, capital raising or task suggestions. If you desire to acquire more customers for your tech business and ensure they stay satisfied, create your own sales presentation with these plain slides. The slide highlights the company ownership structure highlighting percentage of shareholders before and after funding. It consist of names of shareholders, total shares held and percentage of total equity.
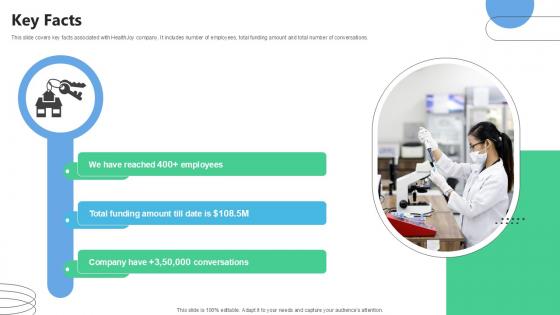
Key Facts Medical Benefits Navigation Platform Pitch Deck Ppt Powerpoint
This slide covers key facts associated with HealthJoy company. It includes number of employees, total funding amount and total number of conversations. Slidegeeks has constructed Key Facts Medical Benefits Navigation Platform Pitch Deck Ppt Powerpoint after conducting extensive research and examination. These presentation templates are constantly being generated and modified based on user preferences and critiques from editors. Here, you will find the most attractive templates for a range of purposes while taking into account ratings and remarks from users regarding the content. This is an excellent jumping-off point to explore our content and will give new users an insight into our top-notch PowerPoint Templates. This slide covers key facts associated with HealthJoy company. It includes number of employees, total funding amount and total number of conversations.
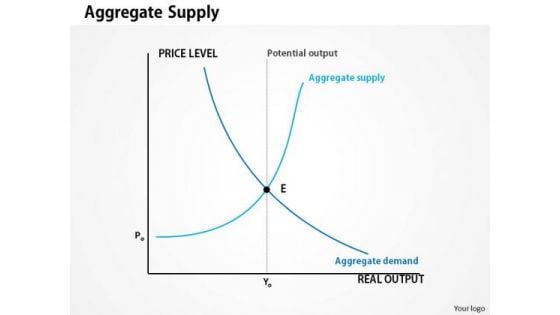
Business Framework Aggregate Supply PowerPoint Presentation
This diagram displays graph of aggregate supply. Aggregate supply is the total value of the goods and services produced. Use this diagram to present information in the visual manner.
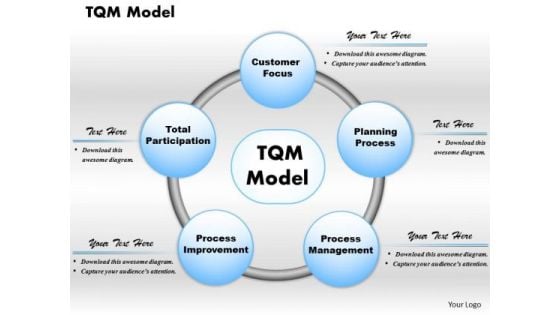
Business Framework Tqm Model PowerPoint Presentation
This business framework PPT has been crafted with graphic of cyclic process. This diagram is called as TQM. Total quality management is the important key in the production. Use this template for your production related presentation.
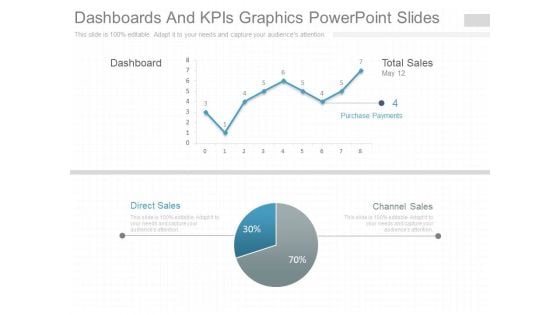
Dashboards And Kpis Graphics Powerpoint Slides
This is a dashboards and kpis graphics powerpoint slides. This is a two stage process. The stages in this process are dashboard, total sales, channel sales, direct sales, purchase payments.
Financial Analysis Reporting Ppt Templates
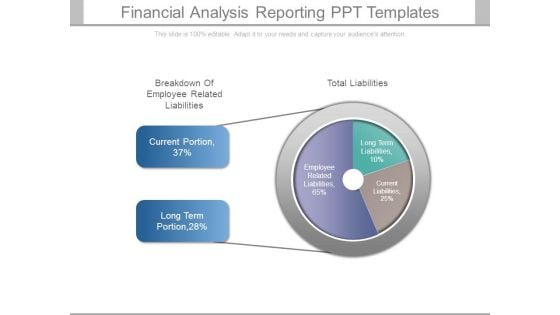
This is a financial analysis reporting ppt templates. This is a three stage process. The stages in this process are breakdown of employee related liabilities, current portion, long term, total liabilities, long term liabilities, employee related liabilities, current liabilities.
Financial Projection Graph Slide2 Ppt PowerPoint Presentation Themes
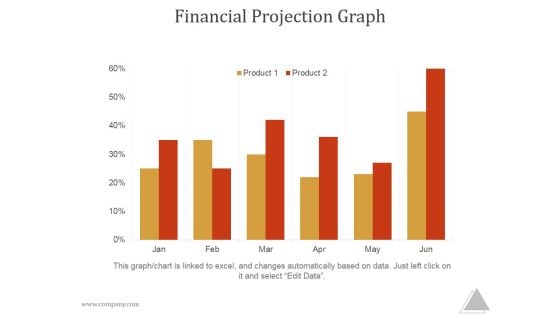
This is a financial projection graph slide2 ppt powerpoint presentation themes. This is a five stage process. The stages in this process are year, total sales, gross, margin, net income
Sales Dashboard Template 2 Ppt PowerPoint Presentation Examples
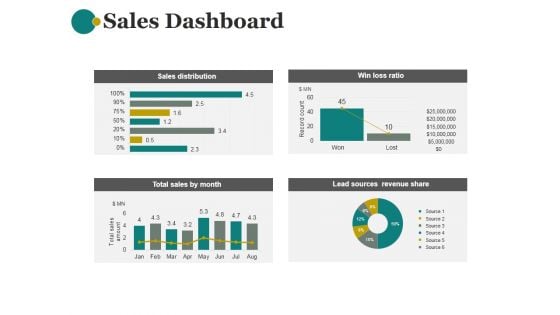
This is a sales dashboard template 2 ppt powerpoint presentation examples. This is a four stage process. The stages in this process are sales distribution, win loss ratio, lead sources revenue share, total sales by month.
Crm Dashboard Sales Dashboard Template Ppt PowerPoint Presentation Microsoft
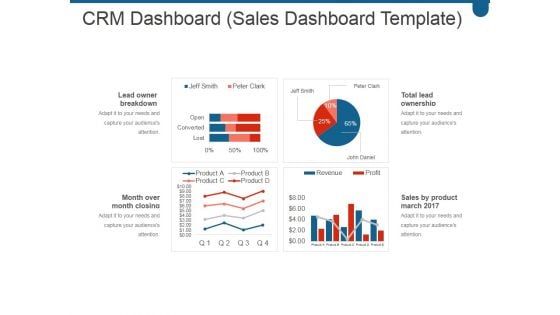
This is a crm dashboard sales dashboard template ppt powerpoint presentation microsoft. This is a four stage process. The stages in this process are lead owner breakdown, month over month closing trend, total lead ownership, sales by product march 2017.

Hr Dashboard Template 2 Ppt PowerPoint Presentation Microsoft
This is a hr dashboard template 2 ppt powerpoint presentation microsoft. This is a four stage process. The stages in this process are open positions by divisions, key metrics, total employees, employee churn.
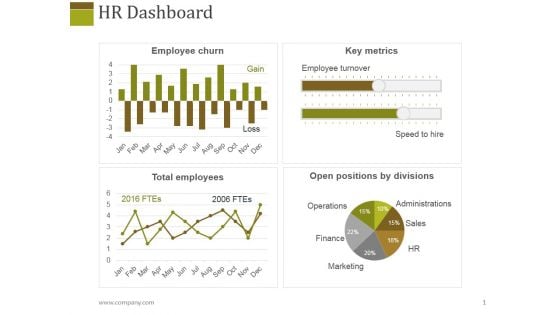
Hr Dashboard Template 1 Ppt PowerPoint Presentation Layouts Slideshow
This is a hr dashboard template 1 ppt powerpoint presentation layouts slideshow. This is a four stage process. The stages in this process are employee churn, key metrics, total employees, open positions by divisions.
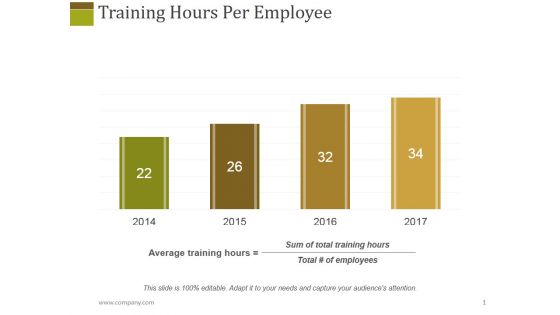
Training Hours Per Employee Ppt PowerPoint Presentation Styles Influencers
This is a training hours per employee ppt powerpoint presentation styles influencers. This is a four stage process. The stages in this process are average training hours, sum of total training hours, year, growth.
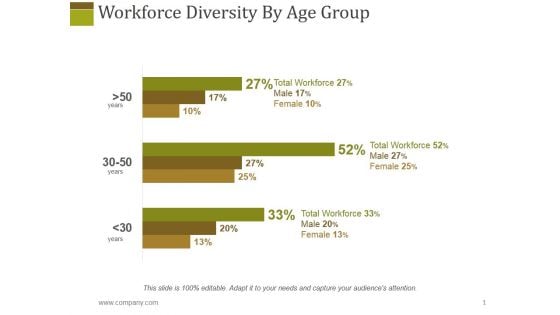
Workforce Diversity By Age Group Ppt PowerPoint Presentation File Good
This is a workforce diversity by age group ppt powerpoint presentation file good. This is a three stage process. The stages in this process are total workforce, female, male, graph, management.
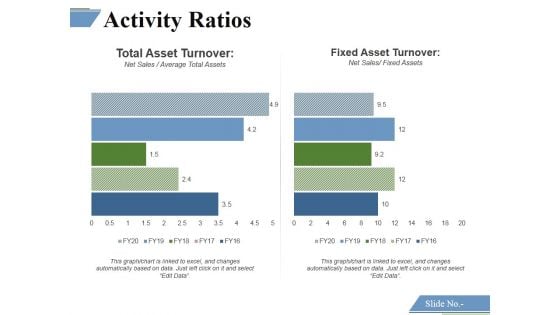
Activity Ratios Template 3 Ppt PowerPoint Presentation Visual Aids Example 2015
This is a activity ratios template 3 ppt powerpoint presentation visual aids example 2015. This is a two stage process. The stages in this process are total asset turnover, fixed asset turnover.
Activity Ratios Template 4 Ppt PowerPoint Presentation Slides Example Introduction
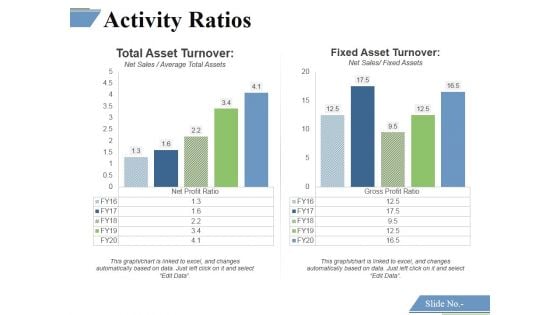
This is a activity ratios template 4 ppt powerpoint presentation slides example introduction. This is a two stage process. The stages in this process are total asset turnover, fixed asset turnover.
Activity Ratios Template 3 Ppt PowerPoint Presentation Professional Example
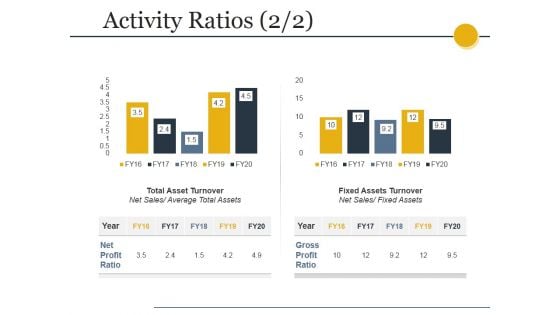
This is a activity ratios template 3 ppt powerpoint presentation professional example. This is a two stage process. The stages in this process are total asset turnover, net sales, fixed assets turnover, fixed assets.
Activity Ratios Template Ppt PowerPoint Presentation Summary Slides
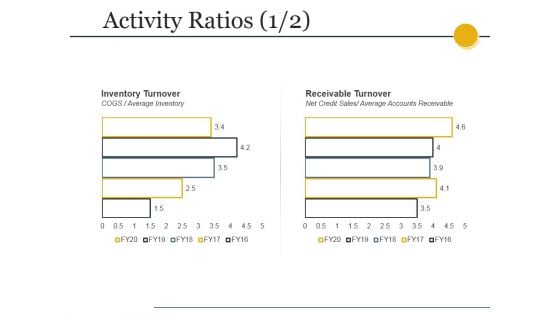
This is a activity ratios template ppt powerpoint presentation summary slides. This is a two stage process. The stages in this process are total asset turnover, net sales, fixed assets turnover, fixed assets.
Profitability Ratios Template 3 Ppt PowerPoint Presentation Show Graphics Download
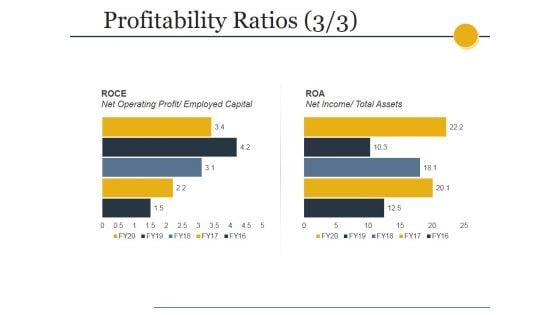
This is a profitability ratios template 3 ppt powerpoint presentation show graphics download. This is a two stage process. The stages in this process are roce, net operating profit, employed capital, roa, net income, total assets.
Sales Activities Dashboard Ppt PowerPoint Presentation Pictures Model
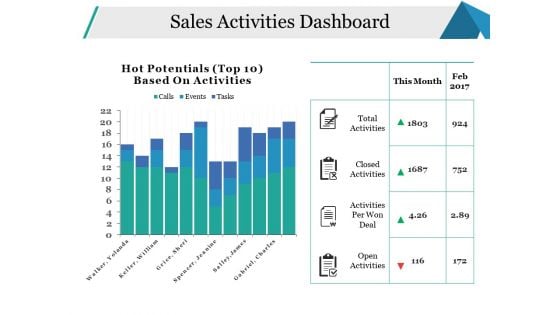
This is a sales activities dashboard ppt powerpoint presentation pictures model. This is a two stage process. The stages in this process are open activities, activities per won deal, closed activities, total activities, business.

Sales Activities Dashboard Ppt PowerPoint Presentation Ideas Themes
This is a sales activities dashboard ppt powerpoint presentation ideas themes. This is a two stage process. The stages in this process are total activities, closed activities, activities per won deal, open activities.
Activity Ratios Template 2 Ppt PowerPoint Presentation File Example File
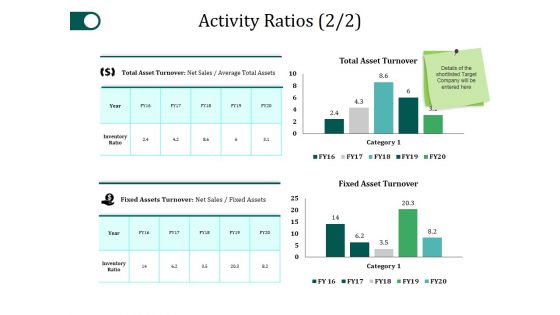
This is a activity ratios template 2 ppt powerpoint presentation file example file. This is a two stage process. The stages in this process are total asset turnover, fixed asset turnover, category, table, business.
Activity Ratios Template 2 Ppt PowerPoint Presentation Pictures Template
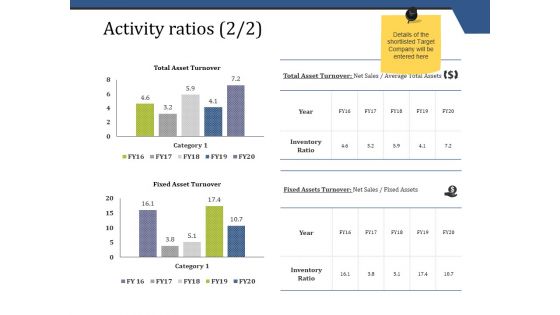
This is a activity ratios template 2 ppt powerpoint presentation pictures template. This is a two stage process. The stages in this process are total asset turnover, fixed asset turnover.

Market Sizing Template 1 Ppt PowerPoint Presentation Infographics Diagrams
This is a market sizing template 1 ppt powerpoint presentation infographics diagrams. This is a three stage process. The stages in this process are total available market, serviceable market, our market share.

Market Sizing Template 1 Ppt PowerPoint Presentation Slides File Formats
This is a market sizing template 1 ppt powerpoint presentation slides file formats. This is a three stage process. The stages in this process are total available market, serviceable market, our market share.
Balance Sheet Kpis Ppt PowerPoint Presentation Summary Designs Download
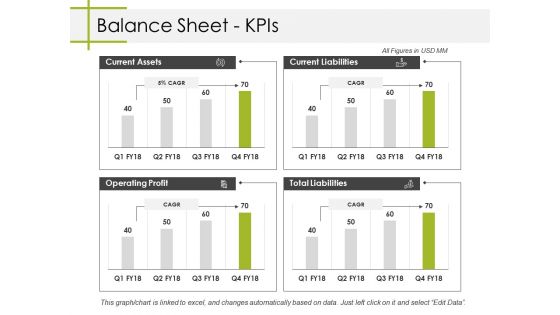
This is a balance sheet kpis ppt powerpoint presentation summary designs download. This is a four stage process. The stages in this process are current assets, current liabilities, total liabilities, operating profit, business.
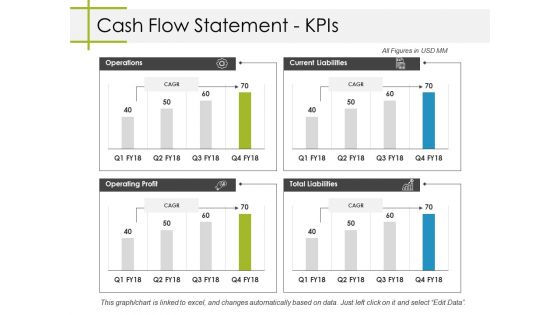
Cash Flow Statement Kpis Ppt PowerPoint Presentation Styles Themes
This is a cash flow statement kpis ppt powerpoint presentation styles themes. This is a four stage process. The stages in this process are business, operations, operating profit, total liabilities, current liabilities.
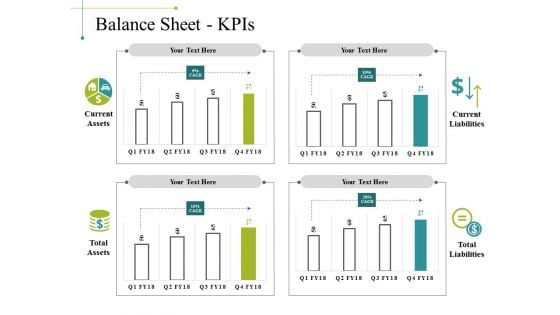
Balance Sheet Kpis Template 1 Ppt PowerPoint Presentation Show Inspiration
This is a balance sheet kpis template 1 ppt powerpoint presentation show inspiration. This is a four stage process. The stages in this process are business, marketing, graph, current liabilities, total liabilities.
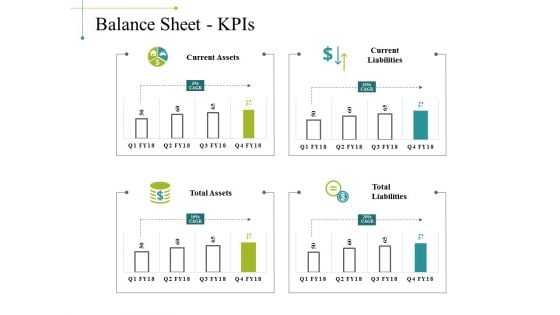
Balance Sheet Kpis Template 2 Ppt PowerPoint Presentation Gallery Example
This is a balance sheet kpis template 2 ppt powerpoint presentation gallery example. This is a four stage process. The stages in this process are business, marketing, graph, current liabilities, total liabilities.
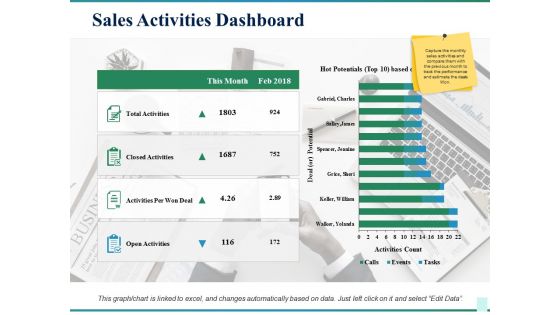
Sales Activities Dashboard Ppt PowerPoint Presentation Show Skills
This is a sales activities dashboard ppt powerpoint presentation show skills. This is a four stage process. The stages in this process are total activities, closed activities, activities per won deal, open activities, this month.
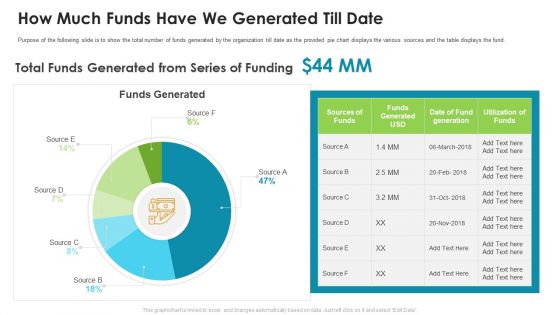
How Much Funds Have We Generated Till Date Pictures PDF
Purpose of the following slide is to show the total number of funds generated by the organization till date as the provided pie chart displays the various sources and the table displays the fund.Deliver an awe-inspiring pitch with this creative how much funds have we generated till date pictures pdf. bundle. Topics like total funds generated from series of funding can be discussed with this completely editable template. It is available for immediate download depending on the needs and requirements of the user.
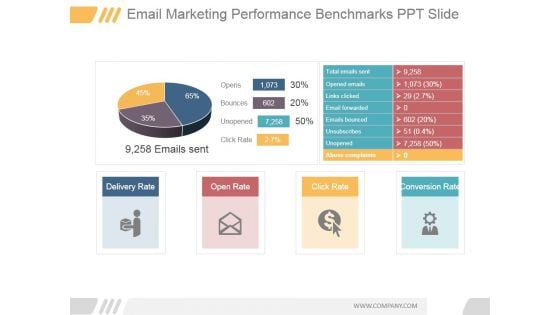
Email Marketing Performance Benchmarks Ppt PowerPoint Presentation Model
This is a email marketing performance benchmarks ppt powerpoint presentation model. This is a two stage process. The stages in this process are opens, bounces, unopened, click rate, emails sent, total emails sent.
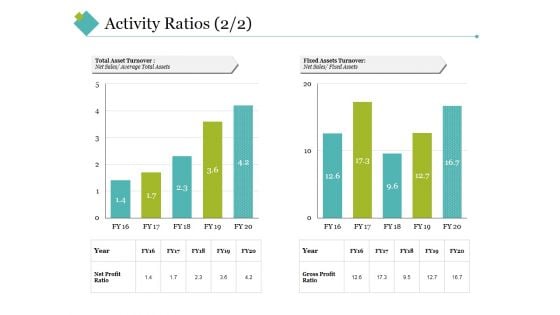
Activity Ratios Template 4 Ppt PowerPoint Presentation Styles Slideshow
This is a activity ratios template 4 ppt powerpoint presentation styles slideshow. This is a two stage process. The stages in this process are total asset turnover, fixed assets turnover, net sales, year, net profit ratio, gross profit ratio.
Portfolio Tracking Dashboard For Management Procedure Structure PDF
This slide covers portfolio performance tracking KPI dashboard for increasing effectiveness in investment management process. It involves details such as investment, total earning, net profit and monthly portfolio performance.Pitch your topic with ease and precision using this Portfolio Tracking Dashboard For Management Procedure Structure PDF This layout presents information on Investment, Total Earning, Portfolio Performance It is also available for immediate download and adjustment. So, changes can be made in the color, design, graphics or any other component to create a unique layout.
Operation And Financials Forecast Management Vs Consensus Icons PDF
The slide provides the operations and financials forecast of the company by the management and Consensus. Key heads includes revenue, interest income, non-performing assets, total assets etc. Deliver an awe inspiring pitch with this creative operation and financials forecast management vs consensus icons pdf bundle. Topics like interest income, loan amount, deposits, non performing assets, total assets can be discussed with this completely editable template. It is available for immediate download depending on the needs and requirements of the user.
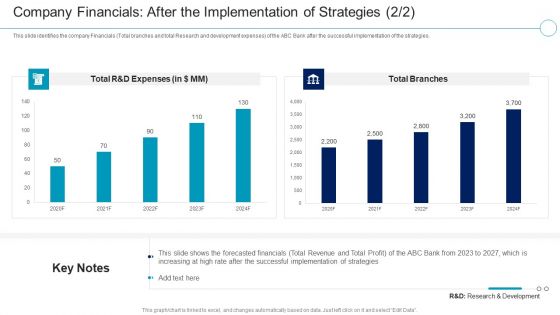
Financial Services Enterprise Transformation Company Financials After The Implementation Rules PDF
This slide identifies the company Financials Total branches and total Research and development expenses of the ABC Bank after the successful implementation of the strategies.Deliver and pitch your topic in the best possible manner with this Financial Services Enterprise Transformation Company Financials After The Implementation Rules PDF Use them to share invaluable insights on Company Financials After The Implementation Of Strategies and impress your audience. This template can be altered and modified as per your expectations. So, grab it now.
Essential Components Of Three Step Dupont Analysis Model Diagrams PDF
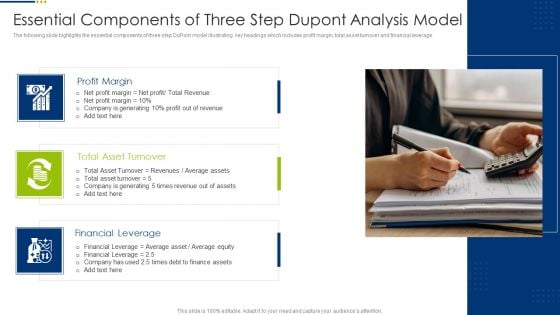
The following slide highlights the essential components of three step DuPont model illustrating key headings which includes profit margin, total asset turnover and financial leverage. Presenting Essential Components Of Three Step Dupont Analysis Model Diagrams PDF to dispense important information. This template comprises three stages. It also presents valuable insights into the topics including Profit Margin, Total Asset Turnover, Financial Leverage. This is a completely customizable PowerPoint theme that can be put to use immediately. So, download it and address the topic impactfully.
Byjus Investor Capital Financing Pitch Deck Byjus Competitive Analysis Template PDF
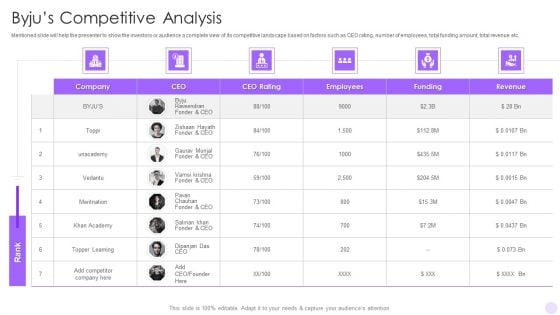
Mentioned slide will help the presenter to show the investors or audience a complete view of its competitive landscape based on factors such as CEO rating, number of employees, total funding amount, total revenue etc.Deliver an awe inspiring pitch with this creative Byjus Investor Capital Financing Pitch Deck Byjus Competitive Analysis Template PDF bundle. Topics like Revenue, Employees, Topper Learning can be discussed with this completely editable template. It is available for immediate download depending on the needs and requirements of the user.
Cyber Network Simulation Platform Capital Funding Pitch Deck Understanding Our Growth Potential Structure PDF
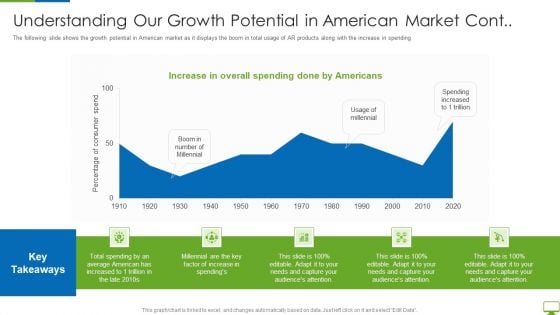
The following slide shows the growth potential in American market as it displays the boom in total usage of AR products along with the increase in spending Deliver an awe inspiring pitch with this creative cyber network simulation platform capital funding pitch deck understanding our growth potential structure pdf bundle. Topics like factor of increase, average american, total spending can be discussed with this completely editable template. It is available for immediate download depending on the needs and requirements of the user.
Pendo Capital Funding Elevator Pitch Deck Pendos Website Traffic Formats PDF
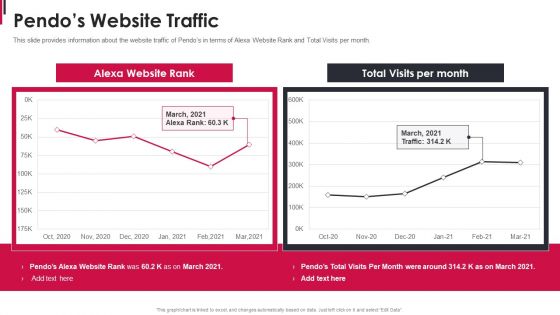
This slide provides information about the website traffic of Pendos in terms of Alexa Website Rank and Total Visits per month. Deliver an awe inspiring pitch with this creative Pendo Capital Funding Elevator Pitch Deck Pendos Website Traffic Formats PDF bundle. Topics like Alexa Website Rank, Total Visits Per Month, Website Traffic can be discussed with this completely editable template. It is available for immediate download depending on the needs and requirements of the user.


 Continue with Email

 Home
Home


