Two Graphs
Revenue Cost Per Employee Comparison Ppt PowerPoint Presentation Icon Graphics Tutorials
This is a revenue cost per employee comparison ppt powerpoint presentation icon graphics tutorials. This is a two stage process. The stages in this process are revenue and cost per employee comparison, line chart, business, marketing, success,
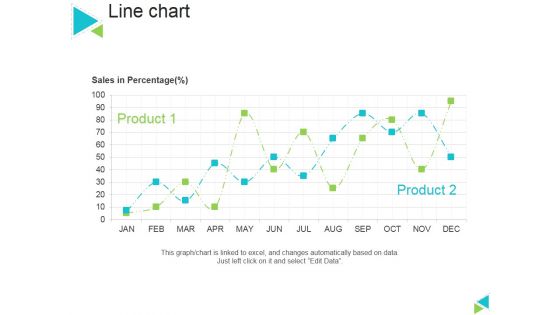
Line Chart Ppt PowerPoint Presentation Gallery Master Slide
This is a line chart ppt powerpoint presentation gallery master slide. This is a two stage process. The stages in this process are sales in percentage, product, line chart.
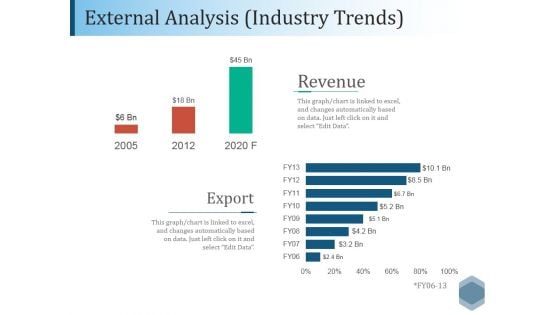
External Analysis Industry Trends Ppt PowerPoint Presentation File Outfit
This is a external analysis industry trends ppt powerpoint presentation file outfit. This is a two stage process. The stages in this process are revenue, export, bar, finance, analysis.
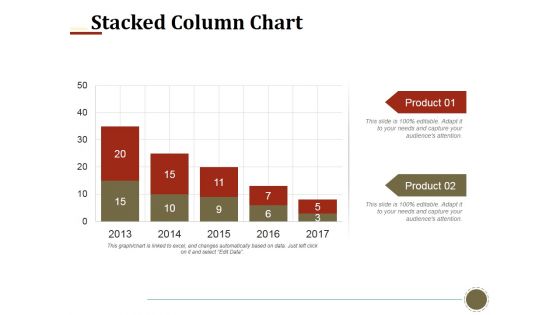
Stacked Column Chart Ppt PowerPoint Presentation Infographics Smartart
This is a stacked column chart ppt powerpoint presentation infographics smartart. This is a two stage process. The stages in this process are stacked column chart, business, finance, marketing, strategy.
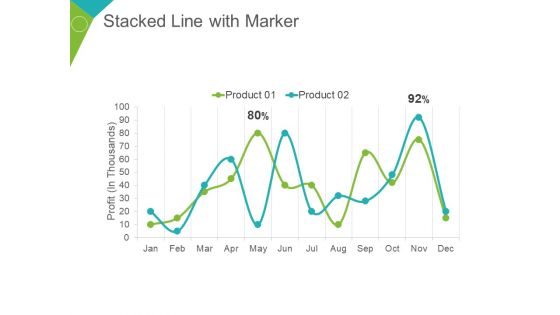
Stacked Line With Marker Ppt PowerPoint Presentation Summary Demonstration
This is a stacked line with marker ppt powerpoint presentation summary demonstration. This is a two stage process. The stages in this process are profit in thousands, product, percentage, finance, business.
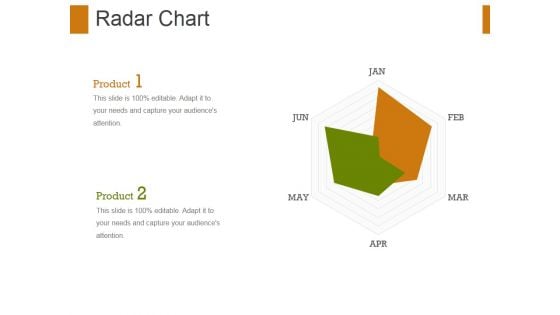
Radar Chart Ppt PowerPoint Presentation Show Graphic Tips
This is a radar chart ppt powerpoint presentation show graphic tips. This is a two stage process. The stages in this process are radar chart, finance, management, marketing, business, analysis.
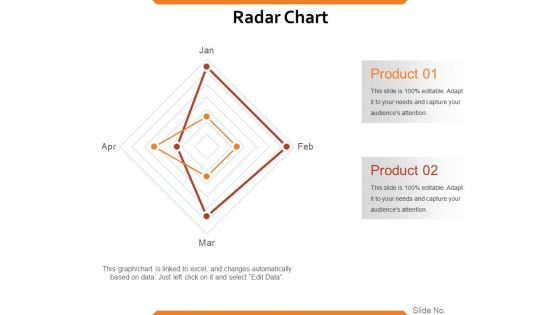
Radar Chart Ppt PowerPoint Presentation Gallery Skills
This is a radar chart ppt powerpoint presentation gallery skills. This is a two stage process. The stages in this process are product, radar chart, jan, feb, mar, apr.
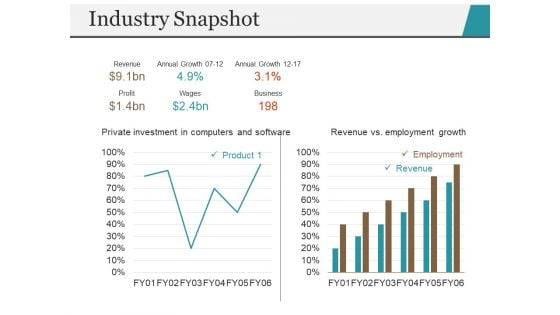
Industry Snapshot Template 1 Ppt PowerPoint Presentation Professional Design Inspiration
This is a industry snapshot template 1 ppt powerpoint presentation professional design inspiration. This is a two stage process. The stages in this process are revenue vs employment growth, employment, revenue, business, annual growth.
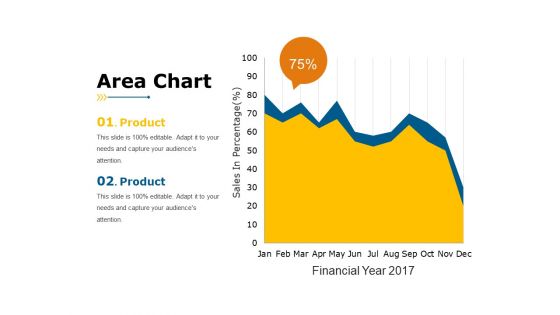
Area Chart Ppt PowerPoint Presentation Slides Rules
This is a area chart ppt powerpoint presentation slides rules. This is a two stage process. The stages in this process are sales in percentage, business, marketing, product, finance.
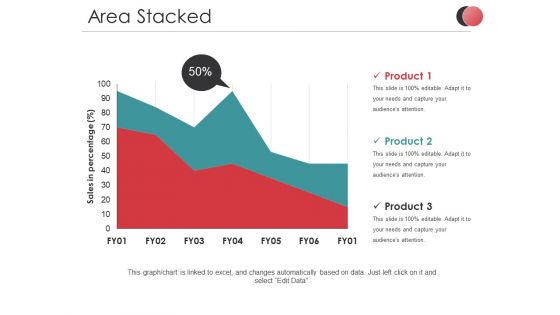
Area Stacked Ppt PowerPoint Presentation Diagram Images
This is a area stacked ppt powerpoint presentation diagram images. This is a two stage process. The stages in this process are sales in percentage, product, business, marketing, finance.
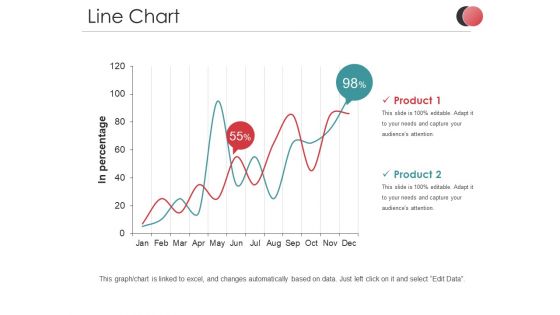
Line Chart Ppt PowerPoint Presentation Professional Ideas
This is a line chart ppt powerpoint presentation professional ideas. This is a two stage process. The stages in this process are in percentage, product, business, marketing, finance, percentage.
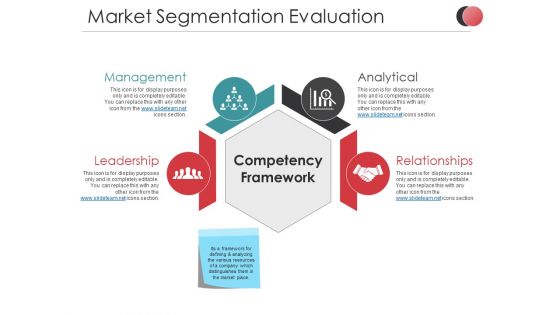
Market Segmentation Evaluation Ppt PowerPoint Presentation Summary Slideshow
This is a market segmentation evaluation ppt powerpoint presentation summary slideshow. This is a two stage process. The stages in this process are net profit, market sales, business, marketing, finance, icons.
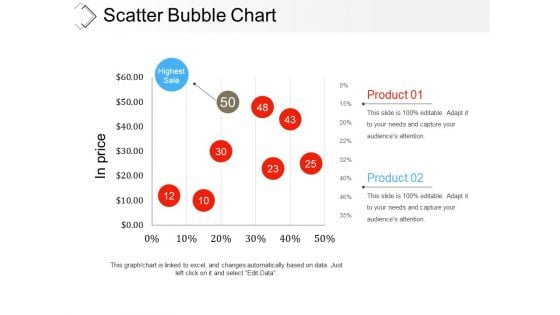
Scatter Bubble Chart Ppt PowerPoint Presentation Infographic Template Examples
This is a scatter bubble chart ppt powerpoint presentation infographic template examples. This is a two stage process. The stages in this process are highest sale, product, in price, finance, business.
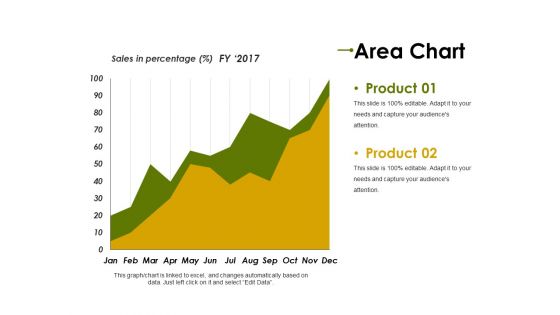
Area Chart Ppt PowerPoint Presentation Summary Objects
This is a area chart ppt powerpoint presentation summary objects. This is a two stage process. The stages in this process are product, sales in percentage, finance, business, marketing.
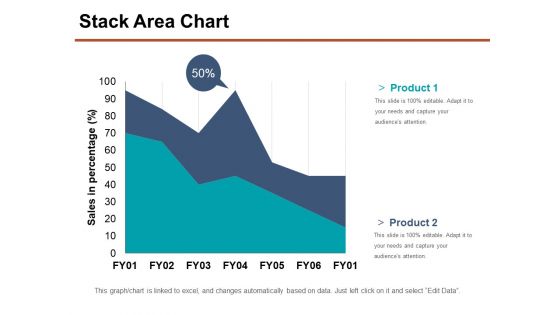
Stack Area Chart Ppt PowerPoint Presentation Show Samples
This is a stack area chart ppt powerpoint presentation show samples. This is a two stage process. The stages in this process are product, sales in percentage, business, marketing, percentage.
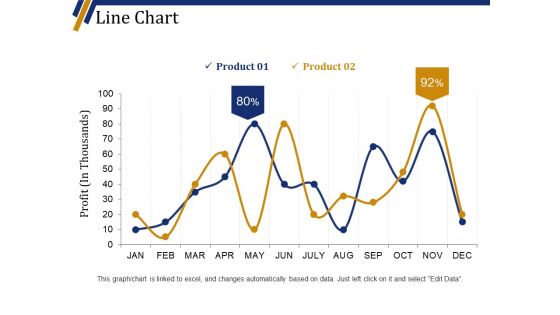
Line Chart Ppt PowerPoint Presentation Portfolio Background Designs
This is a line chart ppt powerpoint presentation portfolio background designs. This is a two stage process. The stages in this process are product, business, finance, marketing, profit in thousands.
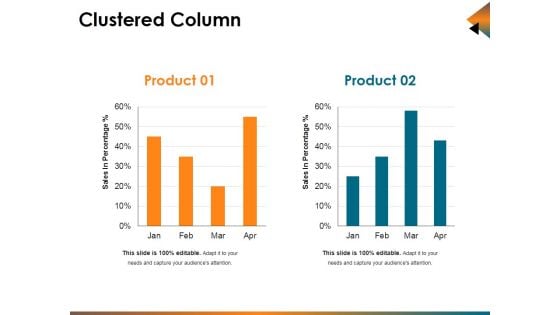
Clustered Column Ppt PowerPoint Presentation Infographic Template Background Designs
This is a clustered column ppt powerpoint presentation infographic template background designs. This is a two stage process. The stages in this process are sales in percentage, bar, business, marketing, planning.
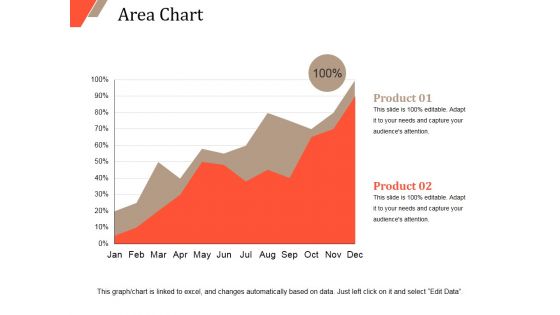
Area Chart Ppt PowerPoint Presentation Inspiration Clipart Images
This is a area chart ppt powerpoint presentation inspiration clipart images. This is a two stage process. The stages in this process are area chart, growth, finance, business, strategy.
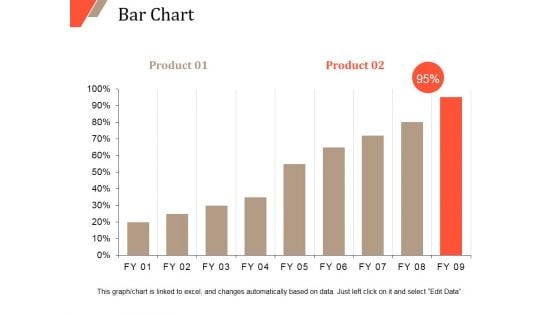
Bar Chart Ppt PowerPoint Presentation Outline Infographics
This is a bar chart ppt powerpoint presentation outline infographics. This is a two stage process. The stages in this process are bar chart, finance, marketing, strategy, analysis, business.
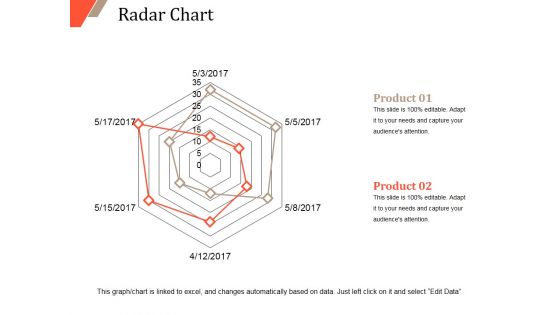
Radar Chart Ppt PowerPoint Presentation Portfolio Design Templates
This is a radar chart ppt powerpoint presentation portfolio design templates. This is a two stage process. The stages in this process are radar chart, product, finance, marketing, strategy, business.
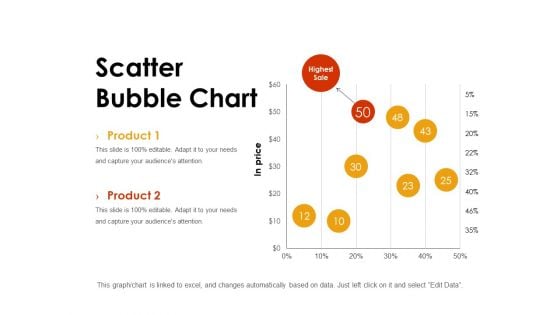
Scatter Bubble Chart Ppt PowerPoint Presentation Styles Background
This is a scatter bubble chart ppt powerpoint presentation styles background. This is a two stage process. The stages in this process are chart, in price, highest sale, finance, marketing.
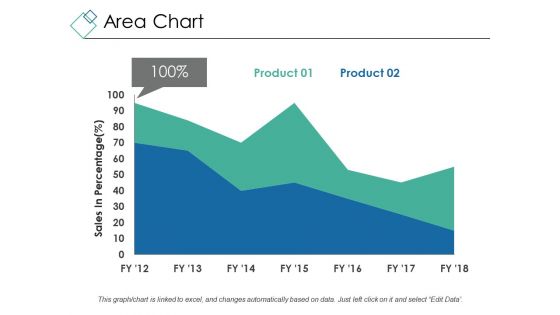
Area Chart Ppt PowerPoint Presentation Inspiration Demonstration
This is a area chart ppt powerpoint presentation inspiration demonstration. This is a two stage process. The stages in this process are sales in percentage, chart, percentage, business, marketing.
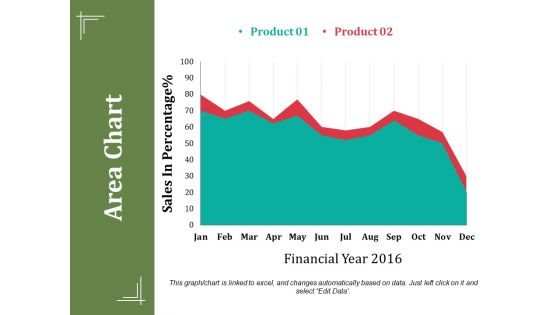
Area Chart Ppt PowerPoint Presentation Summary Show
This is a area chart ppt powerpoint presentation summary show. This is a two stage process. The stages in this process are sales in percentage, financial year, business, marketing, finance.
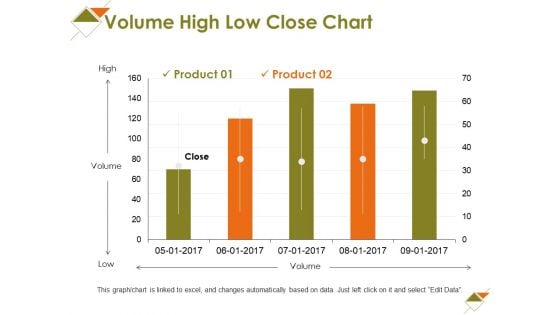
Volume High Low Close Chart Ppt PowerPoint Presentation Slides Styles
This is a volume high low close chart ppt powerpoint presentation slides styles. This is a two stage process. The stages in this process are high, volume, low, business, marketing.
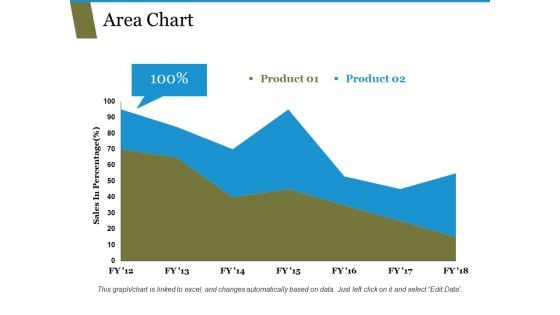
Area Chart Ppt PowerPoint Presentation Portfolio Templates
This is a area chart ppt powerpoint presentation portfolio templates. This is a two stage process. The stages in this process are sales in percentage, chart, business, marketing, finance.
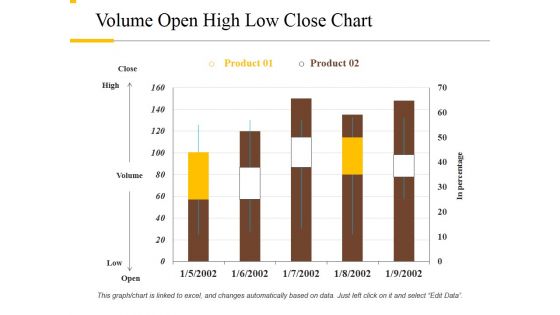
Volume Open High Low Close Chart Ppt PowerPoint Presentation Layouts Background Image
This is a volume open high low close chart ppt powerpoint presentation layouts background image. This is a two stage process. The stages in this process are close, high, volume, low, open.
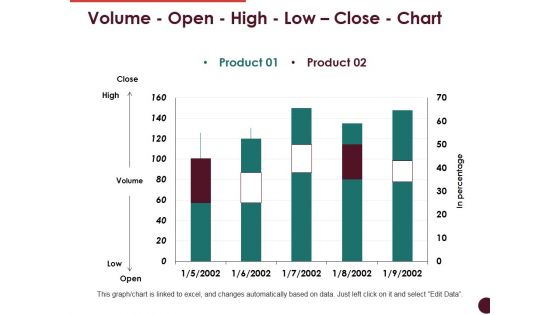
Volume Open High Low Close Chart Ppt PowerPoint Presentation File Graphics Template
This is a volume open high low close chart ppt powerpoint presentation file graphics template. This is a two stage process. The stages in this process are close, high, volume, low, open, product.
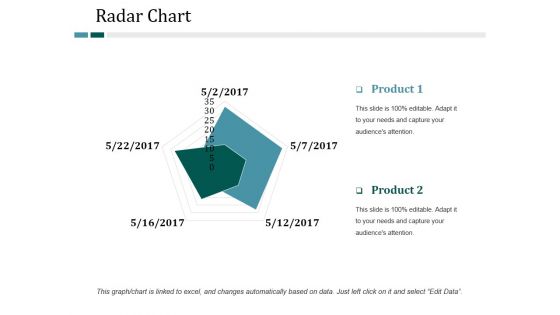
Radar Chart Ppt PowerPoint Presentation Infographic Template Backgrounds
This is a radar chart ppt powerpoint presentation infographic template backgrounds. This is a two stage process. The stages in this process are radar chart, finance, marketing, strategy, business.
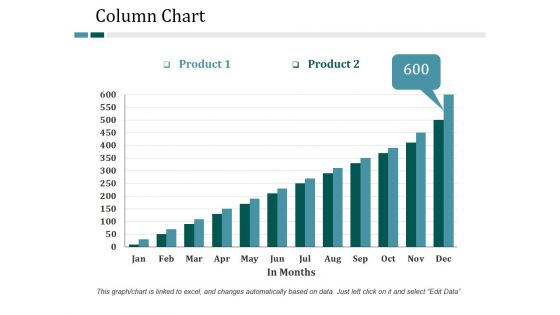
Column Chart Ppt PowerPoint Presentation File Show
This is a column chart ppt powerpoint presentation file show. This is a two stage process. The stages in this process are column chart, finance, marketing, growth, strategy, business.
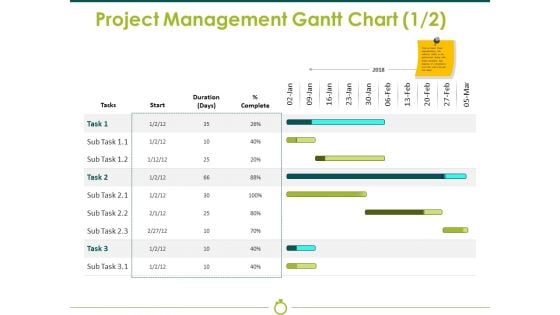
Project Management Gantt Chart Template 1 Ppt PowerPoint Presentation Gallery Graphics Template
This is a project management gantt chart template 1 ppt powerpoint presentation gallery graphics template. This is a two stage process. The stages in this process are start, duration, complete, business, finance.
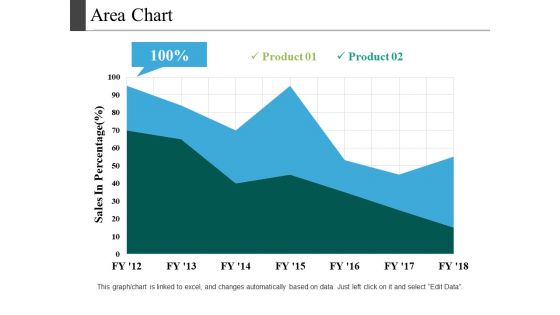
Area Chart Ppt PowerPoint Presentation Pictures Template
This is a area chart ppt powerpoint presentation pictures template. This is a two stage process. The stages in this process are sales in percentage, chart, business, marketing, strategy.
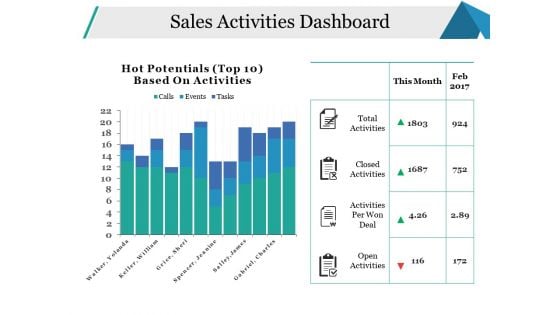
Sales Activities Dashboard Ppt PowerPoint Presentation Pictures Model
This is a sales activities dashboard ppt powerpoint presentation pictures model. This is a two stage process. The stages in this process are open activities, activities per won deal, closed activities, total activities, business.

Sales Activities Dashboard Ppt PowerPoint Presentation Ideas Themes
This is a sales activities dashboard ppt powerpoint presentation ideas themes. This is a two stage process. The stages in this process are total activities, closed activities, activities per won deal, open activities.
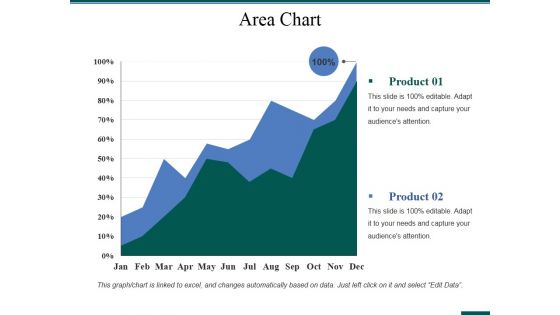
Area Chart Ppt PowerPoint Presentation Pictures Slideshow
This is a area chart ppt powerpoint presentation pictures slideshow. This is a two stage process. The stages in this process are area chart, finance, analysis, marketing, strategy, business.
Sales Activities Dashboard Ppt PowerPoint Presentation Icon Graphics
This is a sales activities dashboard ppt powerpoint presentation icon graphics. This is a two stage process. The stages in this process are business, finance, management, analysis, budget, actual.
Sales Kpi Tracker Ppt PowerPoint Presentation Pictures Designs
This is a sales kpi tracker ppt powerpoint presentation pictures designs. This is a two stage process. The stages in this process are leads created, sales ratio, opportunities won, top products in revenue, win ratio vs last yr.
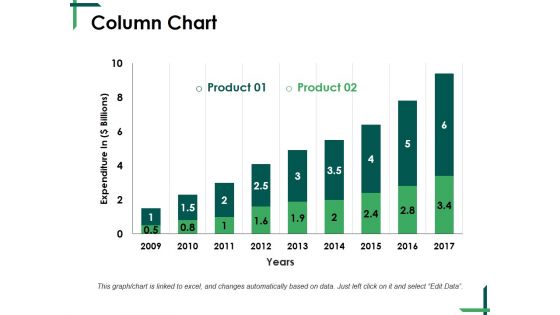
Column Chart Ppt PowerPoint Presentation Gallery Graphics Pictures
This is a column chart ppt powerpoint presentation gallery graphics pictures. This is a two stage process. The stages in this process are column chart, finance, planning, analysis, management, growth.
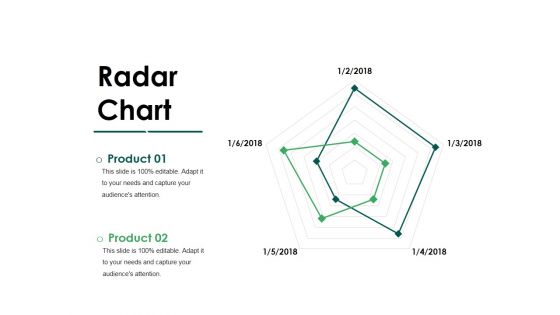
Radar Chart Ppt PowerPoint Presentation Inspiration File Formats
This is a radar chart ppt powerpoint presentation inspiration file formats. This is a two stage process. The stages in this process are radar chart, business, finance, management, analysis.
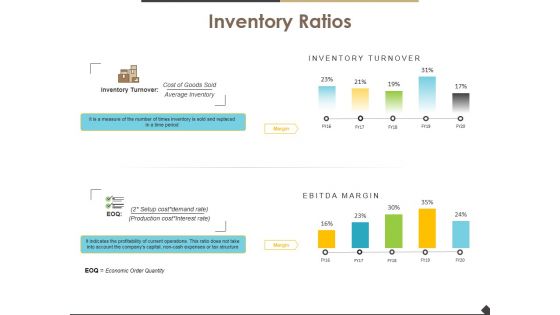
Inventory Ratios Template 1 Ppt PowerPoint Presentation Gallery Master Slide
This is a inventory ratios template 1 ppt powerpoint presentation gallery master slide. This is a two stage process. The stages in this process are finance, marketing, analysis, business, investment, inventory ratios.
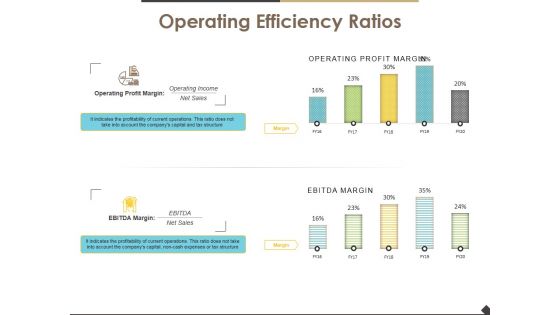
Operating Efficiency Ratios Template 1 Ppt PowerPoint Presentation Layouts Introduction
This is a operating efficiency ratios template 1 ppt powerpoint presentation layouts introduction. This is a two stage process. The stages in this process are operating efficiency ratios, finance, marketing, strategy, business.
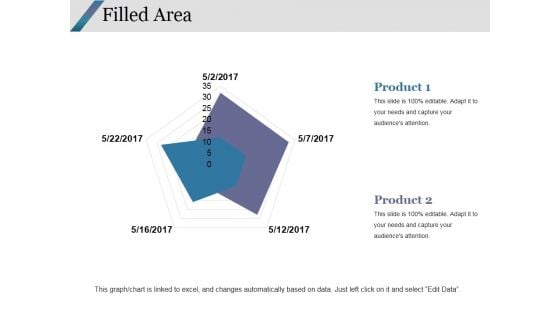
Filled Area Ppt PowerPoint Presentation Infographics Graphics Design
This is a filled area ppt powerpoint presentation infographics graphics design. This is a two stage process. The stages in this process are filled area, finance, marketing, strategy, analysis.
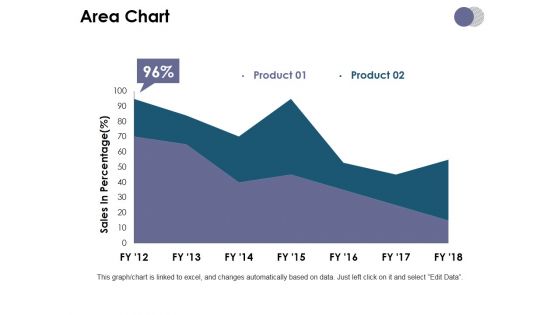
Area Chart Ppt PowerPoint Presentation Summary Format
This is a area chart ppt powerpoint presentation summary format. This is a two stage process. The stages in this process are area chart, planning, marketing, strategy, finance, business.
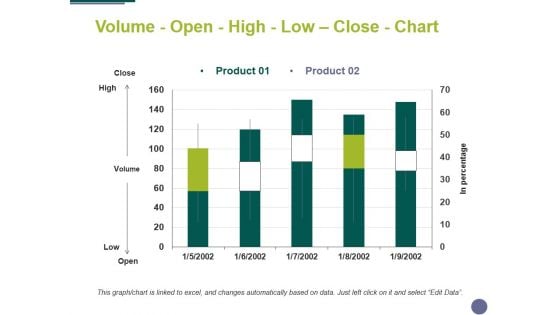
Volume Open High Low Close Chart Ppt PowerPoint Presentation Pictures Slideshow
This is a volume open high low close chart ppt powerpoint presentation pictures slideshow. This is a two stage process. The stages in this process are volume, open, high, low, close, chart.
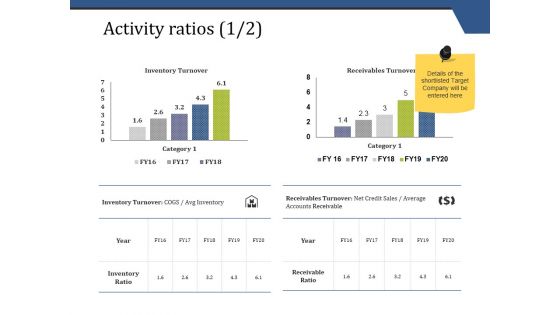
Activity Ratios Template 1 Ppt PowerPoint Presentation Show Graphics
This is a activity ratios template 1 ppt powerpoint presentation show graphics. This is a two stage process. The stages in this process are inventory turnover, receivables turnover, inventory ratio, receivable ratio.
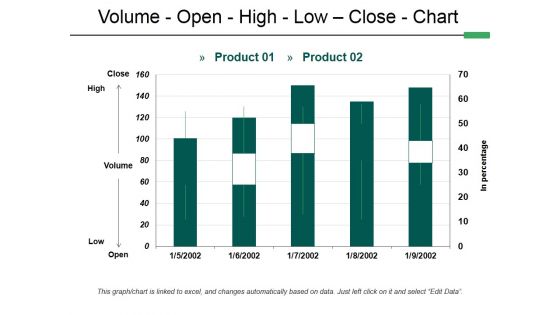
Volume Open High Low Close Chart Ppt PowerPoint Presentation Infographic Template Guidelines
This is a volume open high low close chart ppt powerpoint presentation infographic template guidelines. This is a two stage process. The stages in this process are volume, open, high, low, close, chart.
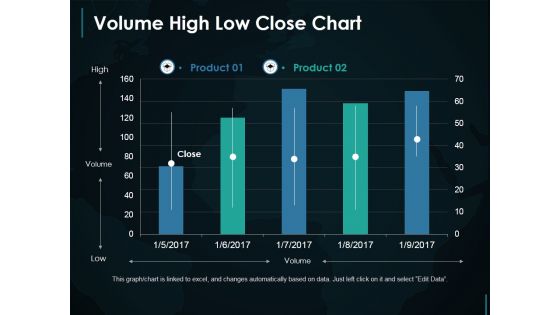
Volume High Low Close Chart Ppt PowerPoint Presentation Slides Example File
This is a volume high low close chart ppt powerpoint presentation slides example file. This is a two stage process. The stages in this process are high, volume, low.
Rader Chart Ppt PowerPoint Presentation Icon Graphic Tips
This is a rader chart ppt powerpoint presentation icon graphic tips. This is a two stage process. The stages in this process are rader chart, finance, analysis, business, marketing.
Volume High Low Close Chart Ppt PowerPoint Presentation Icon Graphics Pictures
This is a volume high low close chart ppt powerpoint presentation icon graphics pictures. This is a two stage process. The stages in this process are high, volume, low.
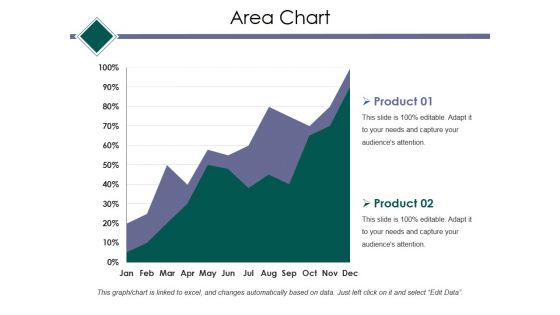
Area Chart Ppt PowerPoint Presentation Model Layout
This is a area chart ppt powerpoint presentation model layout. This is a two stage process. The stages in this process are area chart, finance, marketing, strategy, analysis, business.

Column Chart Ppt PowerPoint Presentation Infographic Template Slides
This is a column chart ppt powerpoint presentation infographic template slides. This is a two stage process. The stages in this process are column chart, finance, marketing, strategy, business.
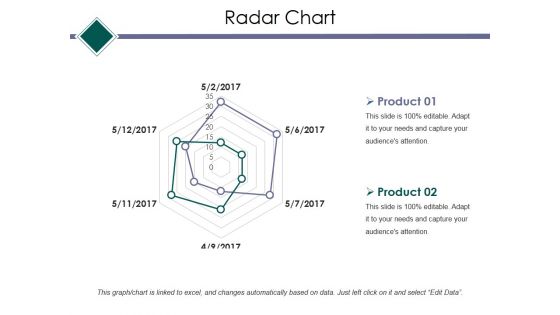
Radar Chart Ppt PowerPoint Presentation Infographic Template Example Topics
This is a radar chart ppt powerpoint presentation infographic template example topics. This is a two stage process. The stages in this process are radar chart, finance, marketing, strategy, business.
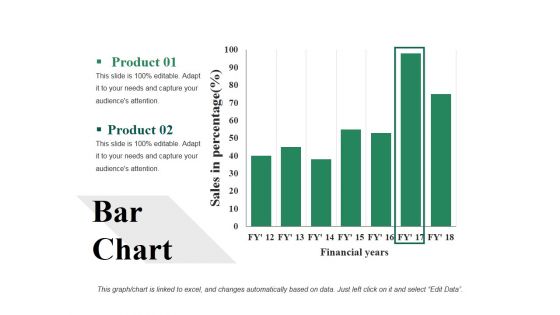
Bar Chart Ppt PowerPoint Presentation Visual Aids Backgrounds
This is a bar chart ppt powerpoint presentation visual aids backgrounds. This is a two stage process. The stages in this process are bar chart, analysis, strategy, finance, business.
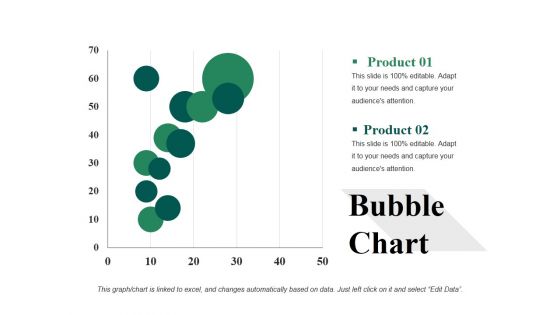
Bubble Chart Ppt PowerPoint Presentation Infographic Template Example 2015
This is a bubble chart ppt powerpoint presentation infographic template example 2015. This is a two stage process. The stages in this process are analysis, strategy, finance, business, bubble chart.

Clustered Chart Ppt PowerPoint Presentation Gallery Background Images
This is a clustered chart ppt powerpoint presentation gallery background images. This is a two stage process. The stages in this process are clustered chart, analysis, strategy, finance, business.
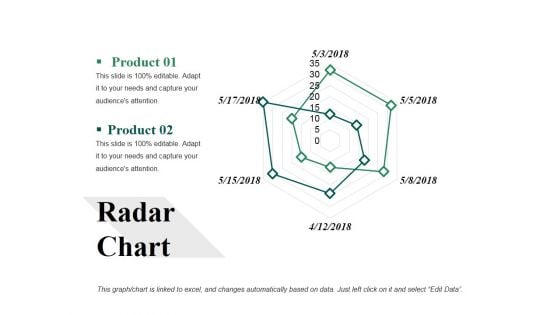
Radar Chart Ppt PowerPoint Presentation File Background Image
This is a radar chart ppt powerpoint presentation file background image. This is a two stage process. The stages in this process are radar chart, finance, analysis, marketing, business.
Rader Chart Ppt PowerPoint Presentation Icon Slide Portrait
This is a rader chart ppt powerpoint presentation icon slide portrait. This is a two stage process. The stages in this process are rader chart, business, analysis, finance, marketing.
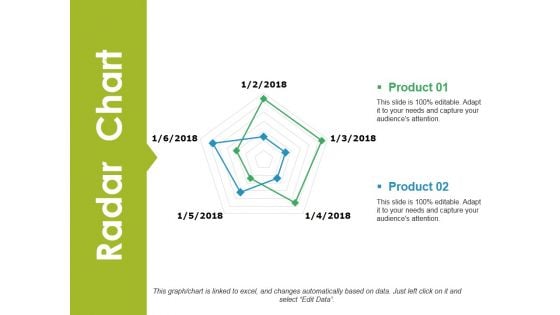
Radar Chart Ppt PowerPoint Presentation Infographic Template Tips
This is a radar chart ppt powerpoint presentation infographic template tips. This is a two stage process. The stages in this process are radar chart, business, finance, analysis, strategy.
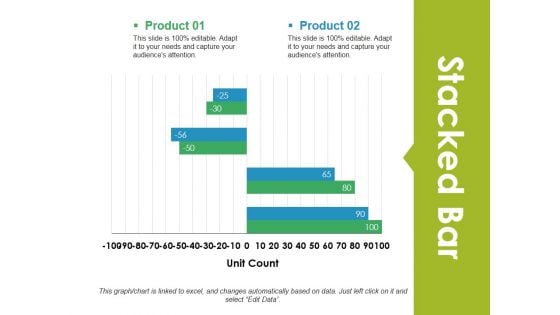
Stacked Bar Ppt PowerPoint Presentation Visual Aids Gallery
This is a stacked bar ppt powerpoint presentation visual aids gallery. This is a two stage process. The stages in this process are stacked bar, analysis, finance, marketing, strategy.
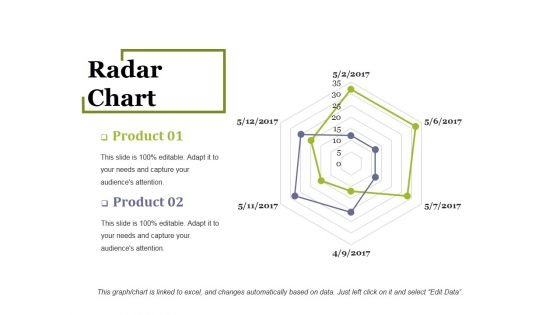
Radar Chart Ppt PowerPoint Presentation Infographic Template Outline
This is a radar chart ppt powerpoint presentation infographic template outline. This is a two stage process. The stages in this process are radar chart, finance, analysis, management, business.
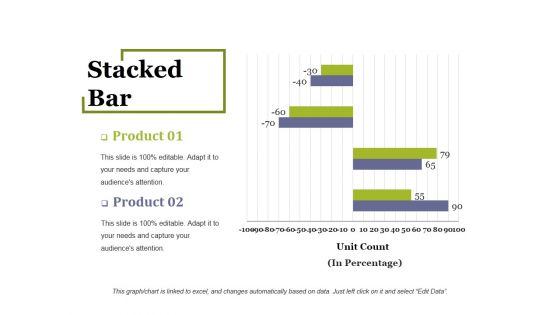
Stacked Bar Ppt PowerPoint Presentation Outline Example File
This is a stacked bar ppt powerpoint presentation outline example file. This is a two stage process. The stages in this process are stacked bar, finance, analysis, management, business.


 Continue with Email

 Home
Home


