Two Graphs
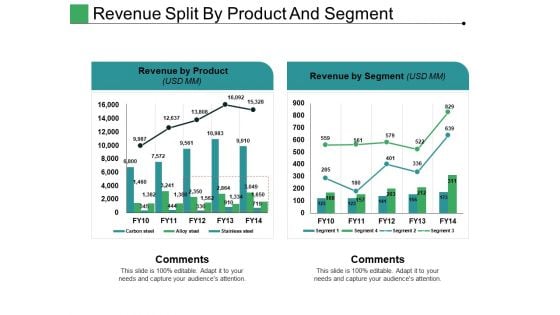
Revenue Split By Product And Segment Ppt PowerPoint Presentation Slides Infographics
This is a revenue split by product and segment ppt powerpoint presentation slides infographics. This is a two stage process. The stages in this process are revenue by product, revenue by segment, comments.
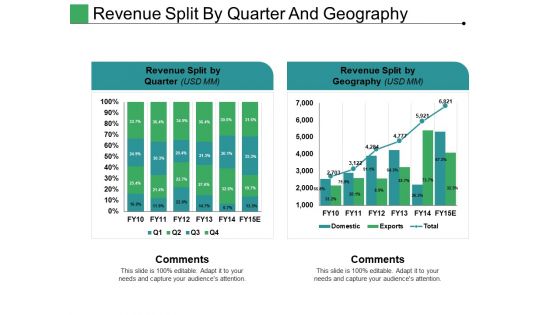
Revenue Split By Quarter And Geography Ppt PowerPoint Presentation Professional Rules
This is a revenue split by quarter and geography ppt powerpoint presentation professional rules. This is a two stage process. The stages in this process are revenue split by quarter, revenue split by geography, comments.
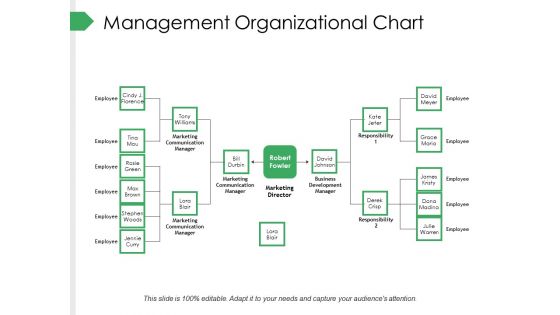
Management Organizational Chart Ppt PowerPoint Presentation Summary Gallery
This is a management organizational chart ppt powerpoint presentation summary gallery. This is a two stage process. The stages in this process are employee, marketing communication manager, marketing director, business development manager, responsibility, tony williams.
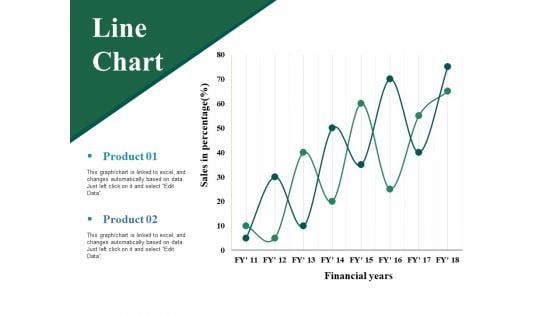
Line Chart Ppt PowerPoint Presentation Professional Grid
This is a line chart ppt powerpoint presentation professional grid. This is a two stage process. The stages in this process are sales in percentage, financial years, product, line chart.
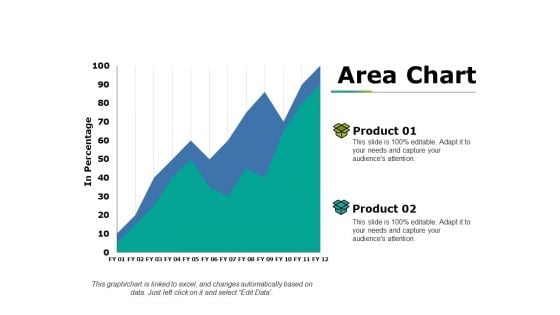
Area Chart Ppt PowerPoint Presentation Show Professional
This is a area chart ppt powerpoint presentation show professional. This is a two stage process. The stages in this process are product, in percentage, area chart, growth, success.
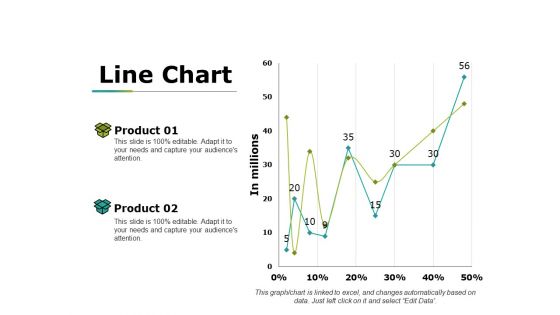
Line Chart Ppt PowerPoint Presentation Infographic Template Design Ideas
This is a line chart ppt powerpoint presentation infographic template design ideas. This is a two stage process. The stages in this process are product, in millions, percentage, line chart, success.
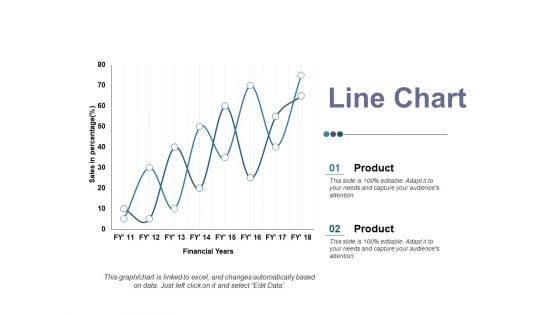
Line Chart Ppt PowerPoint Presentation Ideas Elements
This is a line chart ppt powerpoint presentation ideas elements. This is a two stage process. The stages in this process are product, sales in percentage, financial year, business, line chart.
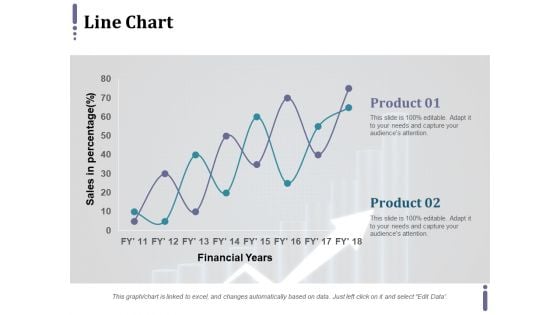
Line Chart Ppt PowerPoint Presentation Infographic Template Master Slide
This is a line chart ppt powerpoint presentation infographic template master slide. This is a two stage process. The stages in this process are product, financial years, sales in percentage.
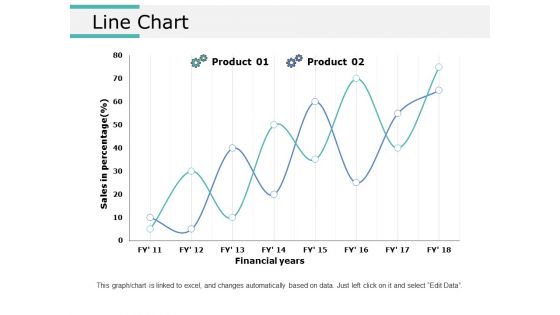
Line Chart Ppt PowerPoint Presentation Ideas Graphics Tutorials
This is a line chart ppt powerpoint presentation ideas graphics tutorials. This is a two stage process. The stages in this process are line chart, marketing, strategy, planning, finance.
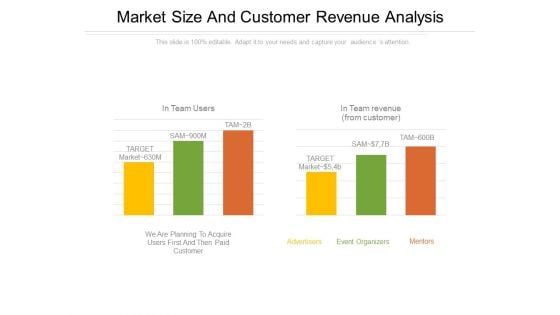
Market Size And Customer Revenue Analysis PowerPoint Presentation Examples
This is a market size and customer revenue analysis powerpoint presentation examples. This is a two stage process. The stages in this process are advertisers, mentors, event organizers, target, in team users.
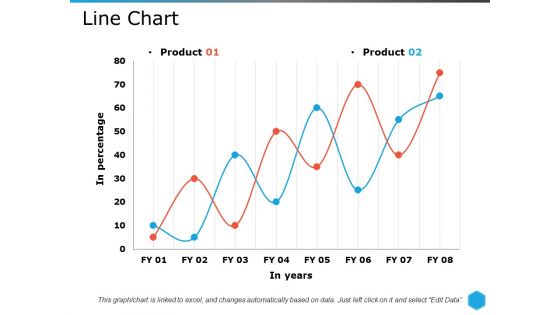
Line Chart Ppt PowerPoint Presentation Pictures Themes
This is a line chart ppt powerpoint presentation pictures themes. This is a two stage process. The stages in this process are line chart, growth, strategy, marketing, strategy, business.
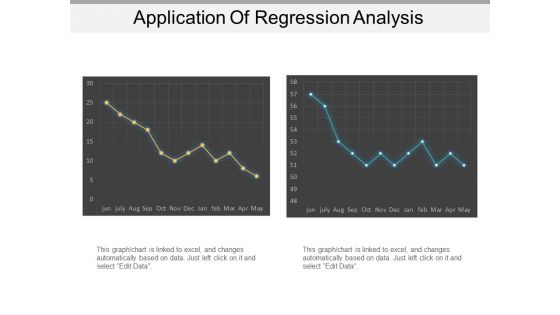
Application Of Regression Analysis Ppt PowerPoint Presentation Show Good
This is a application of regression analysis ppt powerpoint presentation show good. This is a two stage process. The stages in this process are linear periodization, linear growth, linear progression.
Area Chart Ppt PowerPoint Presentation Icon Summary
This is a area chart ppt powerpoint presentation icon summary. This is a two stage process. The stages in this process are financial year, area chart, in percentage, product.
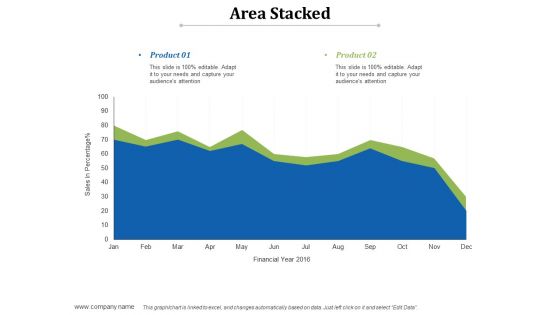
Area Stacked Ppt PowerPoint Presentation Infographics Shapes
This is a area stacked ppt powerpoint presentation infographics shapes. This is a two stage process. The stages in this process are product, area stacked, sales in percentage, financial year.
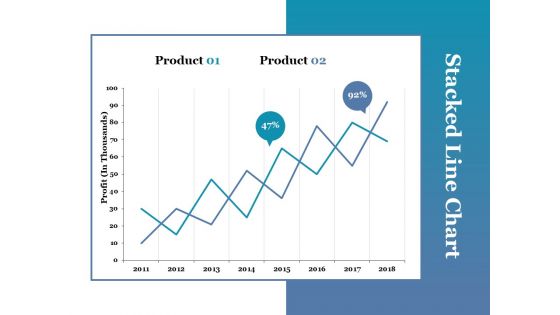
Stacked Line Chart Ppt PowerPoint Presentation Portfolio Picture
This is a stacked line chart ppt powerpoint presentation portfolio picture. This is a two stage process. The stages in this process are stacked line chart, product, profit, growth.
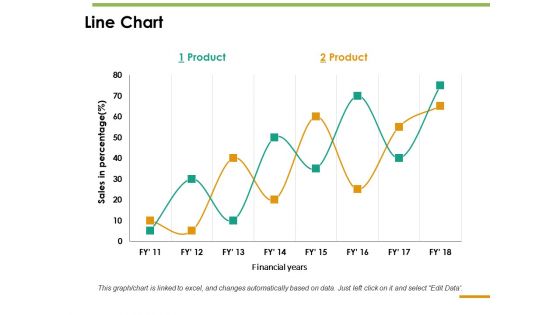
Line Chart Ppt PowerPoint Presentation Inspiration Guide
This is a line chart ppt powerpoint presentation inspiration guide. This is a two stage process. The stages in this process are line chart, sales in percentage, product, financial years.
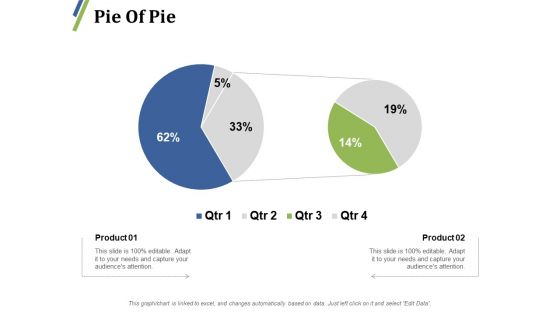
Pie Of Pie Ppt PowerPoint Presentation Visual Aids Backgrounds
This is a pie of pie ppt powerpoint presentation visual aids backgrounds. This is a two stage process. The stages in this process are pie, process, percentage, finance, business.
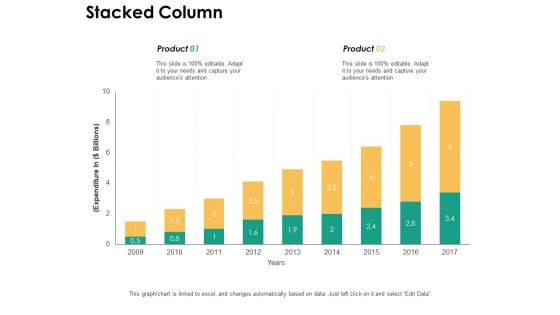
Stacked Column With Growth Ppt PowerPoint Presentation Pictures Guidelines
This is a stacked column with growth ppt powerpoint presentation pictures guidelines. This is a two stage process. The stages in this process are finance, business, planning, marketing, stacked column.
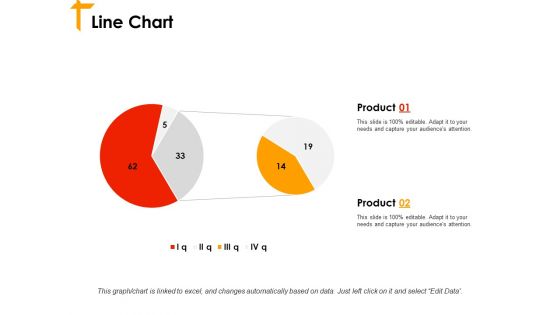
Line Chart Ppt PowerPoint Presentation Styles Format Ideas
This is a line chart ppt powerpoint presentation styles format ideas. This is a two stage process. The stages in this process are line chart, financial, business, planning, marketing, management.
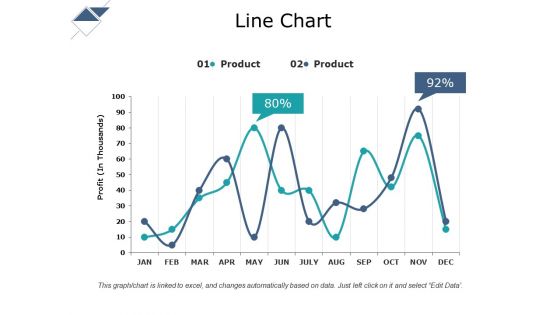
Line Chart Ppt PowerPoint Presentation Gallery Format Ideas
This is a line chart ppt powerpoint presentation gallery format ideas. This is a two stage process. The stages in this process are line chart, product, in year, profit.
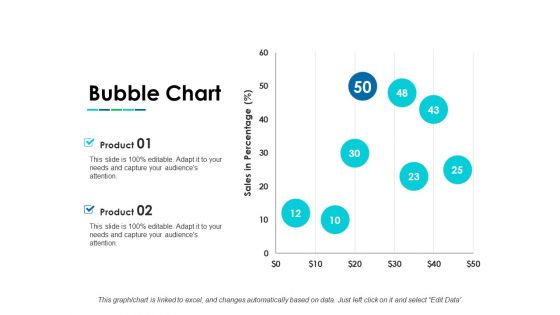
Bubble Chart Ppt PowerPoint Presentation Infographic Template Layouts
This is a bubble chart ppt powerpoint presentation infographic template layouts. This is a two stage process. The stages in this process are bubble chart, product, sales in percentage, growth.

Column Chart Ppt PowerPoint Presentation Gallery Background Images
This is a column chart ppt powerpoint presentation gallery background images. This is a two stage process. The stages in this process are column chart, product, year, growth, expenditure.
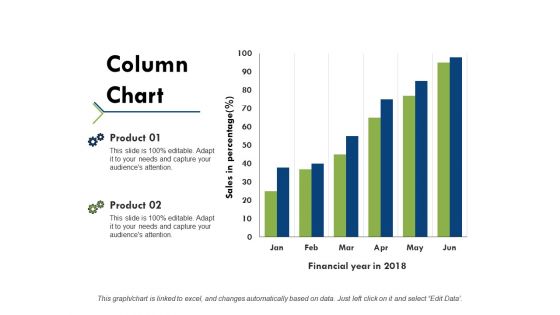
Column Chart Ppt PowerPoint Presentation Portfolio Example Topics
This is a column chart ppt powerpoint presentation portfolio example topics. This is a two stage process. The stages in this process are product, financial year, sales in percentage, column chart.
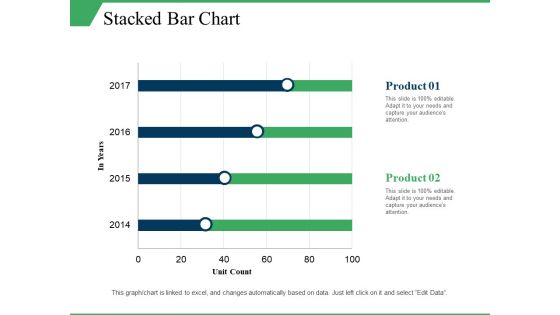
Stacked Bar Chart Ppt PowerPoint Presentation Infographics Elements
This is a stacked bar chart ppt powerpoint presentation infographics elements. This is a two stage process. The stages in this process are stacked bar chart, product, unit count, in year.
Organizational Governance Framework Ppt PowerPoint Presentation Icon Mockup
This is a organizational governance framework ppt powerpoint presentation icon mockup. This is a two stage process. The stages in this process are project governance, governance structure, project structure.
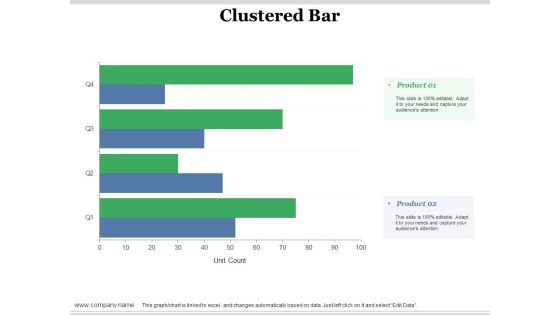
Clustered Bar Ppt PowerPoint Presentation Slides Example Topics
This is a clustered bar ppt powerpoint presentation slides example topics. This is a two stage process. The stages in this process are clustered bar, product, unit count, business, marketing.
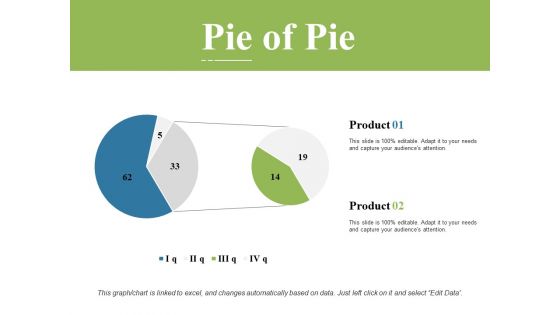
Pie Of Pie Ppt PowerPoint Presentation Styles Graphics Template
This is a pie of pie ppt powerpoint presentation styles graphics template. This is a two stage process. The stages in this process are Pie chart, finance, marketing, management, investment.
Area Chart Ppt PowerPoint Presentation Inspiration Icons Ppt PowerPoint Presentation Professional File Formats
This is a area chart ppt powerpoint presentation inspiration icons ppt powerpoint presentation professional file formats. This is a two stage process. The stages in this process are area chart, product, percentage, business, growth.
Market Drivers Global Market Growth Ppt PowerPoint Presentation Slides Icons
This is a market drivers global market growth ppt powerpoint presentation slides icons. This is a two stage process. The stages in this process are global market growth, business, marketing, market drivers, growth.
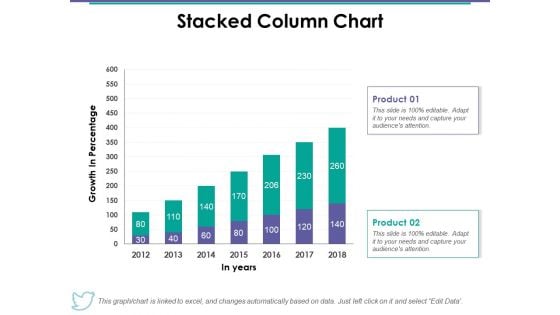
Stacked Column Chart Ppt PowerPoint Presentation Summary Gallery
This is a stacked column chart ppt powerpoint presentation summary gallery. This is a two stage process. The stages in this process are stacked column chart, product, in years, growth, percentage.
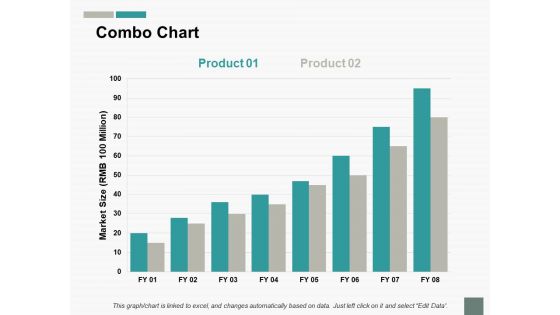
Combo Chart Finance Ppt PowerPoint Presentation Infographic Template Graphics
This is a combo chart finance ppt powerpoint presentation infographic template graphics. This is a two stage process. The stages in this process are growth, finance, marketing, management, investment.
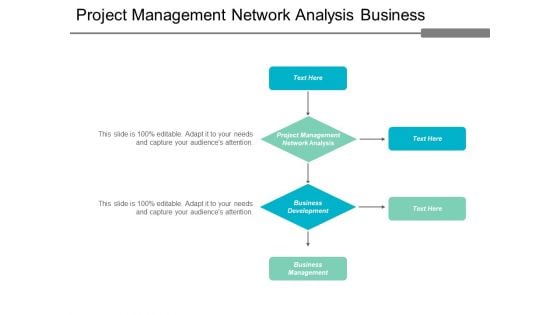
Project Management Network Analysis Business Development Business Management Ppt PowerPoint Presentation Gallery Visuals
This is a project management network analysis business development business management ppt powerpoint presentation gallery visuals. This is a two stage process. The stages in this process are project management network analysis, business development, business management.
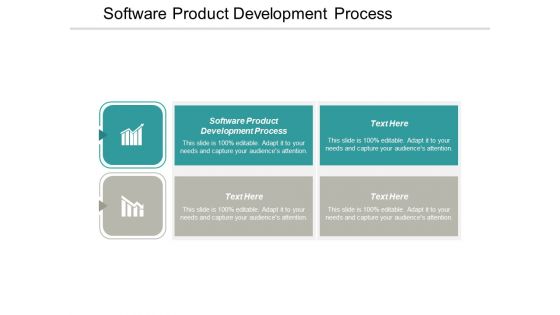
Software Product Development Process Ppt PowerPoint Presentation Infographics Pictures Cpb
This is a software product development process ppt powerpoint presentation infographics pictures cpb. This is a two stage process. The stages in this process are software product development process.
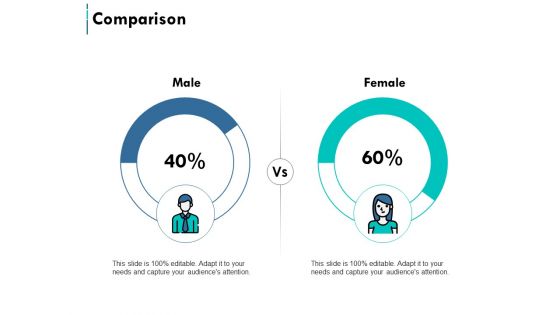
Comparison Male And Female Ppt PowerPoint Presentation Styles Infographic Template
This is a comparison male and female ppt powerpoint presentation styles infographic template. This is a two stage process. The stages in this process are business, management, marketing, comparison.
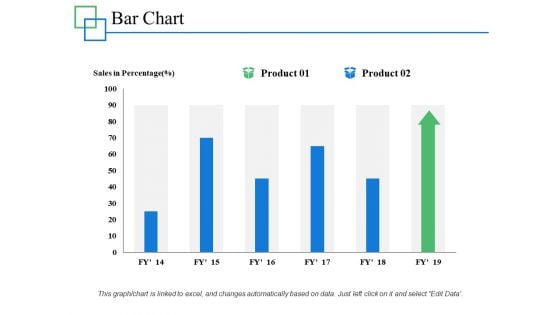
Bar Chart Percentage Product Ppt PowerPoint Presentation Layouts Designs Download
This is a bar chart percentage product ppt powerpoint presentation layouts designs download. This is a two stage process. The stages in this process are percentage, product, business, management.

Stacked Column Percentage Product Ppt PowerPoint Presentation Infographics Outfit
This is a stacked column percentage product ppt powerpoint presentation infographics outfit. This is a two stage process. The stages in this process are marketing, business, management, percentage, product.
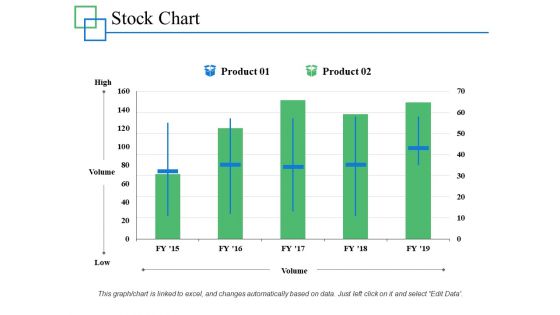
Stock Chart Management Investment Ppt PowerPoint Presentation Infographics Professional
This is a stock chart management investment ppt powerpoint presentation infographics professional. This is a two stage process. The stages in this process are marketing, business, management, percentage, product.
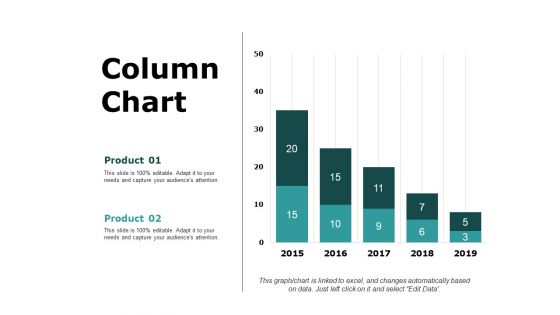
Column Chart Finance Marketing Ppt PowerPoint Presentation Model Example Introduction
This is a column chart finance marketing ppt powerpoint presentation model example introduction. This is a two stage process. The stages in this process are business, management, marketing, percentage, product.
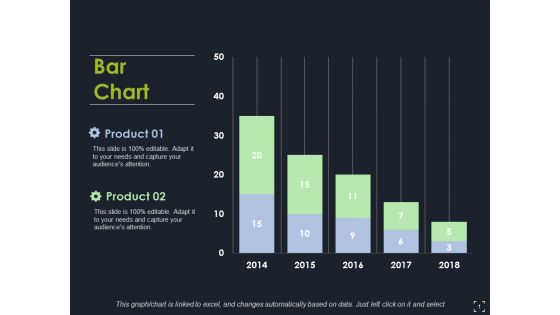
Bar Chart Ppt PowerPoint Presentation Model Clipart Images
This is a bar chart ppt powerpoint presentation model clipart images. This is a two stage process. The stages in this process are bar chart, finance, marketing, strategy, analysis.
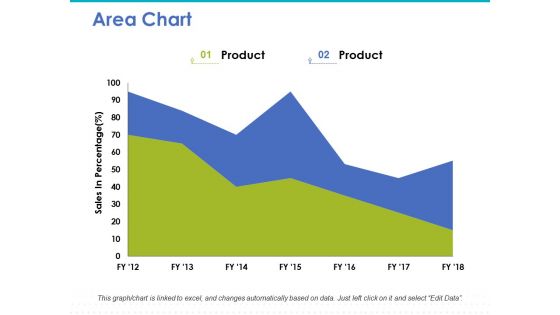
Area Chart Ppt PowerPoint Presentation Infographic Template Inspiration
This is a area chart ppt powerpoint presentation infographic template inspiration. This is a two stage process. The stages in this process are area chart, marketing, strategy, finance, planning.
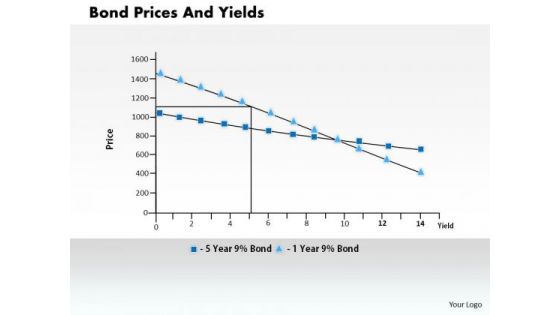
Business Framework Bond Prices And Yields PowerPoint Presentation
This power point diagram slide has been crafted with graphic of statistics of bond price and yields. Display the dependency in-between these two fields with this innovative diagram slide. This slide is very useful for financial presentations.

Business Framework Business Unit PowerPoint Presentation
This Professional Power Point template has been crafted for business unit representation. This diagram template slide contains the graphic of two interconnected flow chart with three stages. Use this slide for displaying process flow for business and marketing activities.
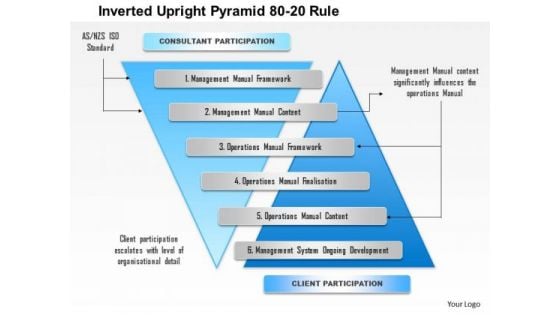
Business Framework Inverted Upright Pyramid 80 20 Rule PowerPoint Presentation
This exclusive power point diagram slide has been crafted with graphic of two inverted pyramids. This graphic template slide contains the concept of 80/20 rule. Use this PPT diagram slide for business topics.
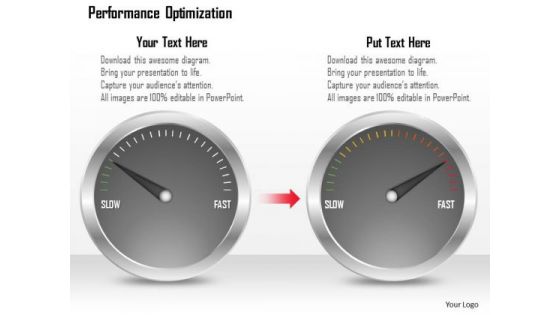
Business Framework Performance Optimization PowerPoint Presentation
Explain the concept of performance optimization with this exclusive template slide. This PPT diagram slide contains the graphic of two meters with maximum ratings. Use this PPT diagram slide and build exclusive presentation for your viewers.
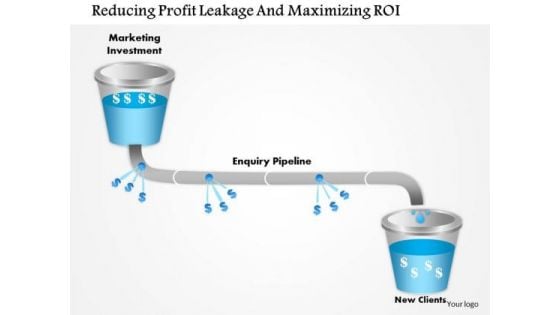
Business Framework Reducing Profit Leakage And Maximizing Roi PowerPoint Presentation
Two funnels with interconnection has been used to design this Power Point template slide. This diagram slide contains the concept of reducing profit leakage and maximizing the ROI. Use this PPT slide for business and finance related presentations.
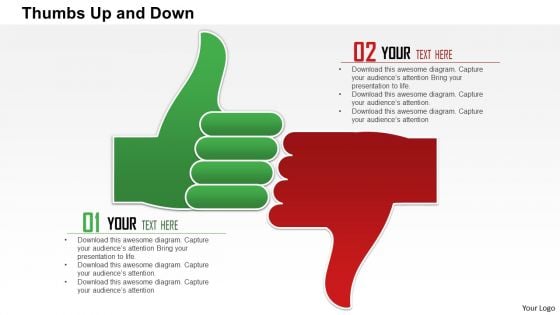
Business Framework Thumbs Up And Down PowerPoint Presentation
Graphic of two thumbs are used to decorate this Power Point template slide. This PPT slide contains the concept of like and dislike. Use this PPT slide for business and social topics related presentations.
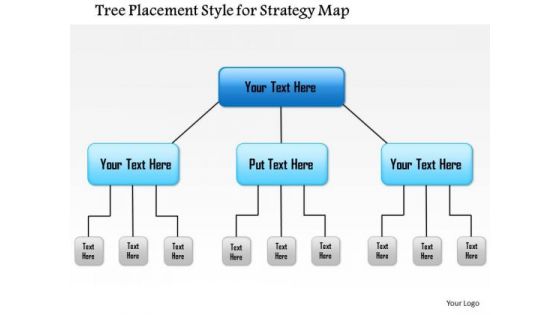
Business Framework Tree Placement Style For Strategy Map PowerPoint Presentation
A two layer flow chart diagram has been used to design this PPT slide. This PPT slide contains the concept of mapping for strategy. This PPt slide is useful for business and marketing strategy related presentations.
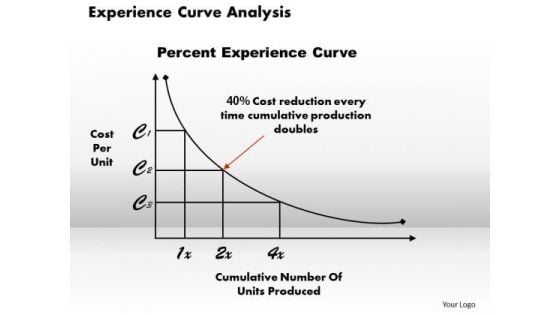
Business Framework Experience Curve Analysis PowerPoint Presentation
A two way linear curve has been used to design this PPT diagram. This business framework contains the concept of curve analysis and management. Use this PPT diagram for your business and management related topics.
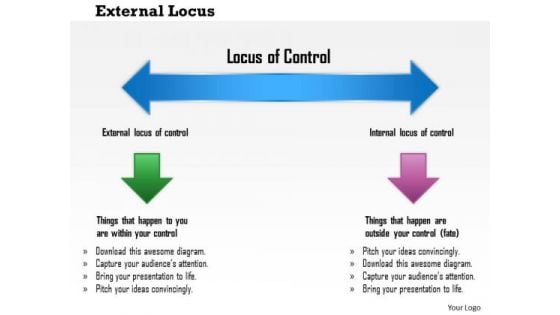
Business Framework External Locus PowerPoint Presentation
This business framework PPT diagram has been crafted with graphic of two directional linear arrow diagram. This PPT diagram contains the linear flow. This PPT diagram may be used for business strategy and finance transformation.
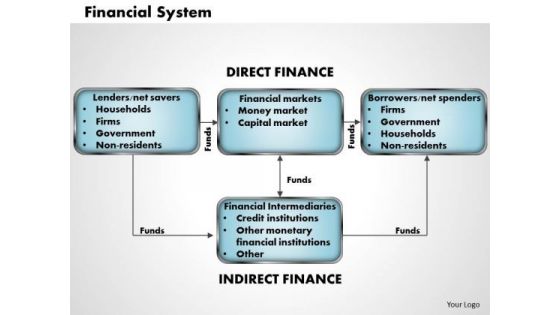
Business Framework Financial System PowerPoint Presentation
Define the financial system in your presentation with this unique diagram. This PPT diagram contain the graphic of two staged linear flow chart. This PPT diagram may be used for finance and business presentations.
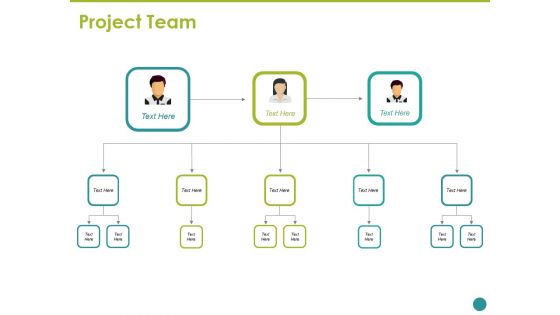
Project Team Template 1 Ppt PowerPoint Presentation Portfolio Outline
This is a project team template 1 ppt powerpoint presentation portfolio outline. This is a two stage process. The stages in this process are arrow, project, team work, communication, planning.
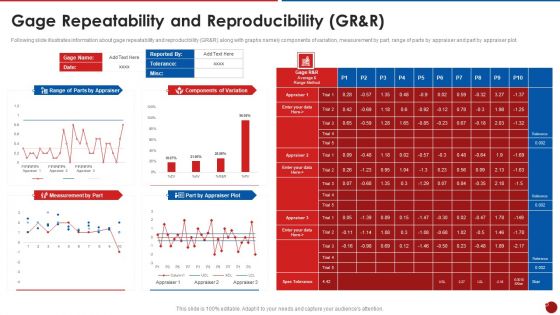
Quality Assurance Templates Set 2 Gage Repeatability And Reproducibility Gr And R Sample PDF
Following slide illustrates information about gage repeatability and reproducibility GR and R along with graphs namely components of variation, measurement by part, range of parts by appraiser and part by appraiser plot. Deliver an awe inspiring pitch with this creative quality assurance templates set 2 gage repeatability and reproducibility gr and r sample pdf bundle. Topics like gage repeatability and reproducibility can be discussed with this completely editable template. It is available for immediate download depending on the needs and requirements of the user.
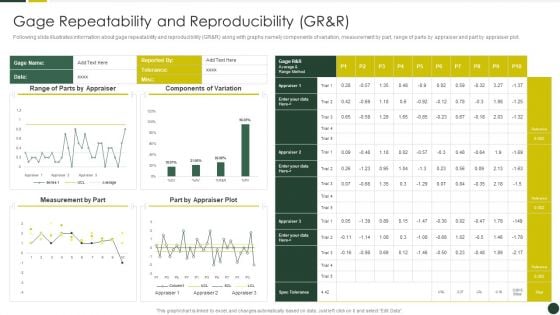
Quality Management Plan Templates Set 2 Gage Repeatability And Reproducibility GR And R Download PDF
Following slide illustrates information about gage repeatability and reproducibility GR and R along with graphs namely components of variation, measurement by part, range of parts by appraiser and part by appraiser plot. Deliver an awe inspiring pitch with this creative Quality Management Plan Templates Set 2 Gage Repeatability And Reproducibility GR And R Download PDF bundle. Topics like Components Variation, Measurement Part, Range Parts can be discussed with this completely editable template. It is available for immediate download depending on the needs and requirements of the user.
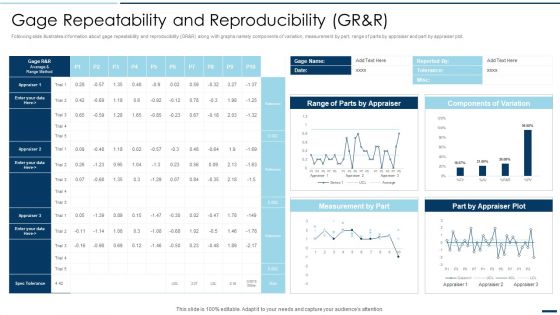
QA Plan Set 2 Gage Repeatability And Reproducibility GR And R Ppt PowerPoint Presentation Gallery Introduction PDF
Following slide illustrates information about gage repeatability and reproducibility GR and R along with graphs namely components of variation, measurement by part, range of parts by appraiser and part by appraiser plot. Deliver an awe inspiring pitch with this creative QA Plan Set 2 Gage Repeatability And Reproducibility GR And R Ppt PowerPoint Presentation Gallery Introduction PDF bundle. Topics like Components Variation, Part Appraiser Plot, Measurement Part can be discussed with this completely editable template. It is available for immediate download depending on the needs and requirements of the user.
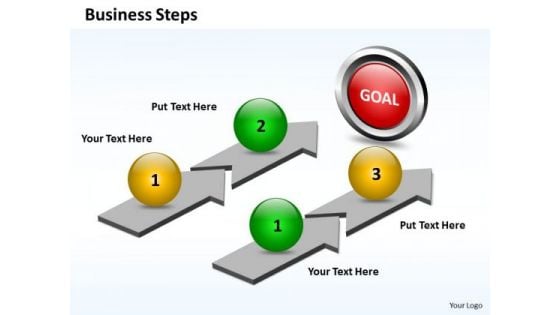
Business Charts PowerPoint Templates Parallel Plan Explain Steps
Business Charts PowerPoint templates parallel plan explain steps-This PowerPoint Diagram consists of two parallel processes each having two stages to reach till Destination. This PowerPoint Diagram imitates the concept of action, advance, case, channels, course, course of action, development, evolution, fashion.-Business Charts PowerPoint templates parallel plan explain steps You believe in fair dealings. Our Business Charts PowerPoint Templates Parallel Plan Explain Steps action your thoughts.
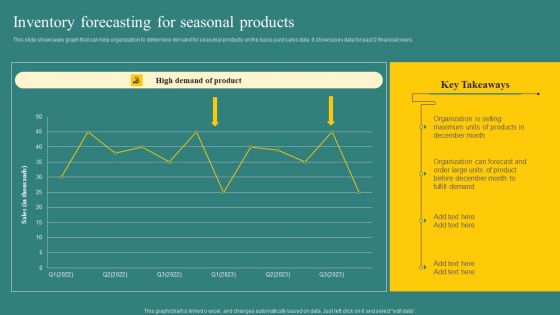
Inventory Forecasting For Seasonal Products Structure PDF
This slide showcases graph that can help organization to determine demand for seasonal products on the basis past sales data. It showcases data for past 2 financial years. There are so many reasons you need a Inventory Forecasting For Seasonal Products Structure PDF. The first reason is you can not spend time making everything from scratch, Thus, Slidegeeks has made presentation templates for you too. You can easily download these templates from our website easily.
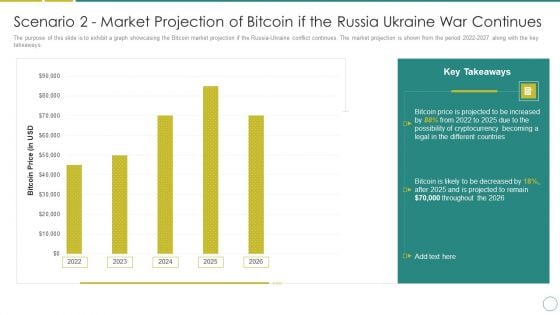
Russia Ukraine Scenario 2 Market Projection Of Bitcoin If The Russia Ukraine War Continues Brochure PDF
The purpose of this slide is to exhibit a graph showcasing the Bitcoin market projection if the Russia-Ukraine conflict continues. The market projection is shown from the period 2022-2027 along with the key takeaways. Deliver and pitch your topic in the best possible manner with this russia ukraine scenario 2 market projection of bitcoin if the russia ukraine war continues brochure pdf. Use them to share invaluable insights on bitcoin price, 2022 to 2026 and impress your audience. This template can be altered and modified as per your expectations. So, grab it now.
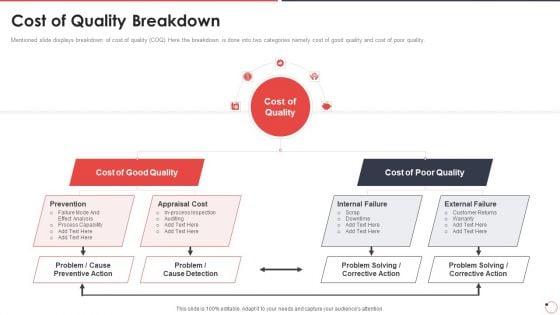
Quality Assurance Templates Set 1 Cost Of Quality Breakdown Ppt Slides Show PDF
Mentioned slide displays breakdown of cost of quality COQ Here the breakdown is done into two categories namely cost of good quality and cost of poor quality. This is a quality assurance templates set 1 cost of quality breakdown ppt slides show pdf template with various stages. Focus and dispense information on two stages using this creative set, that comes with editable features. It contains large content boxes to add your information on topics like cost of quality, cost of good quality, cost of poor quality . You can also showcase facts, figures, and other relevant content using this PPT layout. Grab it now.
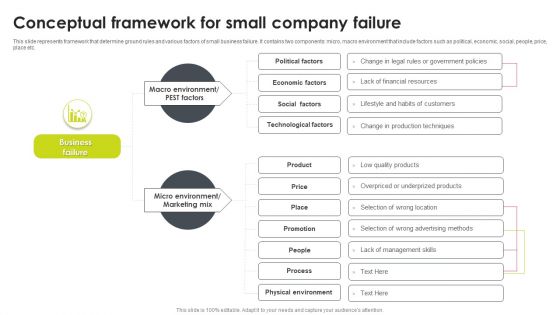
Conceptual Framework For Small Company Failure Demonstration PDF
This slide represents framework that determine ground rules and various factors of small business failure. It contains two components micro, macro environment that include factors such as political, economic, social, people, price, place etc. Presenting Conceptual Framework For Small Company FaiConceptual Framework For Small Company Failure Demonstration PDF to dispense important information. This template comprises two stages. It also presents valuable insights into the topics including Business Failure, Economic Factors, Technological Factors. This is a completely customizable PowerPoint theme that can be put to use immediately. So, download it and address the topic impactfully.
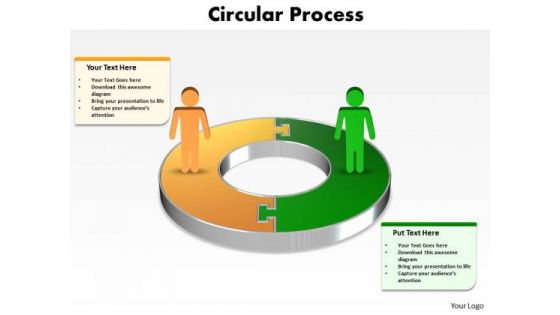
Ppt Busines Men Silhouettes Standing On 3d Circular PowerPoint Templates
PPT busines men silhouettes standing on 3d circular PowerPoint Templates-This PowerPoint Diagram signifies the two approaches opposite to each other explained by two different persons. This Business oriented Diagram will be very helpful for comparing different approaches. -PPT busines men silhouettes standing on 3d circular PowerPoint Templates-Arrow, Business, Challenge, Character, Circle, Circular, Concept, Connected, Connection, Design, Element, Expression, Feeling, Figure, Fit, Game, Gesture, Gold, Green, Hold, Icon, Isolated, Metaphor, Motivate, Motivation, Object, Office, Over, Partner, Partnership, Piece, Pose, Presentation, Problem, Process, Puzzle, Recycle, Recycling, Sign, Solution, Symbol, Team, Teamwork Conduct yourself creditably with our Ppt Busines Men Silhouettes Standing On 3d Circular PowerPoint Templates. They will let you dominate the dais.


 Continue with Email

 Home
Home


