Two Phased Approach
Cloud Cost Management Strategy Icon Designs PDF
Presenting Cloud Cost Management Strategy Icon Designs PDF to dispense important information. This template comprises three stages. It also presents valuable insights into the topics including Cloud Cost Management, Strategy Icon. This is a completely customizable PowerPoint theme that can be put to use immediately. So, download it and address the topic impactfully.
Corporate Profit Sustainability Strategy Icon Microsoft PDF
Presenting Corporate Profit Sustainability Strategy Icon Microsoft PDF to dispense important information. This template comprises three stages. It also presents valuable insights into the topics including Corporate Profit, Sustainability Strategy Icon. This is a completely customizable PowerPoint theme that can be put to use immediately. So, download it and address the topic impactfully.
SEM Strategy Trends Icon Slides PDF
Presenting SEM Strategy Trends Icon Slides PDF to dispense important information. This template comprises four stages. It also presents valuable insights into the topics including SEM Strategy Trends Icon. This is a completely customizable PowerPoint theme that can be put to use immediately. So, download it and address the topic impactfully.
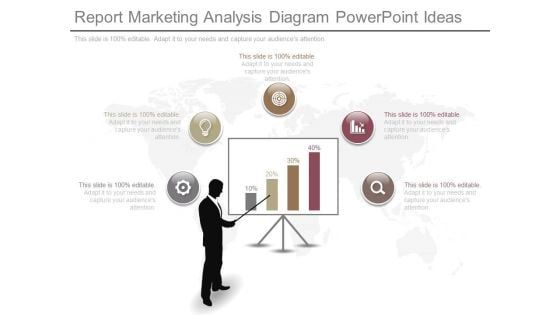
Report Marketing Analysis Diagram Powerpoint Ideas
This is a report marketing analysis diagram powerpoint ideas. This is a five stage process. The stages in this process are man, communication, board, graph, business.
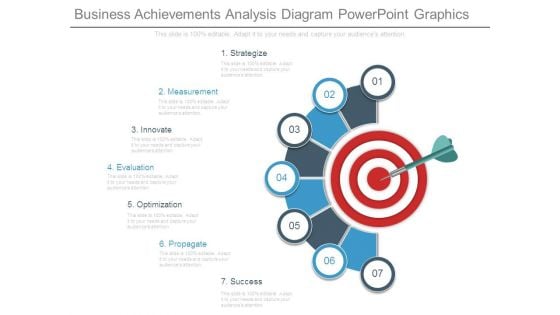
Business Achievements Analysis Diagram Powerpoint Graphics
This is a business achievements analysis diagram powerpoint graphics. This is a seven stage process. The stages in this process are strategize, measurement, innovate, evaluation, optimization, propagate, success.
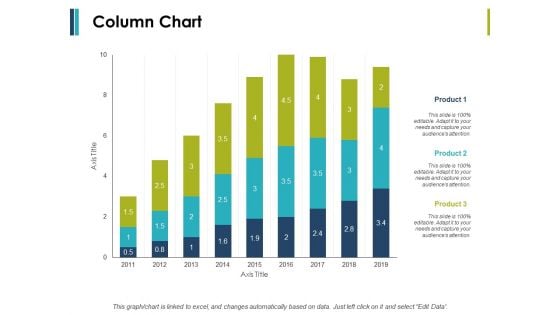
Column Chart And Graph Ppt PowerPoint Presentation File Introduction
This is a column chart and graph ppt powerpoint presentation file introduction. This is a three stage process. The stages in this process are finance, marketing, management, investment, analysis.
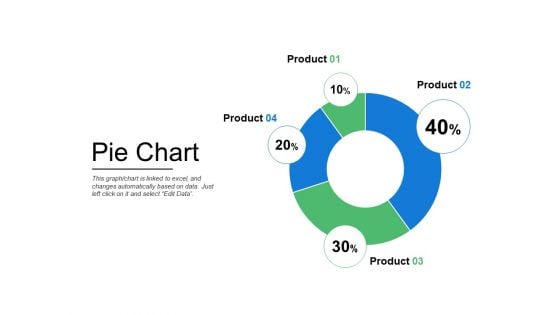
Pie Chart Finance Ppt PowerPoint Presentation Infographics Mockup
This is a pie chart finance ppt powerpoint presentation infographics mockup . This is a four stage process. The stages in this process are finance, marketing, management, investment, analysis.
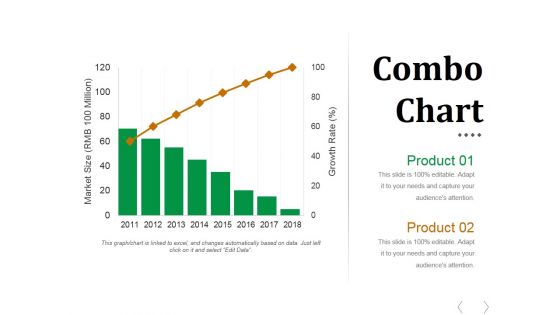
Combo Chart Ppt PowerPoint Presentation Model Gallery
This is a combo chart ppt powerpoint presentation model gallery. This is a eight stage process. The stages in this process are business, marketing, management, growth, timeline.

Three Text Tags Compare Chart Powerpoint Slides
This PowerPoint template has been designed with text tags and percentage data. You may download this PPT slide to display data comparison and analysis. Add this slide to your presentation and impress your superiors.
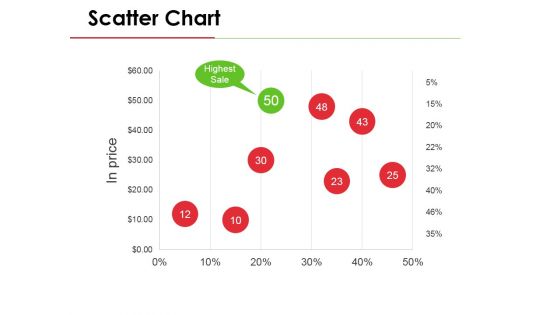
Scatter Chart Ppt PowerPoint Presentation Model Deck
This is a scatter chart ppt powerpoint presentation model deck. This is a eight stage process. The stages in this process are business, marketing, finance, management, strategy.
Financial Investment Analysis Ppt PowerPoint Presentation Icon Ideas
This is a financial investment analysis ppt powerpoint presentation icon ideas. This is a three stage process. The stages in this process are finance, marketing, management, investment, analysis.
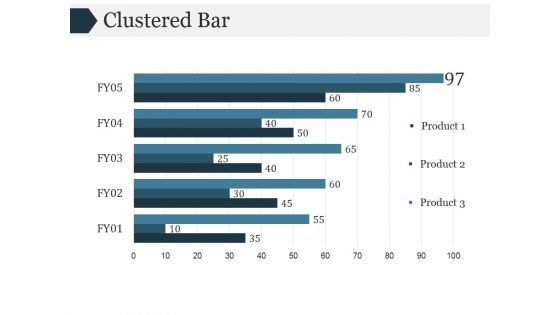
Clustered Bar Ppt PowerPoint Presentation Diagrams
This is a clustered bar ppt powerpoint presentation diagrams. This is a five stage process. The stages in this process are bar graph, marketing, strategy, analysis, business.
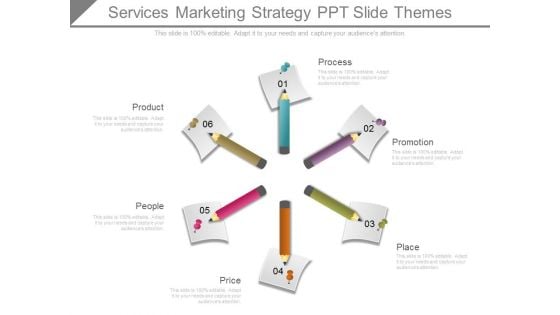
Services Marketing Strategy Ppt Slide Themes
This is a services marketing strategy ppt slide themes. This is a six stage process. The stages in this process are product, people, price, process, promotion, place.
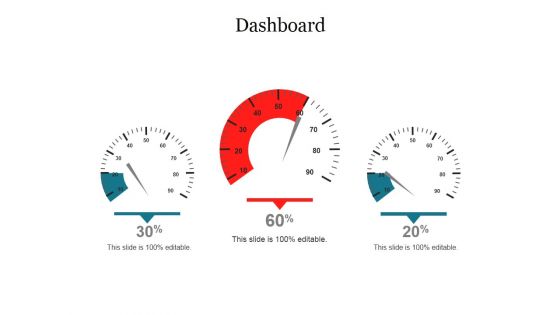
Dashboard Ppt PowerPoint Presentation Show Themes
This is a dashboard ppt powerpoint presentation show themes. This is a three stage process. The stages in this process are dashboard, management, planning, marketing, business, strategy.
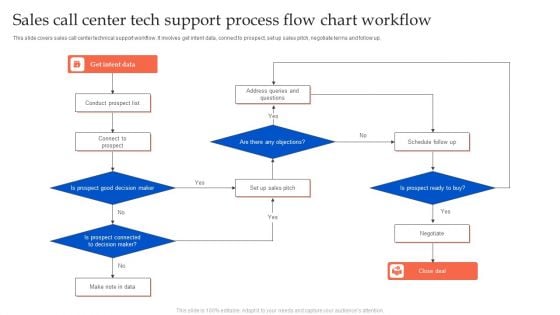
Sales Call Center Tech Support Process Flow Chart Workflow Microsoft PDF
This slide covers sales call center technical support workflow. It involves get intent data, connect to prospect, set up sales pitch, negotiate terms and follow up. Persuade your audience using this Sales Call Center Tech Support Process Flow Chart Workflow Microsoft PDF. This PPT design covers three stages, thus making it a great tool to use. It also caters to a variety of topics including Conduct Prospect List, Connect To Prospect, Schedule Follow Up. Download this PPT design now to present a convincing pitch that not only emphasizes the topic but also showcases your presentation skills.
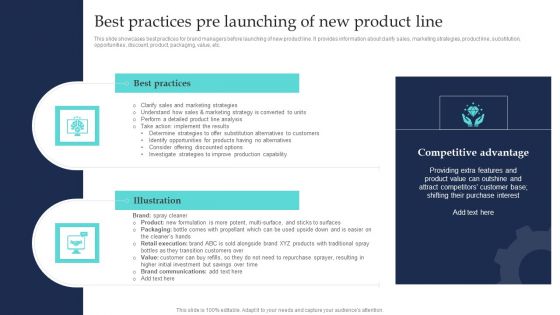
Commodity Line Extension Techniques Best Practices Pre Launching Of New Product Line Summary PDF
This slide showcases best practices for brand managers before launching of new product line. It provides information about clarify sales, marketing strategies, product line, substitution, opportunities, discount, product, packaging, value, etc. Whether you have daily or monthly meetings, a brilliant presentation is necessary. Commodity Line Extension Techniques Best Practices Pre Launching Of New Product Line Summary PDF can be your best option for delivering a presentation. Represent everything in detail using Commodity Line Extension Techniques Best Practices Pre Launching Of New Product Line Summary PDF and make yourself stand out in meetings. The template is versatile and follows a structure that will cater to your requirements. All the templates prepared by Slidegeeks are easy to download and edit. Our research experts have taken care of the corporate themes as well. So, give it a try and see the results.
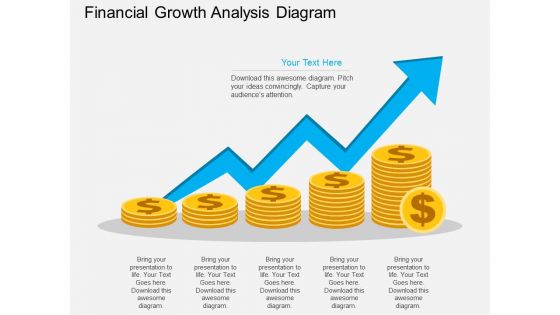
Financial Growth Analysis Diagram Powerpoint Template
Develop competitive advantage with our above template which contains coins stacks with blue arrow. This diagram may be used to exhibit financial growth analysis. You can edit text, color, shade and style as per you need.

Web Marketing Analysis Diagram Ppt Slides Design
This is a web marketing analysis diagram ppt slides design. This is a five stage process. The stages in this process are communication, global reach, growth, business plan, financial.
Data Search With Various Charts To Recognize Market Trends Icon Ppt PowerPoint Presentation Infographic Template Clipart PDF
Persuade your audience using this data search with various charts to recognize market trends icon ppt powerpoint presentation infographic template clipart pdf. This PPT design covers three stages, thus making it a great tool to use. It also caters to a variety of topics including data search with various charts to recognize market trends icon. Download this PPT design now to present a convincing pitch that not only emphasizes the topic but also showcases your presentation skills.
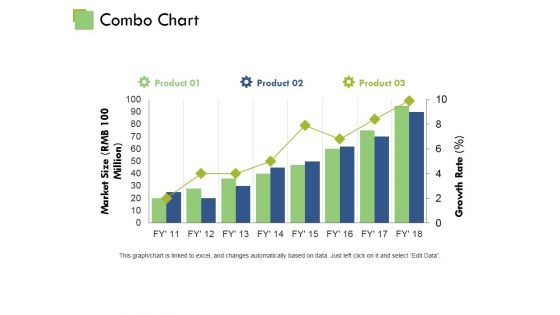
Combo Chart Ppt PowerPoint Presentation Gallery Mockup
This is a clustered column ppt powerpoint presentation portfolio good. This is a three stage process. The stages in this process are business, marketing, strategy, finance, planning.
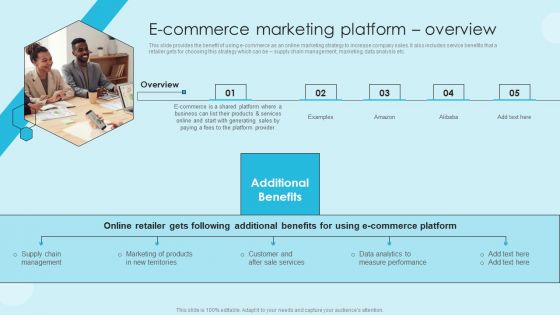
Online Marketing Techniques For Acquiring Clients Ecommerce Marketing Platform Overview Diagrams PDF
Make sure to capture your audiences attention in your business displays with our gratis customizable Online Marketing Techniques For Acquiring Clients Ecommerce Marketing Platform Overview Diagrams PDF. These are great for business strategies, office conferences, capital raising or task suggestions. If you desire to acquire more customers for your tech business and ensure they stay satisfied, create your own sales presentation with these plain slides.
Executive Summary Dashboard Icon To Develop Effective Marketing Strategy Themes PDF
Persuade your audience using this executive summary dashboard icon to develop effective marketing strategy themes pdf. This PPT design covers four stages, thus making it a great tool to use. It also caters to a variety of topics including executive summary dashboard icon to develop effective marketing strategy. Download this PPT design now to present a convincing pitch that not only emphasizes the topic but also showcases your presentation skills.
Competitive Analysis Template 1 Ppt PowerPoint Presentation Icon Show
This is a competitive analysis template 1 ppt powerpoint presentation icon show. This is a six stage process. The stages in this process are competitive, analysis, business, marketing, bar graph.

Our Graphs And Charts Ppt PowerPoint Presentation Infographics Infographics
This is a our graphs and charts ppt powerpoint presentation infographics infographics. This is a one stage process. The stages in this process are business, strategy, analysis, pretention, chart and graph.
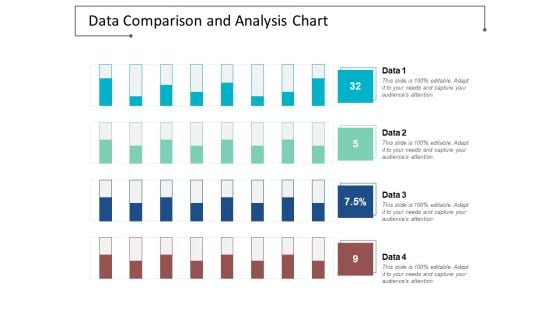
Data Comparison And Analysis Chart Ppt Powerpoint Presentation File Background Images
This is a data comparison and analysis chart ppt powerpoint presentation file background images. This is a four stage process. The stages in this process are data presentation, content presentation, information presentation.

Bar Chart With Magnifying Glass For Financial Analysis Ppt Powerpoint Presentation Infographics Designs Download
This is a bar chart with magnifying glass for financial analysis ppt powerpoint presentation infographics designs download. This is a three stage process. The stages in this process are business metrics, business kpi, business dashboard.
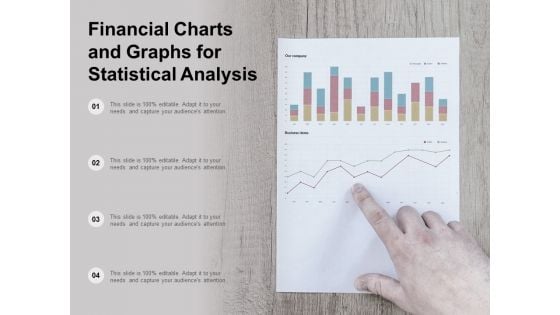
Financial Charts And Graphs For Statistical Analysis Ppt Powerpoint Presentation Show Layout
This is a financial charts and graphs for statistical analysis ppt powerpoint presentation show layout. This is a four stage process. The stages in this process are business metrics, business kpi, business dashboard.
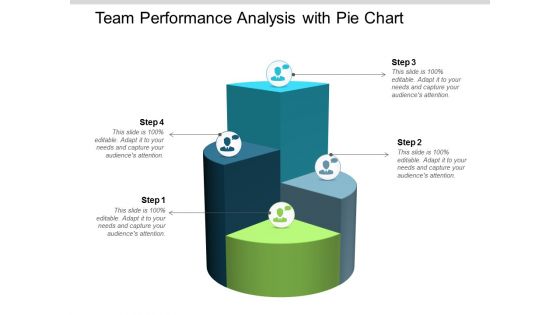
Team Performance Analysis With Pie Chart Ppt Powerpoint Presentation Infographic Template Slideshow
This is a team performance analysis with pie chart ppt powerpoint presentation infographic template slideshow. This is a four stage process. The stages in this process are team performance, member performance, group performance.
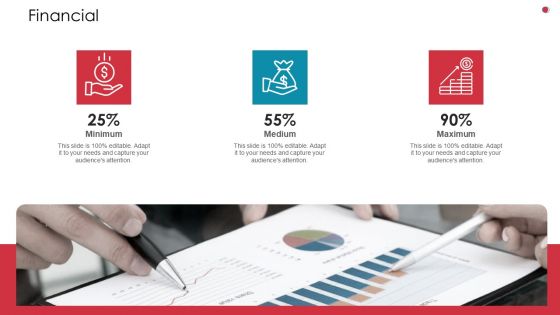
Financial Business Analysis Method Ppt Diagrams PDF
Presenting financial business analysis method ppt diagrams pdf to provide visual cues and insights. Share and navigate important information on three stages that need your due attention. This template can be used to pitch topics like maximum, medium, minimum. In addtion, this PPT design contains high resolution images, graphics, etc, that are easily editable and available for immediate download.
Cost Analysis Ppt PowerPoint Presentation Summary Icons
This is a cost analysis ppt powerpoint presentation summary icons. This is a three stage process. The stages in this process are marketing and launch cost analysis, business and financial analysis, cost analysis.
Our Goal Ppt PowerPoint Presentation Diagrams
This is a our goal ppt powerpoint presentation diagrams. This is a six stage process. The stages in this process are business, strategy, marketing, target, icons, process.
Requirement Analysis Of Gap Vector Icon Ppt File Rules PDF
Presenting requirement analysis of gap vector icon ppt file rules pdf. to dispense important information. This template comprises three stages. It also presents valuable insights into the topics including requirement analysis of gap vector icon. This is a completely customizable PowerPoint theme that can be put to use immediately. So, download it and address the topic impactfully.

About Us Ppt PowerPoint Presentation Layouts Themes
This is a about us ppt powerpoint presentation layouts themes. This is a four stage process. The stages in this process are marry smith, john smith, anita smith, jess smith.
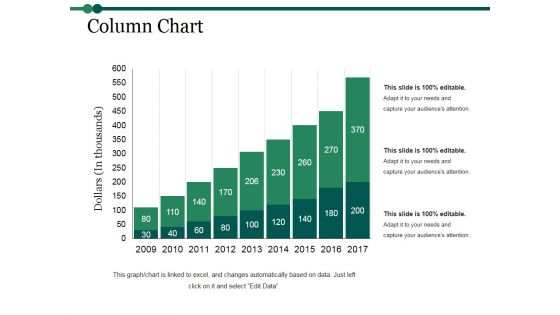
Column Chart Ppt PowerPoint Presentation Inspiration Graphics Example
This is a column chart ppt powerpoint presentation inspiration graphics example. This is a nine stage process. The stages in this process are column chart, finance, marketing, strategy, analysis, business.
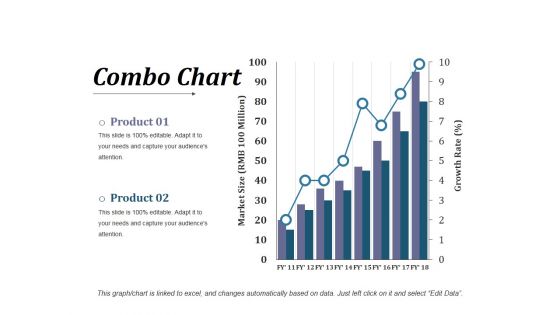
Combo Chart Ppt PowerPoint Presentation Infographic Template Visuals
This is a combo chart ppt powerpoint presentation infographic template visuals. This is a three stage process. The stages in this process are business, finance, strategy, analysis, combo chart.
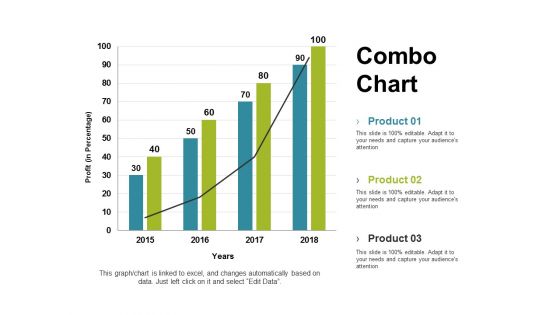
Combo Chart Ppt PowerPoint Presentation Gallery Graphics Tutorials
This is a Combo Chart Ppt PowerPoint Presentation Gallery Graphics Tutorials. This is a three stage process. The stages in this process are combo chart, finance, marketing, strategy, analysis.
Project Cost Control Techniques Icon Download PDF
Persuade your audience using this project cost control techniques icon download pdf. This PPT design covers three stages, thus making it a great tool to use. It also caters to a variety of topics including project cost control techniques icon. Download this PPT design now to present a convincing pitch that not only emphasizes the topic but also showcases your presentation skills.
Stakeholder Efficient Communication Technique Icon Guidelines PDF
Persuade your audience using this Stakeholder Efficient Communication Technique Icon Guidelines PDF. This PPT design covers four stages, thus making it a great tool to use. It also caters to a variety of topics including Stakeholder Efficient, Communication Technique Icon. Download this PPT design now to present a convincing pitch that not only emphasizes the topic but also showcases your presentation skills.
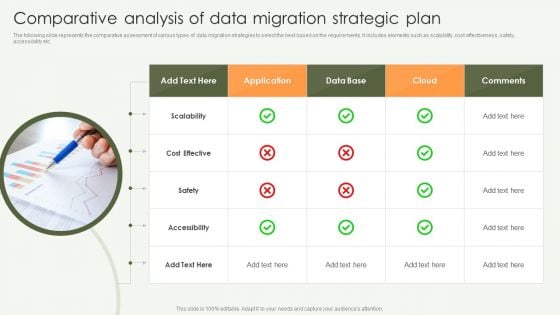
Comparative Analysis Of Data Migration Strategic Plan Diagrams PDF
The following slide represents the comparative assessment of various types of data migration strategies to select the best based on the requirements. It includes elements such as scalability, cost effectiveness, safety, accessibility etc. Presenting Comparative Analysis Of Data Migration Strategic Plan Diagrams PDF to dispense important information. This template comprises one stages. It also presents valuable insights into the topics including Cost Effective, Application, Cloud. This is a completely customizable PowerPoint theme that can be put to use immediately. So, download it and address the topic impactfully.
Team Work Analysis Dashboard Ppt Icon
This is a team work analysis dashboard ppt icon. This is a four stage process. The stages in this process are reward, completion, overdue plans, problems.
Internal Analysis Ppt PowerPoint Presentation Icon Outline
This is a internal analysis ppt powerpoint presentation icon outline. This is a four stage process. The stages in this process are finance, graph, business, marketing.
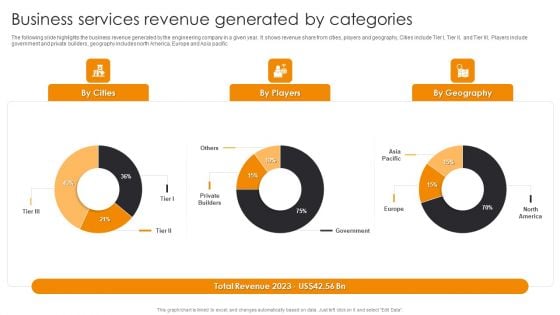
Business Services Revenue Generated By Categories Engineering Company Financial Analysis Report Graphics PDF
The following slide highlights the business revenue generated by the engineering company in a given year. It shows revenue share from cities, players and geography, Cities include Tier I, Tier II, and Tier III, Players include government and private builders, geography includes north America, Europe and Asia pacific.If you are looking for a format to display your unique thoughts, then the professionally designed Business Services Revenue Generated By Categories Engineering Company Financial Analysis Report Graphics PDF is the one for you. You can use it as a Google Slides template or a PowerPoint template. Incorporate impressive visuals, symbols, images, and other charts. Modify or reorganize the text boxes as you desire. Experiment with shade schemes and font pairings. Alter, share or cooperate with other people on your work. Download Business Services Revenue Generated By Categories Engineering Company Financial Analysis Report Graphics PDF and find out how to give a successful presentation. Present a perfect display to your team and make your presentation unforgettable.
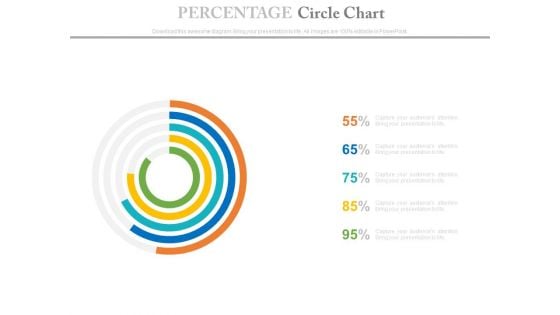
Percentage Data Circle Chart Powerpoint Slides
This PowerPoint template has been designed with circle chart. Download this PPT chart to depict financial ratio analysis. This PowerPoint slide is of great help in the business sector to make realistic presentations and provides effective way of presenting your newer thoughts.
Environmental Analysis For Strategy Formulation And Implementation Ppt PowerPoint Presentation Inspiration Icons
This is a environmental analysis for strategy formulation and implementation ppt powerpoint presentation inspiration icons. This is a three stage process. The stages in this process are environmental scan, environmental study, environmental examine.

Donut Pie Chart Ppt PowerPoint Presentation Infographics Outfit
This is a donut pie chart ppt powerpoint presentation infographics outfit. This is a three stage process. The stages in this process are business, strategy, analysis, planning, dashboard, finance.
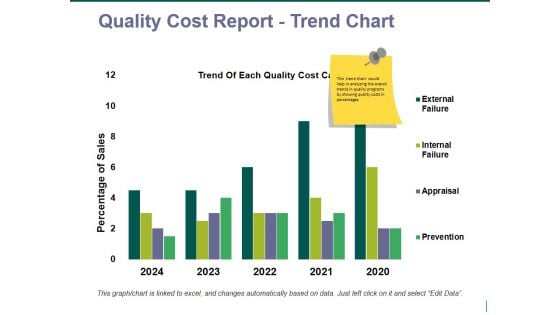
quality cost report trend chart ppt powerpoint presentation pictures vector
This is a quality cost report trend chart ppt powerpoint presentation pictures vector. This is a four stage process. The stages in this process are business, finance, marketing, strategy, analysis.

Product Launch Strategy Report Diagram Ppt Sample
This is a product launch strategy report diagram ppt sample. This is a nine stage process. The stages in this process are target, consumer pulse, days, launch note, challenges, refine, goals, payment option, sales.
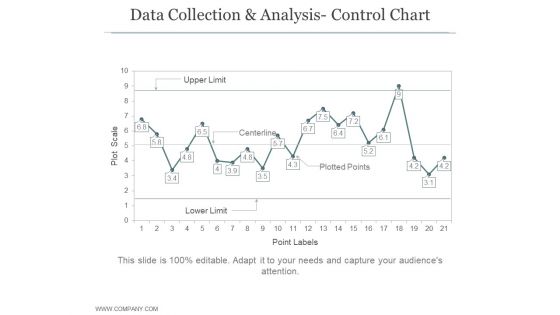
Data Collection And Analysis Control Chart Ppt PowerPoint Presentation Example File
This is a data collection and analysis control chart ppt powerpoint presentation example file. This is a four stage process. The stages in this process are business, strategy, marketing, bar graph, growth strategy.

Bar Diagram Ppt PowerPoint Presentation Show Maker
This is a bar diagram ppt powerpoint presentation show maker. This is a seven stage process. The stages in this process are bar graph, finance, marketing, strategy, business.
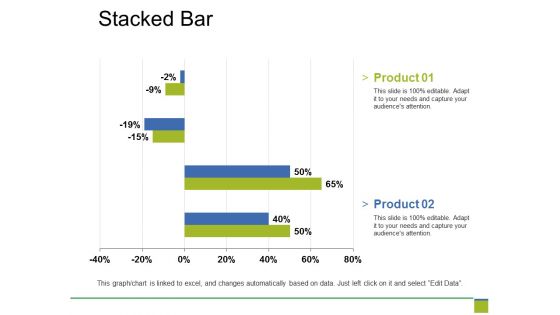
Stacked Bar Ppt PowerPoint Presentation Summary Diagrams
This is a stacked bar ppt powerpoint presentation summary diagrams. This is a four stage process. The stages in this process are business, marketing, strategy, planning, finance.
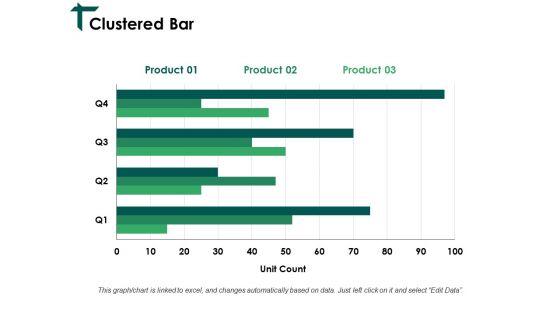
Clustered Bar Ppt PowerPoint Presentation Diagram Templates
This is a clustered bar ppt powerpoint presentation diagram templates. This is a three stage process. The stages in this process are business, marketing, unit count, finance, strategy.
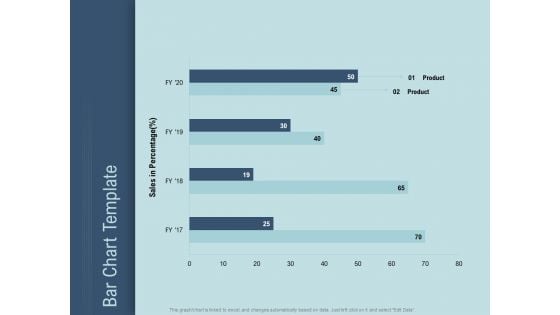
Determine Right Pricing Strategy New Product Bar Chart Template Ppt Portfolio Format PDF
Presenting this set of slides with name determine right pricing strategy new product bar chart template ppt portfolio format pdf. The topics discussed in these slides are product 1, product 2. This is a completely editable PowerPoint presentation and is available for immediate download. Download now and impress your audience.
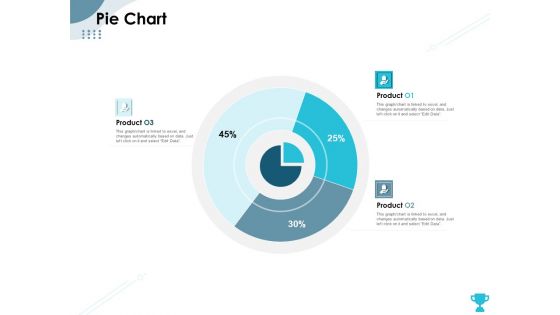
Strategies Take Your Retail Business Ahead Competition Pie Chart Portrait PDF
Presenting this set of slides with name strategies take your retail business ahead competition pie chart portrait pdf. The topics discussed in these slides are product 1, product 2, product 3. This is a completely editable PowerPoint presentation and is available for immediate download. Download now and impress your audience.
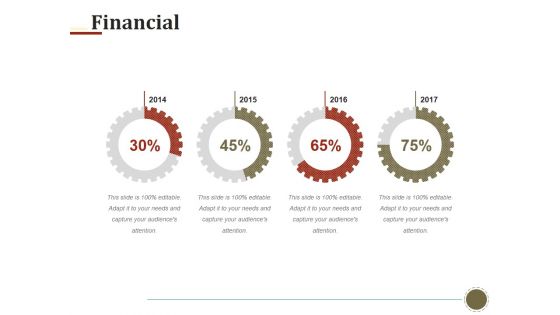
Financial Ppt PowerPoint Presentation Summary Themes
This is a financial ppt powerpoint presentation summary themes. This is a four stage process. The stages in this process are business, finance, marketing, analysis, gears, strategy.
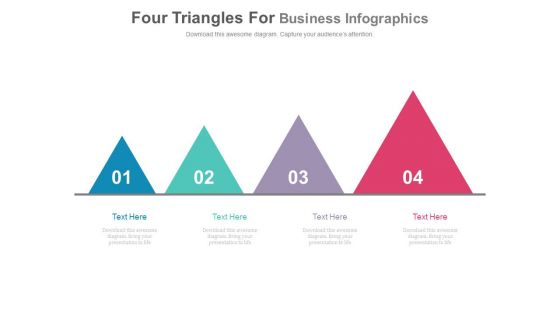
Four Triangles In Progressive Order Powerpoint Slides
The multicolored triangles in this slide can be used for various purposes. The differently sized triangles can be used by a company or an organization to present their growth over the years. The triangles can also be used to portray a comparison between different products or services being offered by a business and the increasing size can portray the added advantages of opting for the next package. The numbers inside the triangles can be used to demonstrate progressive steps involved in a process or a procedure. It can also be used to depict ways to get closer or to achieve a target. The triangles can effectively represent the departments as per their workload or importance.
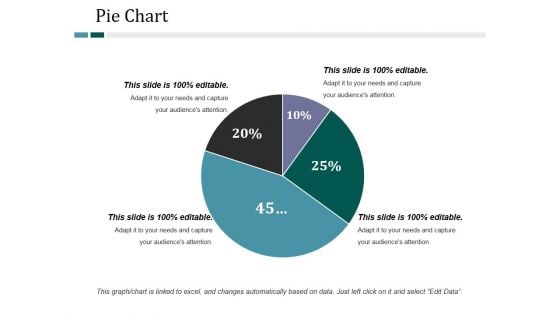
Pie Chart Ppt PowerPoint Presentation Ideas Microsoft
This is a pie chart ppt powerpoint presentation ideas microsoft. This is a four stage process. The stages in this process are pie chart, finance, marketing, strategy, business.
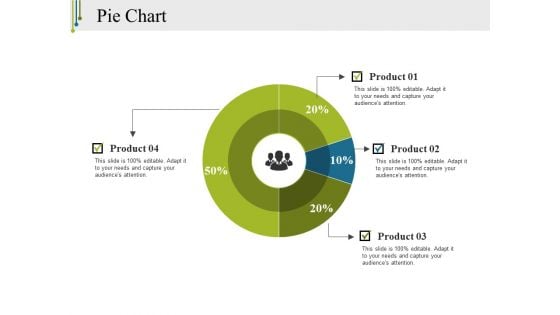
Pie Chart Ppt PowerPoint Presentation Infographics Clipart
This is a pie chart ppt powerpoint presentation infographics clipart. This is a four stage process. The stages in this process are pie chart, finance, marketing, strategy, business.
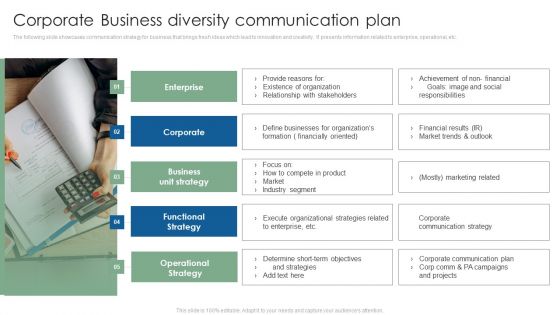
Corporate Business Diversity Communication Plan Themes PDF
The following slide showcases communication strategy for business that brings fresh ideas which lead to innovation and creativity. It presents information related to enterprise, operational, etc. Presenting Corporate Business Diversity Communication Plan Themes PDF to dispense important information. This template comprises five stages. It also presents valuable insights into the topics including Enterprise, Business Unit Strategy, Operational Strategy. This is a completely customizable PowerPoint theme that can be put to use immediately. So, download it and address the topic impactfully.
Email Marketing Techniques Icon For Customer Relationship Management Ppt PowerPoint Presentation File Grid PDF
Presenting email marketing techniques icon for customer relationship management ppt powerpoint presentation file grid pdf to dispense important information. This template comprises three stages. It also presents valuable insights into the topics including email marketing techniques icon for customer relationship management. This is a completely customizable PowerPoint theme that can be put to use immediately. So, download it and address the topic impactfully.
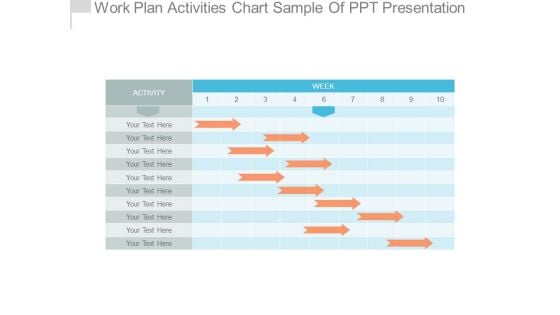
Work Plan Activities Chart Sample Of Ppt Presentation
This is a work plan activities chart sample of ppt presentation. This is a ten stage process. The stages in this process are table, management, business, strategy, presentation.


 Continue with Email

 Home
Home


