Value And Benefit
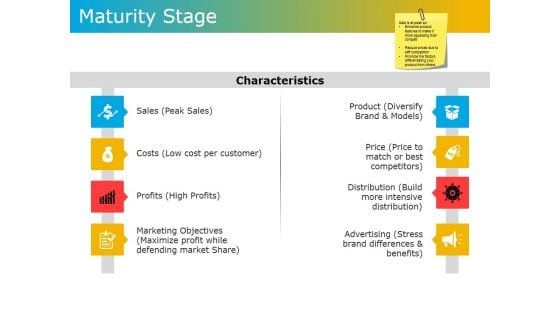
Maturity Stage Ppt PowerPoint Presentation Gallery Inspiration
This is a maturity stage ppt powerpoint presentation gallery inspiration. This is a eight stage process. The stages in this process are sales, costs, profits, marketing objectives, product, price.
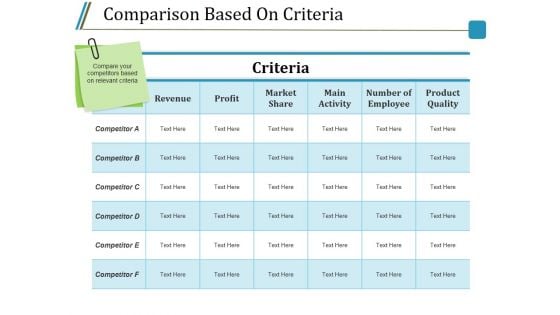
Comparison Based On Criteria Ppt PowerPoint Presentation Outline Pictures
This is a comparison based on criteria ppt powerpoint presentation outline pictures. This is a six stage process. The stages in this process are revenue, profit, market share, main activity, number of employee.
Comparison Based On Criteria Ppt PowerPoint Presentation Show Icon
This is a comparison based on criteria ppt powerpoint presentation show icon. This is a six stage process. The stages in this process are revenue, profit, market share, main activity, number of employee.
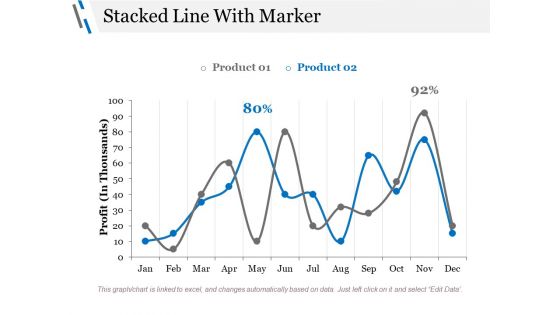
Stacked Line With Marker Ppt PowerPoint Presentation Styles Graphics Design
This is a stacked line with marker ppt powerpoint presentation styles graphics design. This is a three stage process. The stages in this process are profit, business, marketing, finance, percentage.
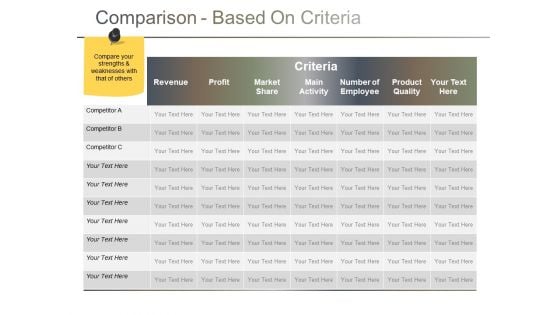
Comparison Based On Criteria Ppt PowerPoint Presentation Gallery Themes
This is a comparison based on criteria ppt powerpoint presentation gallery themes. This is a seven stage process. The stages in this process are revenue, profit, market share, main activity, product quality.

Comparison Based On Criteria Ppt PowerPoint Presentation Gallery Sample
This is a comparison based on criteria ppt powerpoint presentation gallery sample. This is a six stage process. The stages in this process are revenue, profit, market share, main activity, number of employee.

Area Chart Ppt PowerPoint Presentation Infographic Template Layout
This is a area chart ppt powerpoint presentation infographic template layout. This is a two stage process. The stages in this process are product, profit, area chart, growth, success.
Comparison Based On Criteria Ppt PowerPoint Presentation Icon Example Introduction
This is a comparison based on criteria ppt powerpoint presentation icon example introduction. This is a six stage process. The stages in this process are criteria, revenue, profit, market share, main activity.
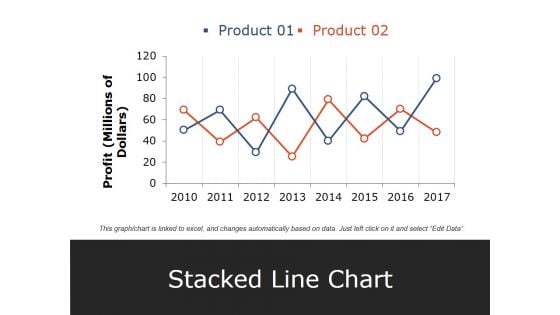
Stacked Line Chart Ppt PowerPoint Presentation Pictures Elements
This is a stacked line chart ppt powerpoint presentation pictures elements. This is a two stage process. The stages in this process are product, profit, stacked line chart, year, business.
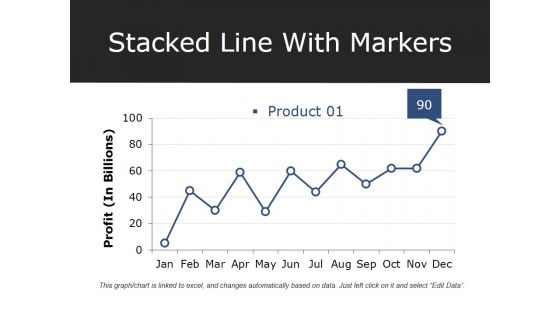
Stacked Line With Markers Ppt PowerPoint Presentation Professional Deck
This is a stacked line with markers ppt powerpoint presentation professional deck. This is a one stage process. The stages in this process are product, profit, growth, success, graph.

Comparison Based On Criteria Ppt PowerPoint Presentation Show File Formats
This is a comparison based on criteria ppt powerpoint presentation show file formats. This is a six stage process. The stages in this process are revenue, profit, market share, main activity, number of employee.
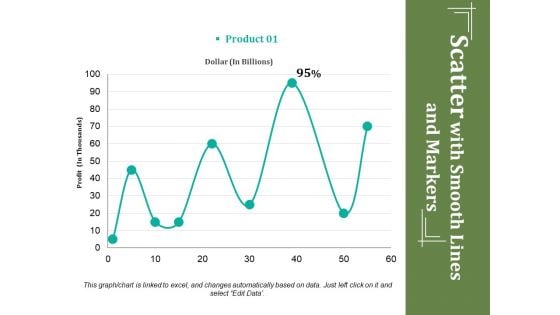
Scatter With Smooth Lines And Markers Ppt PowerPoint Presentation Ideas Deck
This is a scatter with smooth lines and markers ppt powerpoint presentation ideas deck. This is a one stage process. The stages in this process are profit, dollar, percentage, business, growth.
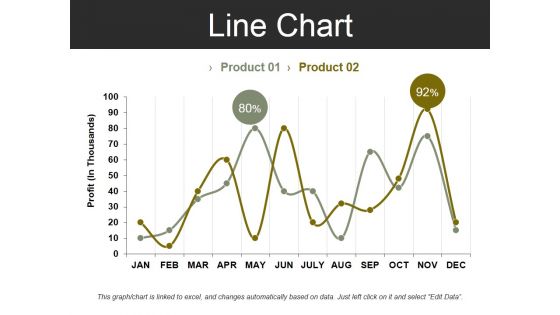
Line Chart Template 2 Ppt PowerPoint Presentation Summary Design Inspiration
This is a line chart template 2 ppt powerpoint presentation summary design inspiration. This is a two stage process. The stages in this process are profit, business, marketing, finance, chart.
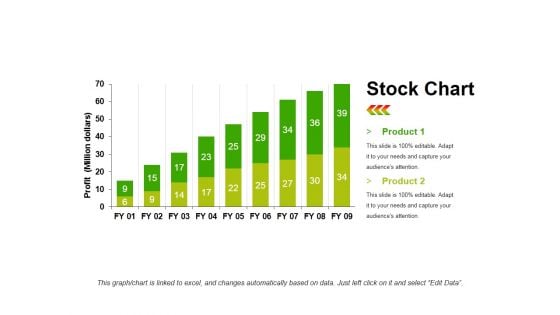
Stock Chart Template 1 Ppt PowerPoint Presentation Infographic Template Objects
This is a stock chart template 1 ppt powerpoint presentation infographic template objects. This is a two stage process. The stages in this process are product, profit, bar graph, growth, success.
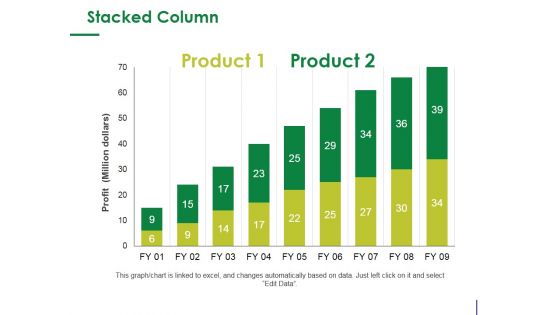
Stacked Column Ppt PowerPoint Presentation Infographic Template Design Ideas
This is a stacked column ppt powerpoint presentation infographic template design ideas. This is a two stage process. The stages in this process are product, profit, bar graph, growth, success.
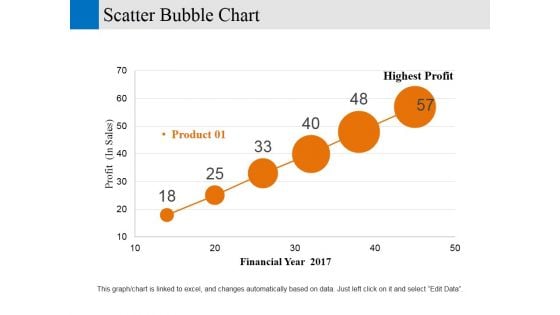
Scatter Bubble Chart Ppt PowerPoint Presentation Gallery Designs Download
This is a scatter bubble chart ppt powerpoint presentation gallery designs download. This is a six stage process. The stages in this process are financial year, profit, business, marketing, strategy.
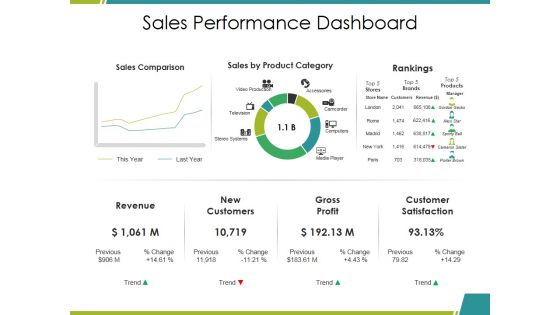
Sales Performance Dashboard Ppt PowerPoint Presentation Infographics Mockup
This is a sales performance dashboard ppt powerpoint presentation infographics mockup. This is a three stage process. The stages in this process are sales comparison, sales by product category, rankings, revenue, gross profit.
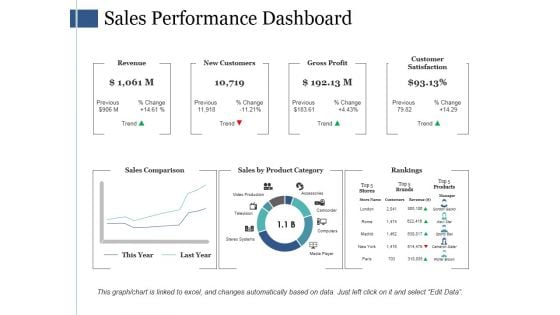
Sales Performance Dashboard Ppt PowerPoint Presentation Ideas Portfolio
This is a sales performance dashboard ppt powerpoint presentation ideas portfolio. This is a three stage process. The stages in this process are revenue, new customers, gross profit, customer satisfaction, sales comparison.
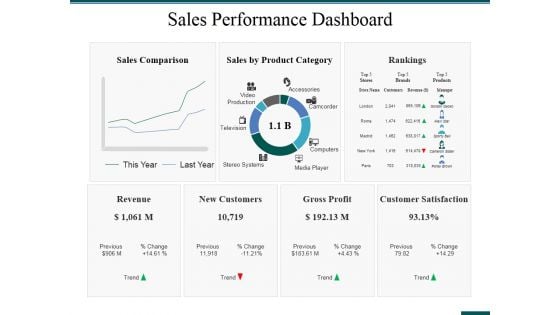
Sales Performance Dashboard Ppt PowerPoint Presentation Ideas Format Ideas
This is a sales performance dashboard ppt powerpoint presentation ideas format ideas. This is a three stage process. The stages in this process are rankings, revenue, new customers, gross profit, customer satisfaction.
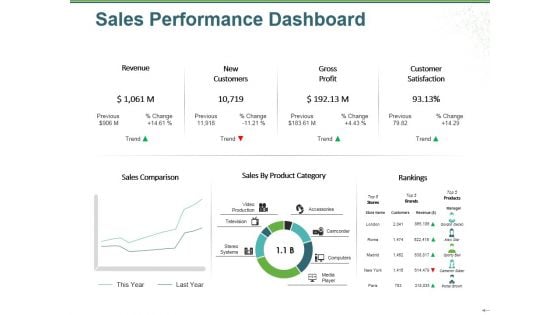
Sales Performance Dashboard Ppt PowerPoint Presentation Outline File Formats
This is a sales performance dashboard ppt powerpoint presentation outline file formats. This is a three stage process. The stages in this process are revenue, new customers, gross profit, customer satisfaction, rankings.
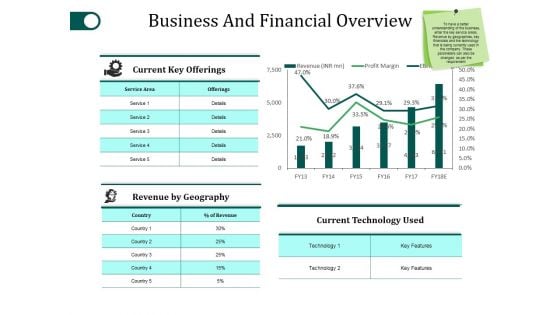
Business And Financial Overview Ppt PowerPoint Presentation Inspiration Clipart Images
This is a business and financial overview ppt powerpoint presentation inspiration clipart images. This is a four stage process. The stages in this process are current key offerings, revenue by geography, current technology used, profit margin, revenue.
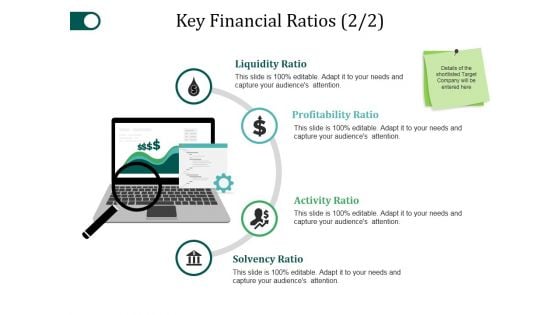
Key Financial Ratios Template 2 Ppt PowerPoint Presentation Professional Template
This is a key financial ratios template 2 ppt powerpoint presentation professional template. This is a four stage process. The stages in this process are liquidity ratio, profitability ratio, activity ratio, solvency ratio.
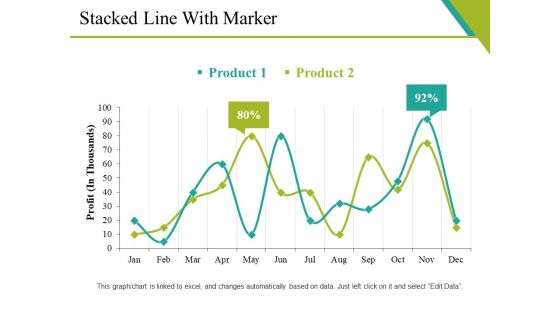
Stacked Line With Marker Ppt PowerPoint Presentation Gallery Diagrams
This is a stacked line with marker ppt powerpoint presentation gallery diagrams. This is a two stage process. The stages in this process are graph, business, marketing, strategy, profit.
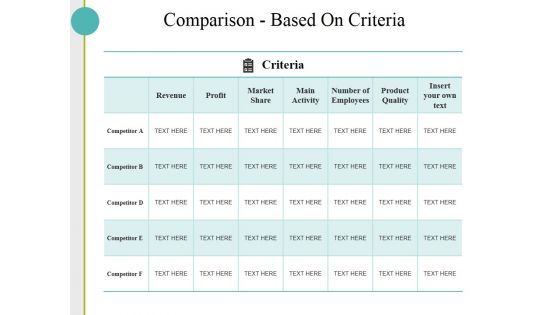
Comparison Based On Criteria Ppt PowerPoint Presentation Slides Skills
This is a comparison based on criteria ppt powerpoint presentation slides skills. This is a five stage process. The stages in this process are revenue, profit, market share, main activity, number of employees, product quality.
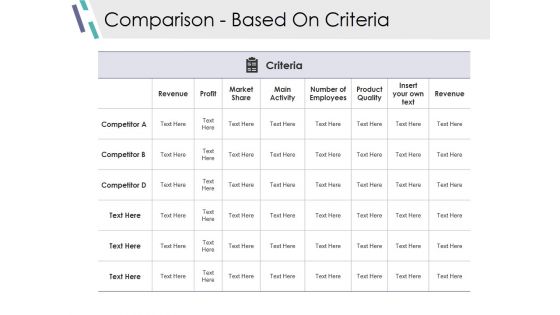
Comparison Based On Criteria Ppt PowerPoint Presentation Show Outline
This is a comparison based on criteria ppt powerpoint presentation show outline. This is a six stage process. The stages in this process are revenue, profit, market share, main activity, number of employees.

Comparison Based On Criteria Ppt PowerPoint Presentation Show Graphics Pictures
This is a comparison based on criteria ppt powerpoint presentation show graphics pictures. This is a seven stage process. The stages in this process are competitor, revenue, profit, market share, main activity.
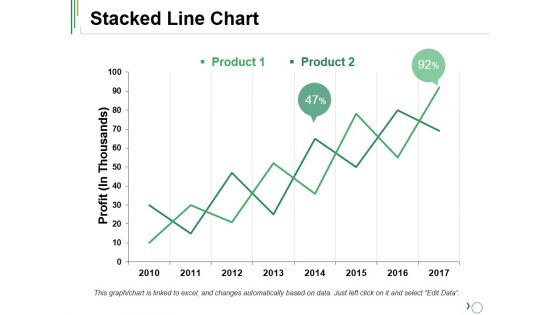
Stacked Line Chart Ppt PowerPoint Presentation Ideas Outfit
This is a stacked line chart ppt powerpoint presentation ideas outfit. This is a two stage process. The stages in this process are product, stacked line, profit, growth, success.
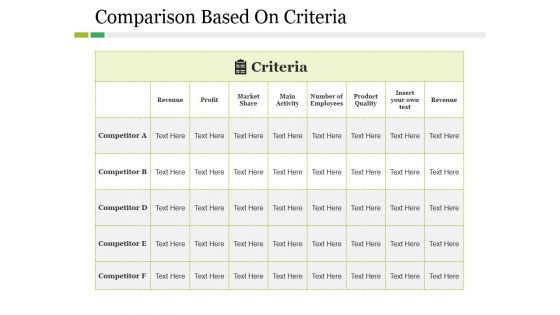
Comparison Based On Criteria Ppt PowerPoint Presentation Styles Picture
This is a comparison based on criteria ppt powerpoint presentation styles picture. This is a five stage process. The stages in this process are competitor, revenue, profit, criteria, market share.
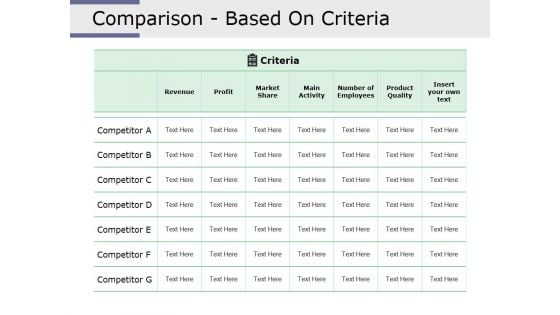
Comparison Based On Criteria Ppt PowerPoint Presentation Infographic Template Layout Ideas
This is a comparison based on criteria ppt powerpoint presentation infographic template layout ideas. This is a seven stage process. The stages in this process are revenue, profit, market share, main activity, number of employees, product quality.
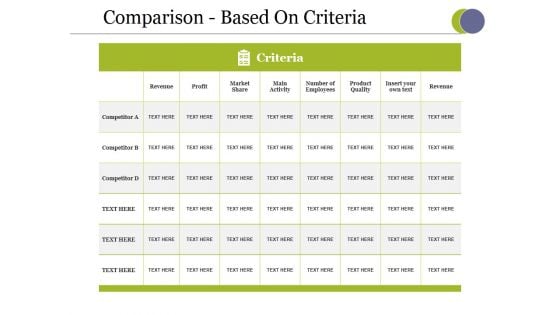
Comparison Based On Criteria Ppt PowerPoint Presentation Styles Designs
This is a comparison based on criteria ppt powerpoint presentation styles designs. This is a three stage process. The stages in this process are revenue, profit, market share, main activity, number of employees, product quality.
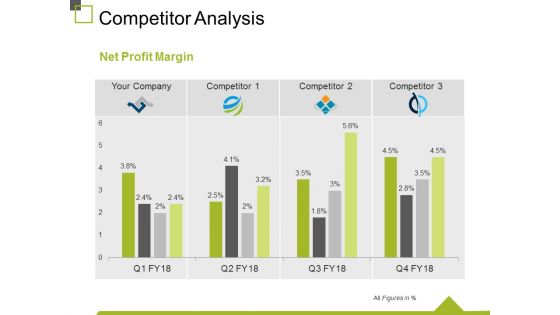
Competitor Analysis Template 4 Ppt PowerPoint Presentation Gallery Design Templates
This is a competitor analysis template 4 ppt powerpoint presentation gallery design templates. This is a four stage process. The stages in this process are business, marketing, analysis, graph, net profit margin.
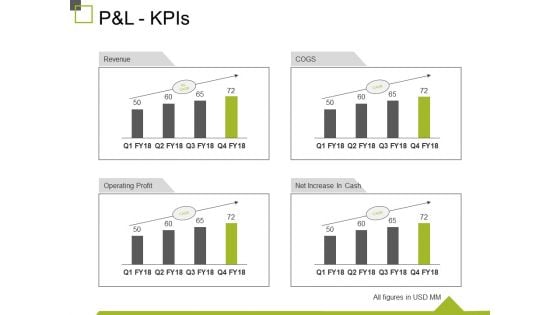
P And L Kpis Ppt PowerPoint Presentation Show Design Inspiration
This is a p and l kpis ppt powerpoint presentation show design inspiration. This is a four stage process. The stages in this process are revenue, operating profit, cogs, net increase in cash, business.

Risk Management Plan Ppt PowerPoint Presentation Complete Deck With Slides
This is a risk management plan ppt powerpoint presentation complete deck with slides. This is a one stage process. The stages in this process are risk, management, plan, profit, loss.
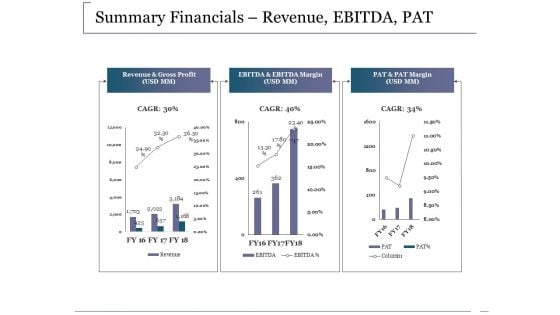
Summary Financials Revenue Ebitda Pat Ppt PowerPoint Presentation Outline Infographics
This is a summary financials revenue ebitda pat ppt powerpoint presentation outline infographics. This is a three stage process. The stages in this process are revenue and gross profit, ebitda and ebitda margin, pat and pat margin, business, marketing.
Financial Summary Ppt PowerPoint Presentation Icon Pictures
This is a financial summary ppt powerpoint presentation icon pictures. This is a seven stage process. The stages in this process are net sales, expenses, ebitda, profit after tax.
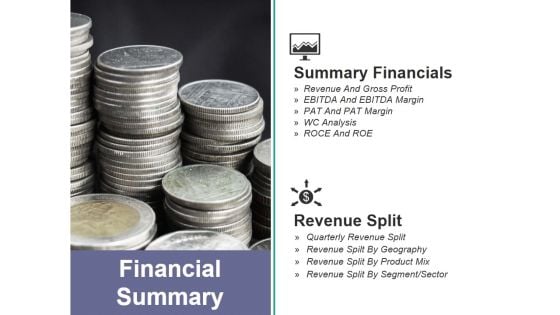
Financial Summary Ppt PowerPoint Presentation Infographic Template Design Inspiration
This is a financial summary ppt powerpoint presentation infographic template design inspiration. This is a two stage process. The stages in this process are summary financials, revenue split, financial summary, revenue and gross profit, wc analysis.
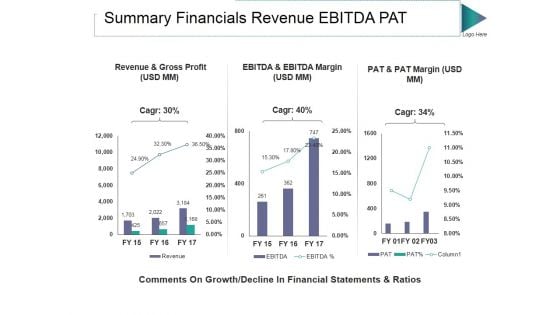
Summary Financials Revenue Ebitda Pat Ppt PowerPoint Presentation Visuals
This is a summary financials revenue ebitda pat ppt powerpoint presentation visuals. This is a three stage process. The stages in this process are revenue and gross profit, pat and pat margin, ebitda and ebitda margin.
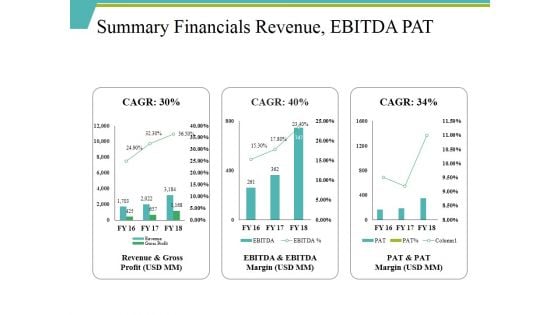
Summary Financials Revenue Ebitda Pat Ppt PowerPoint Presentation Infographic Template Smartart
This is a summary financials revenue ebitda pat ppt powerpoint presentation infographic template smartart. This is a three stage process. The stages in this process are revenue and gross profit, ebitda and ebitda, pat and pat, revenue.
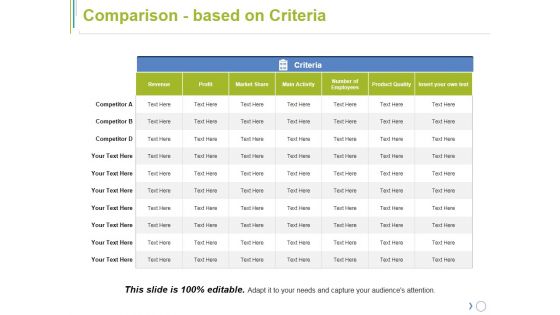
Comparison Based On Criteria Ppt PowerPoint Presentation Model Inspiration
This is a comparison based on criteria ppt powerpoint presentation model inspiration. This is a seven stage process. The stages in this process are revenue, profit, market share, number of employees, product quality.
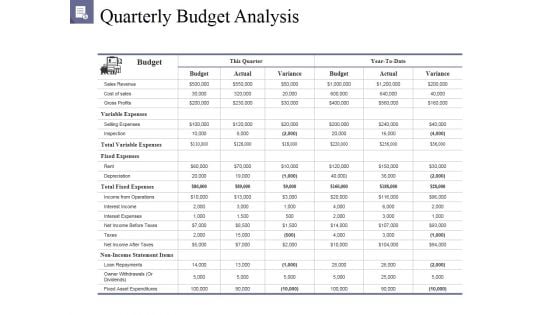
Quarterly Budget Analysis Ppt PowerPoint Presentation Outline Background Image
This is a quarterly budget analysis ppt powerpoint presentation outline background image. This is a two stage process. The stages in this process are budget, this quarter, sales revenue, cost of sales, gross profits.
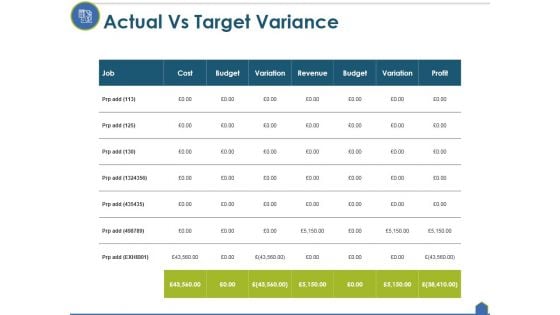
Actual Vs Target Variance Ppt PowerPoint Presentation Professional Clipart Images
This is a actual vs target variance ppt powerpoint presentation professional clipart images. This is a seven stage process. The stages in this process are cost, budget, variation, revenue, profit.
Comparison Based On Criteria Ppt PowerPoint Presentation Model Layouts
This is a comparison based on criteria ppt powerpoint presentation model layouts. This is a seven stage process. The stages in this process are revenue, profit, market share, main activity, product quality.
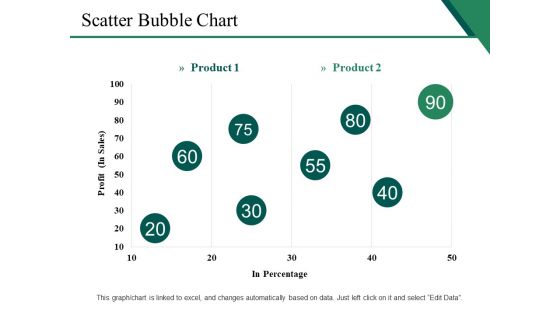
Scatter Bubble Chart Ppt PowerPoint Presentation Gallery Show
This is a scatter bubble chart ppt powerpoint presentation gallery show. This is a two stage process. The stages in this process are profit, in percentage, finance, marketing, business.
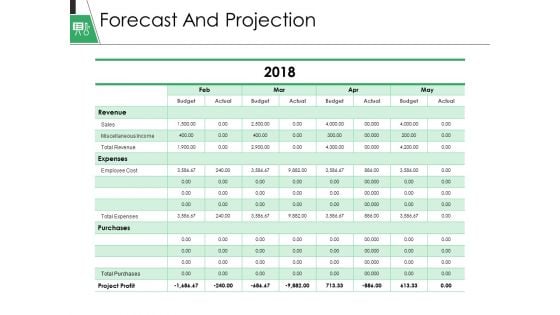
Forecast And Projection Ppt PowerPoint Presentation Gallery Display
This is a forecast and projection ppt powerpoint presentation gallery display. This is a four stage process. The stages in this process are revenue, expenses, purchases, project profit, budget.
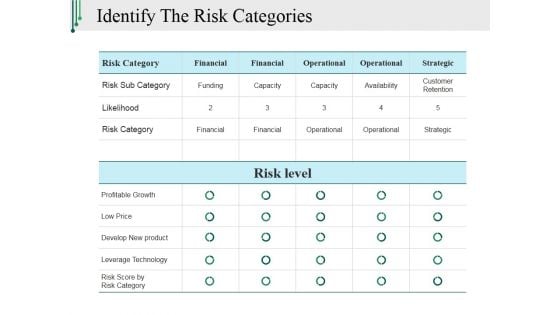
Identify The Risk Categories Ppt PowerPoint Presentation Model Topics
This is a identify the risk categories ppt powerpoint presentation model topics. This is a two stage process. The stages in this process are risk category, financial, funding, profitable growth, risk level.
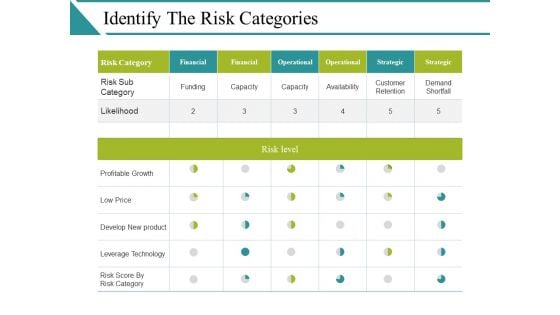
Identify The Risk Categories Ppt PowerPoint Presentation Model Vector
This is a identify the risk categories ppt powerpoint presentation model vector. This is a seven stage process. The stages in this process are risk sub category, likelihood, profitable growth, low price, develop new product.

Key Financial Ratios Template 2 Ppt PowerPoint Presentation Slides Ideas
This is a key financial ratios template 2 ppt powerpoint presentation slides ideas. This is a one stage process. The stages in this process are liquidity, profitability, activity, solvency.
Key Financial Ratios Template 2 Ppt PowerPoint Presentation Icon Background
This is a key financial ratios template 2 ppt powerpoint presentation icon background. This is a four stage process. The stages in this process are liquidity, profitability, activity, solvency.
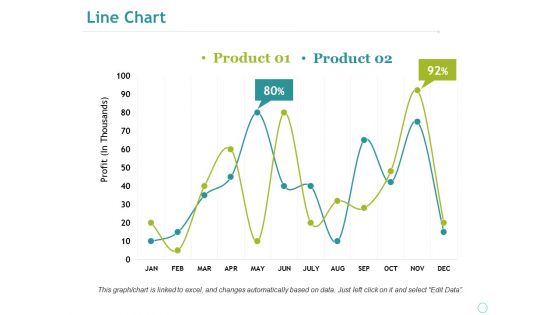
Line Chart Ppt PowerPoint Presentation Professional Portfolio
This is a line chart ppt powerpoint presentation professional portfolio. This is a two stage process. The stages in this process are business, marketing, profit, percentage, graph, strategy, finance.
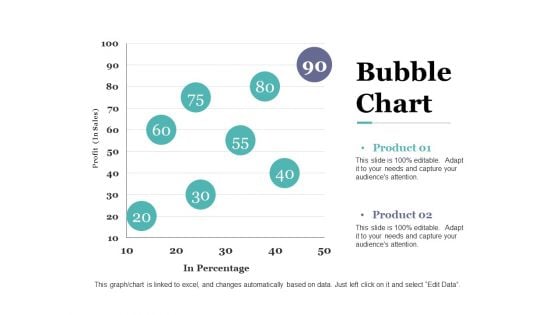
Bubble Chart Ppt PowerPoint Presentation Outline Deck
This is a bubble chart ppt powerpoint presentation outline deck. This is a two stage process. The stages in this process are in percentage, profit, bubble chart, business, marketing.
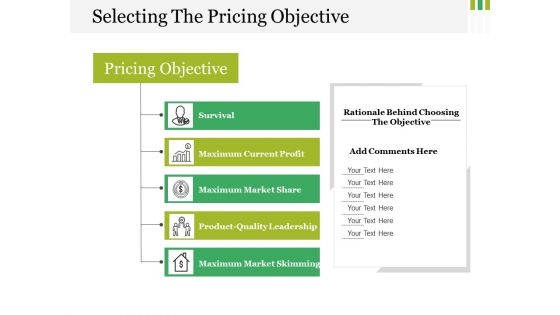
Selecting The Pricing Objective Ppt PowerPoint Presentation Portfolio Design Ideas
This is a selecting the pricing objective ppt powerpoint presentation portfolio design ideas. This is a five stage process. The stages in this process are survival, maximum current profit, maximum market share, product quality leadership, maximum market skimming.
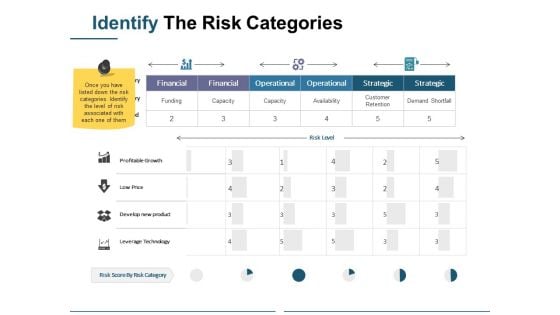
Identify The Risk Categories Ppt PowerPoint Presentation Professional Infographics
This is a identify the risk categories ppt powerpoint presentation professional infographics. This is a three stage process. The stages in this process are business, marketing, financial, operational, strategic, profitable growth.
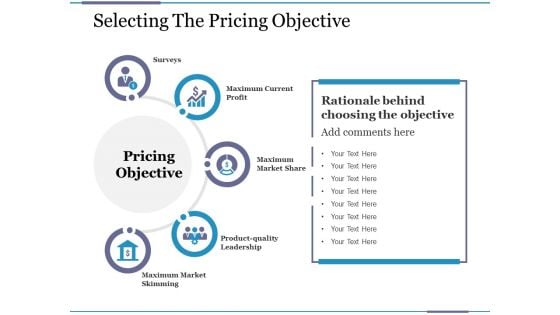
Selecting The Pricing Objective Ppt PowerPoint Presentation Gallery Portrait
This is a selecting the pricing objective ppt powerpoint presentation gallery portrait. This is a five stage process. The stages in this process are surveys, maximum current profit, maximum market share, product quality leadership, maximum market skimming.
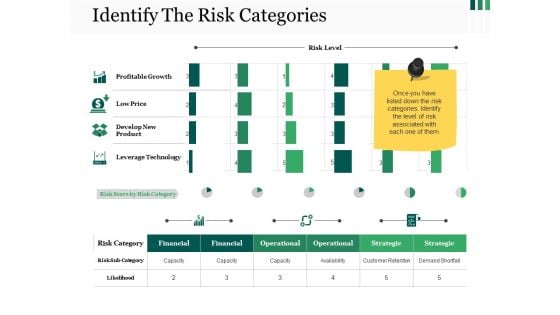
Identify The Risk Categories Ppt PowerPoint Presentation Styles Backgrounds
This is a identify the risk categories ppt powerpoint presentation styles backgrounds. This is a four stage process. The stages in this process are profitable growth, low price, develop new product, leverage technology.
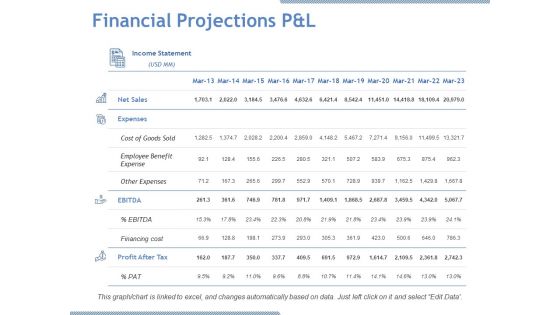
Financial Projections P And L Ppt PowerPoint Presentation Model Design Inspiration
This is a financial projections p and l ppt powerpoint presentation model design inspiration. This is a four stage process. The stages in this process are net sales, expenses, ebitda, profit after tax, cost of goods sold.

Key Financial Ratios Template 2 Ppt PowerPoint Presentation Outline Examples
This is a key financial ratios template 2 ppt powerpoint presentation outline examples. This is a four stage process. The stages in this process are liquidity, profitability, activity, solvency.
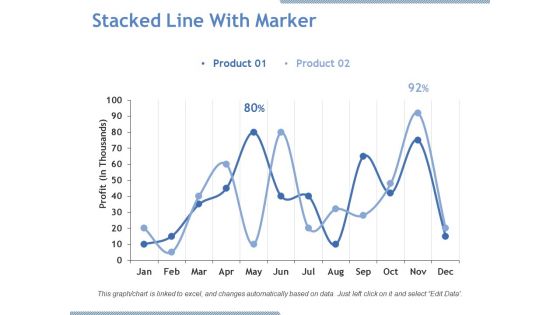
Stacked Line With Marker Ppt PowerPoint Presentation Pictures Graphics Download
This is a stacked line with marker ppt powerpoint presentation pictures graphics download. This is a two stage process. The stages in this process are product, profit, line chart, business, growth.
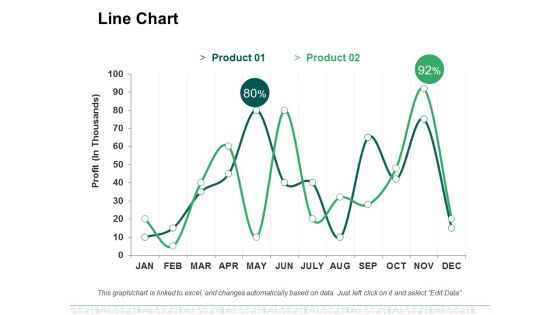
Line Chart Ppt PowerPoint Presentation File Designs Download
This is a line chart ppt powerpoint presentation file designs download. This is a two stage process. The stages in this process are business, marketing, profit, line chart, percentage.
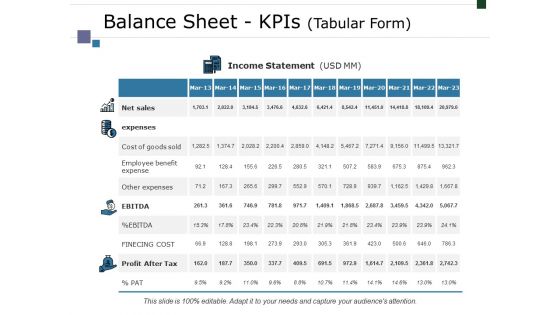
Balance Sheet Kpis Tabular Form Template 2 Ppt PowerPoint Presentation Summary Structure
This is a balance sheet kpis tabular form template 2 ppt powerpoint presentation summary structure. This is a four stage process. The stages in this process are net sales, expenses, ebitda, profit after tax, finecing cost.

Key Financial Ratios Template 2 Ppt PowerPoint Presentation Ideas Mockup
This is a key financial ratios template 2 ppt powerpoint presentation ideas mockup. This is a four stage process. The stages in this process are liquidity, profitability, activity, solvency, business.


 Continue with Email

 Home
Home


