Value And Benefit
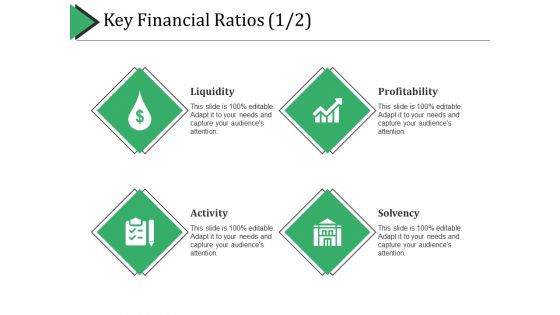
Key Financial Ratios Template 2 Ppt PowerPoint Presentation Summary Graphics Tutorials
This is a key financial ratios template 2 ppt powerpoint presentation summary graphics tutorials. This is a four stage process. The stages in this process are liquidity, profitability, activity, solvency.
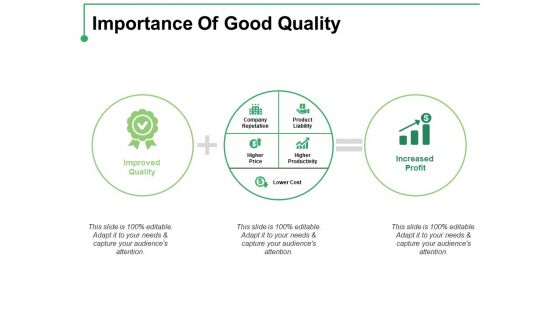
Importance Of Good Quality Ppt PowerPoint Presentation Styles Show
This is a importance of good quality ppt powerpoint presentation styles show. This is a three stage process. The stages in this process are product liability, increased profit, lower cost, higher price, improved quality.
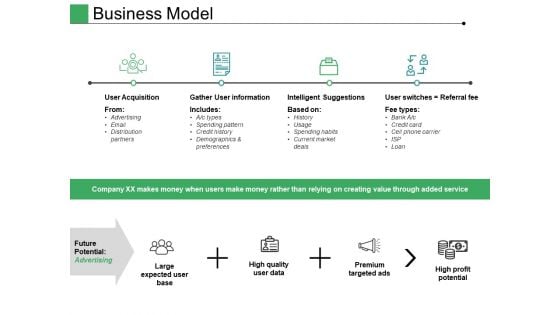
Business Model Ppt PowerPoint Presentation Portfolio File Formats
This is a business model ppt powerpoint presentation portfolio file formats. This is a four stage process. The stages in this process are future potential, high quality user data, premium targeted ads, high profit potential.
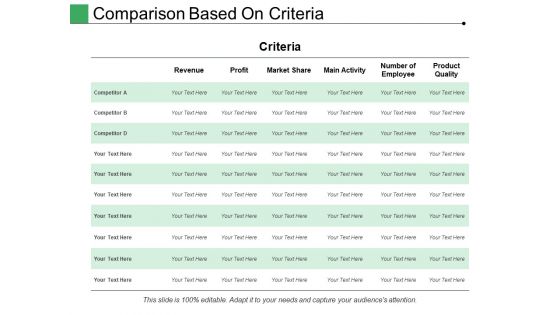
Comparison Based On Criteria Ppt PowerPoint Presentation Gallery Information
This is a comparison based on criteria ppt powerpoint presentation gallery information. This is a six stage process. The stages in this process are criteria, revenue, profit, business, competitor.
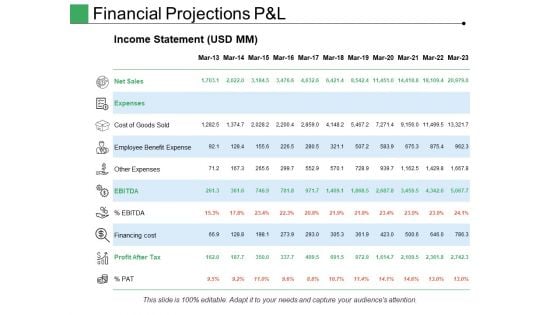
Financial Projections P And L Ppt PowerPoint Presentation Summary Backgrounds
This is a financial projections p and l ppt powerpoint presentation summary backgrounds. This is a four stage process. The stages in this process are net sales, expenses, other expenses, profit after tax, pat.
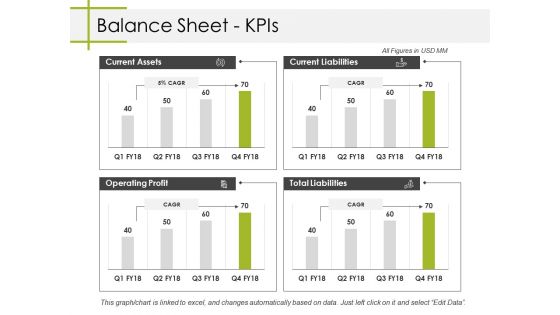
Balance Sheet Kpis Ppt PowerPoint Presentation Summary Designs Download
This is a balance sheet kpis ppt powerpoint presentation summary designs download. This is a four stage process. The stages in this process are current assets, current liabilities, total liabilities, operating profit, business.
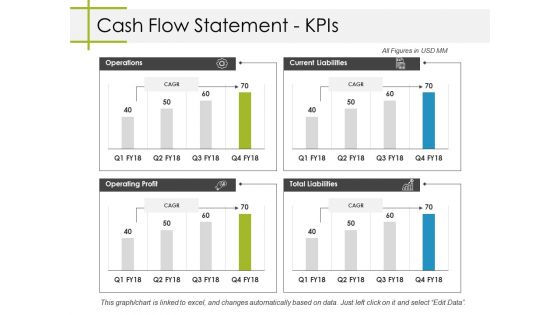
Cash Flow Statement Kpis Ppt PowerPoint Presentation Styles Themes
This is a cash flow statement kpis ppt powerpoint presentation styles themes. This is a four stage process. The stages in this process are business, operations, operating profit, total liabilities, current liabilities.
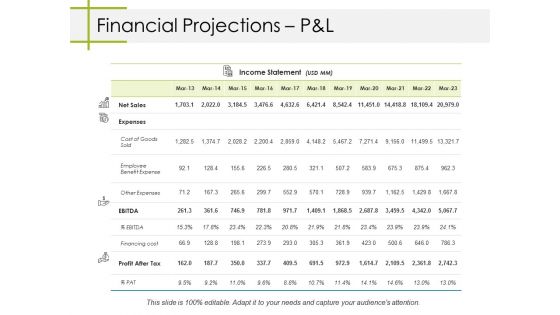
Financial Projections Pandl Ppt PowerPoint Presentation File Example File
This is a financial projections pandl ppt powerpoint presentation file example file. This is a four stage process. The stages in this process are net sales, expenses, ebitda, profit after tax, business.
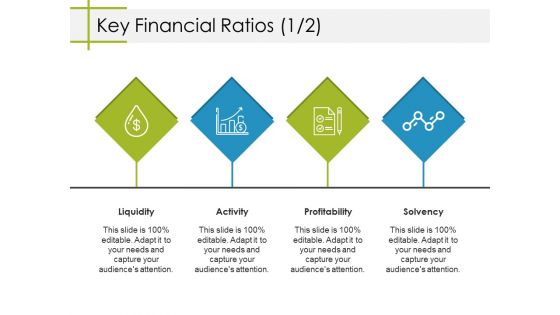
Key Financial Ratios Template 2 Ppt PowerPoint Presentation Summary Samples
This is a key financial ratios template 2 ppt powerpoint presentation summary samples. This is a four stage process. The stages in this process are liquidity, activity, profitability, solvency, business.
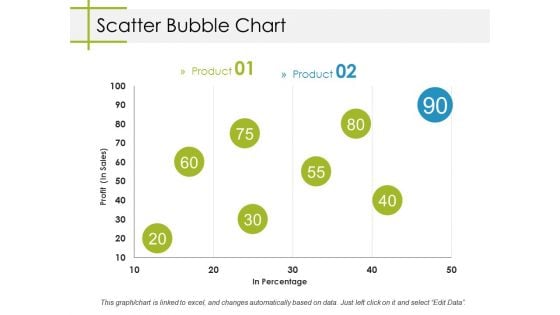
Scatter Bubble Chart Ppt PowerPoint Presentation Model Designs
This is a scatter bubble chart ppt powerpoint presentation model designs. This is a two stage process. The stages in this process are business, profit, in percentage, bubble chart, marketing.
Key Financial Ratios Template 2 Ppt PowerPoint Presentation Icon Graphics Design
This is a key financial ratios template 2 ppt powerpoint presentation icon graphics design. This is a four stage process. The stages in this process are liquidity, profitability, activity, solvency, business.
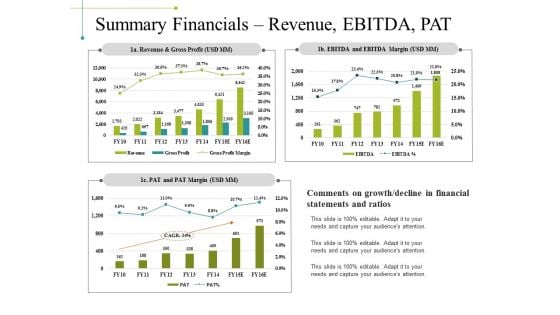
Summary Financials Revenue Ebitda Pat Ppt PowerPoint Presentation Inspiration Templates
This is a summary financials revenue ebitda pat ppt powerpoint presentation inspiration templates. This is a three stage process. The stages in this process are revenue and gross profit, pat and pat margin, ebitda and ebitda margin, business, marketing.
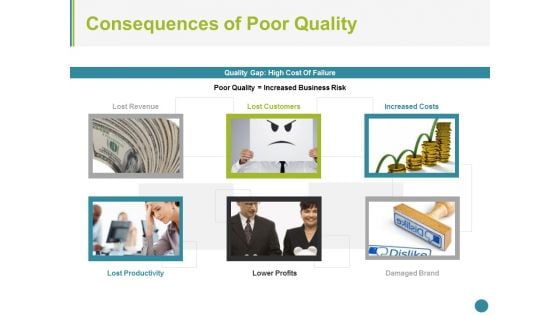
Consequences Of Poor Quality Ppt PowerPoint Presentation Ideas Graphics
This is a Consequences Of Poor Quality Ppt PowerPoint Presentation Ideas Graphics. This is a six stage process. The stages in this process are lost revenue, lost customers, increased costs, lost productivity, lower profits, damaged brand.
Stacked Line Chart Ppt PowerPoint Presentation Show Icon
This is a stacked line chart ppt powerpoint presentation show icon. This is a two stage process. The stages in this process are profit, chart, years, business, marketing, years.
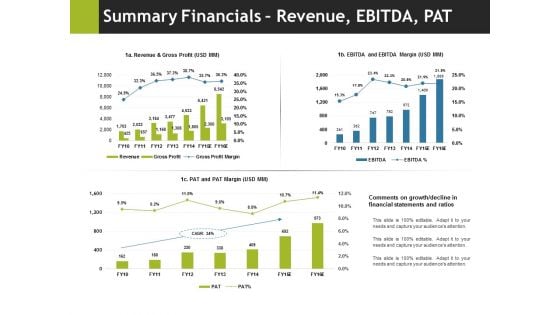
Summary Financials Revenue Ebitda Pat Ppt PowerPoint Presentation Pictures Outline
This is a summary financials revenue ebitda pat ppt powerpoint presentation pictures outline. This is a three stage process. The stages in this process are business, marketing, pat and pat margin, ebitda and ebitda margin, revenue and gross profit.
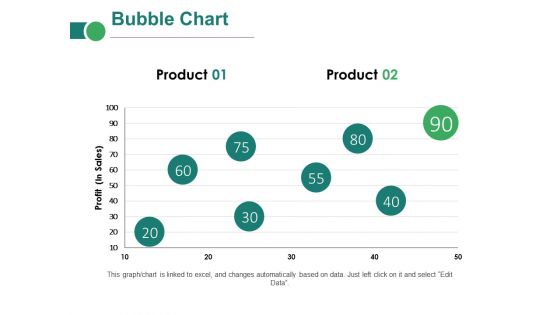
Bubble Chart Ppt PowerPoint Presentation Layouts Clipart Images
This is a bubble chart ppt powerpoint presentation layouts clipart images. This is a two stage process. The stages in this process are business, marketing, profit, innovation, technology, idea bulb.
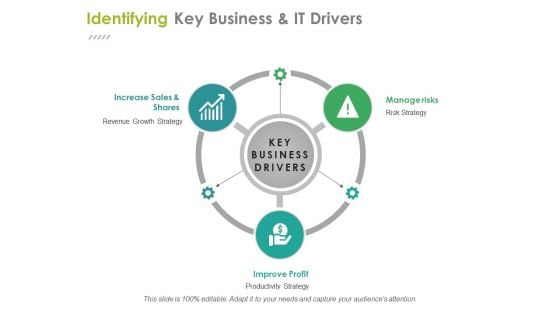
Identifying Key Business And It Drivers Ppt PowerPoint Presentation Ideas Files
This is a identifying key business and it drivers ppt powerpoint presentation ideas files. This is a three stage process. The stages in this process are increase sales and shares, improve profit, manage risks, business, management.
Clustered Bar Ppt PowerPoint Presentation Icon Professional
This is a clustered bar ppt powerpoint presentation icon professional. This is a two stage process. The stages in this process are business, marketing, profit, clustered bar, finance, strategy.
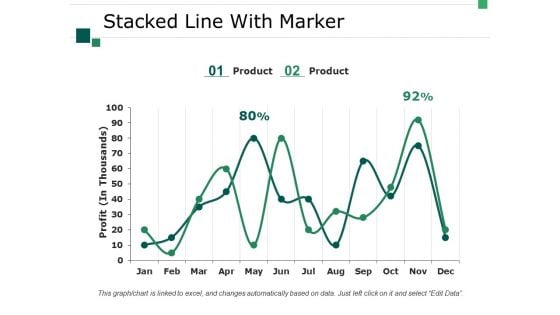
Stacked Line With Marker Ppt PowerPoint Presentation Professional Designs Download
This is a stacked line with marker ppt powerpoint presentation professional designs download. This is a two stage process. The stages in this process are business, marketing, strategy, graph, profit.
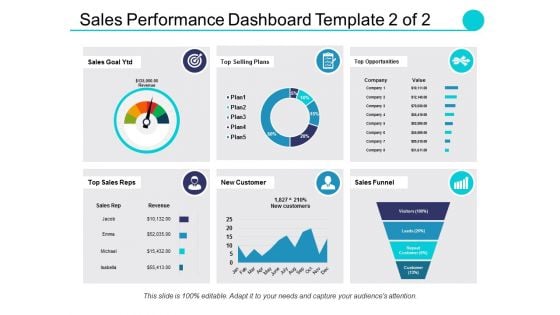
Sales Performance Dashboard Template Ppt PowerPoint Presentation Professional Elements
This is a sales performance dashboard template ppt powerpoint presentation professional elements. This is a eight stage process. The stages in this process are sales comparison, sales by product category, sales by month, brand profitability, revenue.
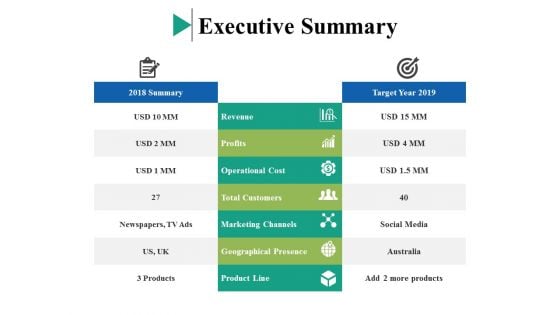
Executive Summary Ppt PowerPoint Presentation Layouts Clipart
This is a executive summary ppt powerpoint presentation layouts clipart. This is a seven stage process. The stages in this process are revenue, profits, operational cost, total customers, marketing channels.

Executive Summary Ppt PowerPoint Presentation Outline Diagrams
This is a executive summary ppt powerpoint presentation outline diagrams. This is a two stage process. The stages in this process are revenue, profits, operational cost, total customers, marketing channels.
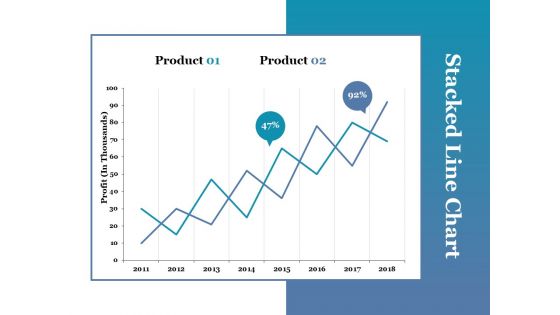
Stacked Line Chart Ppt PowerPoint Presentation Portfolio Picture
This is a stacked line chart ppt powerpoint presentation portfolio picture. This is a two stage process. The stages in this process are stacked line chart, product, profit, growth.
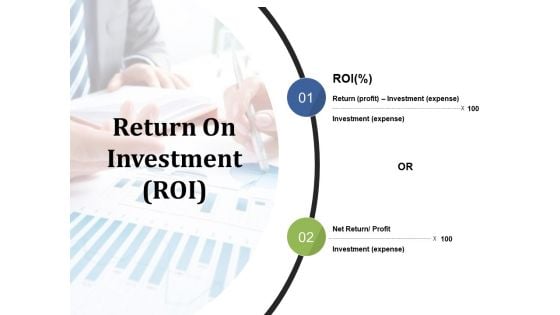
Return On Investment Ppt PowerPoint Presentation Show Gallery
This is a return on investment ppt powerpoint presentation show gallery. This is a two stage process. The stages in this process are return, investment, net return, profit, expense.
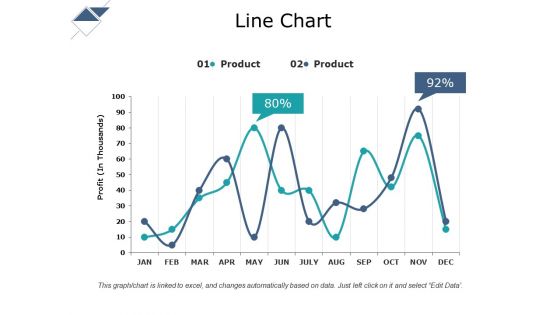
Line Chart Ppt PowerPoint Presentation Gallery Format Ideas
This is a line chart ppt powerpoint presentation gallery format ideas. This is a two stage process. The stages in this process are line chart, product, in year, profit.
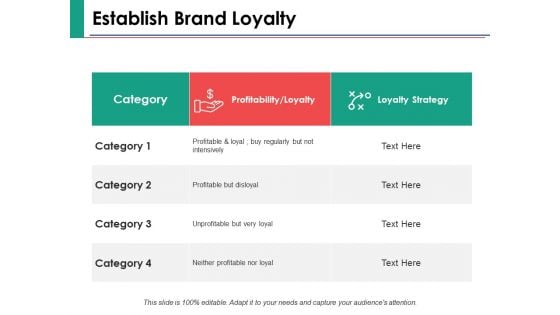
Establish Brand Loyalty Category Ppt PowerPoint Presentation Summary Template
This is a establish brand loyalty category ppt powerpoint presentation summary template. This is a four stage process. The stages in this process are category, profitability loyalty, loyalty strategy, management, strategy.
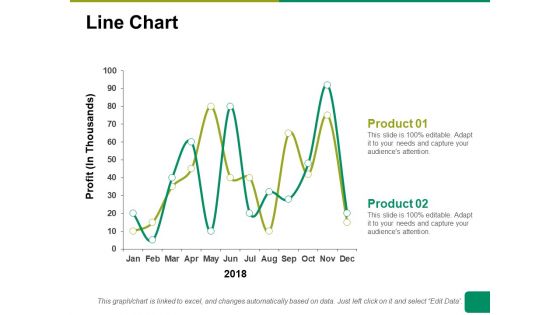
Line Chart Ppt PowerPoint Presentation Summary Ideas
This is a line chart ppt powerpoint presentation summary ideas. This is a two stage process. The stages in this process are line chart, profit, product, financial years, business.
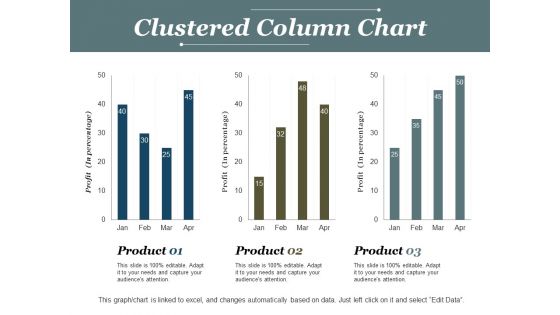
Clustered Column Chart Ppt PowerPoint Presentation Model Deck
This is a clustered column chart ppt powerpoint presentation model deck. This is a three stage process. The stages in this process are clustered column chart, product, finance, profit, business.
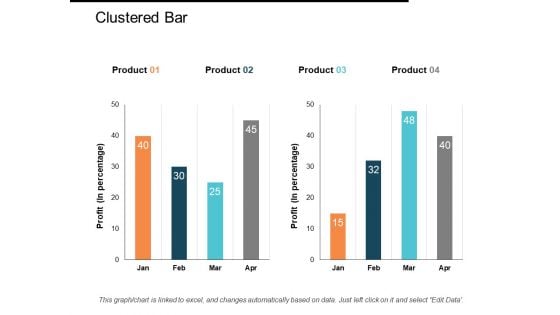
Clustered Bar Ppt PowerPoint Presentation Gallery Inspiration
This is a clustered bar ppt powerpoint presentation gallery inspiration. This is a four stage process. The stages in this process are clustered bar, product, profit, business, bar graph.
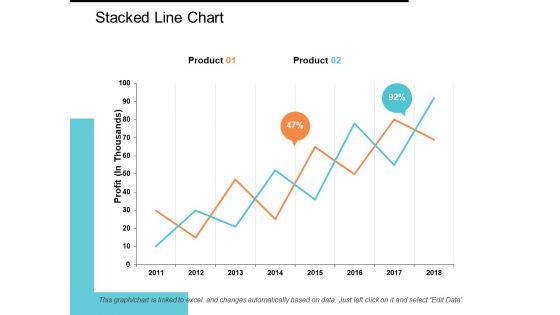
Stacked Line Chart Ppt PowerPoint Presentation Model Show
This is a stacked line chart ppt powerpoint presentation model show. This is a two stage process. The stages in this process are stacked line chart, product, profit, percentage, growth.

Identify The Risk Categories Ppt PowerPoint Presentation Gallery Background Images
This is a identify the risk categories ppt powerpoint presentation gallery background images. This is a seven stage process. The stages in this process are financial, operational, profitable growth.
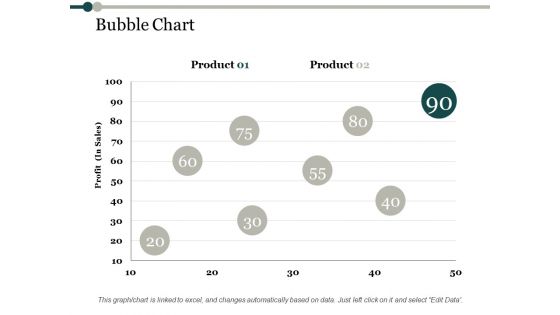
Bubble Chart Process Analysis Ppt PowerPoint Presentation Ideas Files
This is a bubble chart process analysis ppt powerpoint presentation ideas files. This is a two stage process. The stages in this process are bubble chart, product, profit, finance, business.
Clustered Bar Process Analysis Ppt PowerPoint Presentation Icon Influencers
This is a clustered bar process analysis ppt powerpoint presentation icon influencers. This is a two stage process. The stages in this process are clustered bar, profit, product, finance, business.
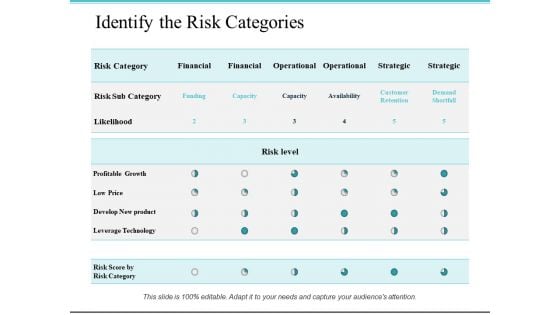
Identify The Risk Categories Ppt PowerPoint Presentation Styles Objects
This is a identify the risk categories ppt powerpoint presentation styles objects. This is a seven stage process. The stages in this process are leverage technology, develop new product, profitable growth.
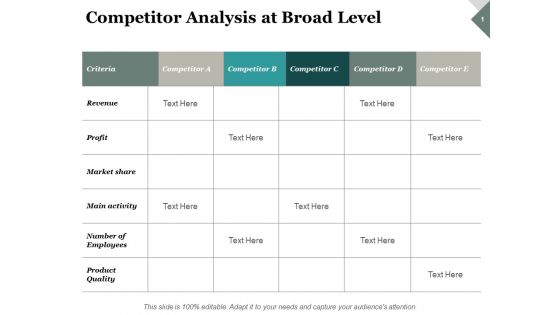
Competitor Analysis At Broad Level Ppt PowerPoint Presentation Summary Infographic Template
This is a competitor analysis at broad level ppt powerpoint presentation summary infographic template. This is a six stage process. The stages in this process are product quality, main activity, market share, profit, criteria.
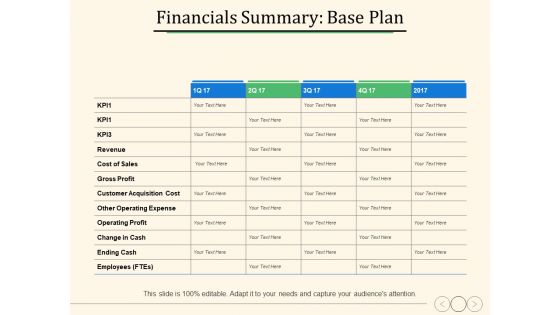
Financials Summary Base Plan Ppt PowerPoint Presentation Ideas Professional
This is a financials summary base plan ppt powerpoint presentation ideas professional. This is a five stage process. The stages in this process are operating profit, customer acquisition cost, business, marketing.
Financials Summary Stretch Plan Ppt PowerPoint Presentation Icon Shapes
This is a financials summary stretch plan ppt powerpoint presentation icon shapes. This is a five stage process. The stages in this process are operating profit, customer acquisition cost, change in cash.
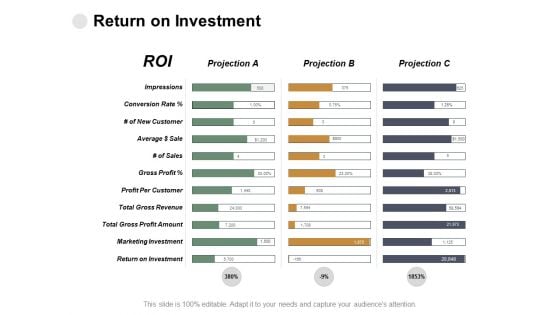
Return On Investment Impressions Ppt PowerPoint Presentation Infographics Background
This is a return on investment impressions ppt powerpoint presentation infographics background. This is a three stage process. The stages in this process are gross profit, marketing investment, impressions, returns on investment.
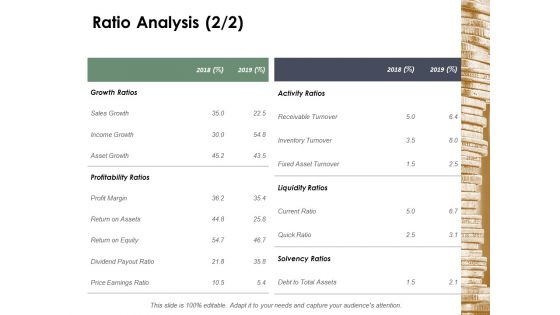
Ratio Analysis Activity Ratios Ppt Powerpoint Presentation Show Example File
This is a ratio analysis activity ratios ppt powerpoint presentation show example file. This is a six stage process. The stages in this process are liquidity ratios, solvency ratios, profitability ratios, efficiency ratios, coverage ratios.
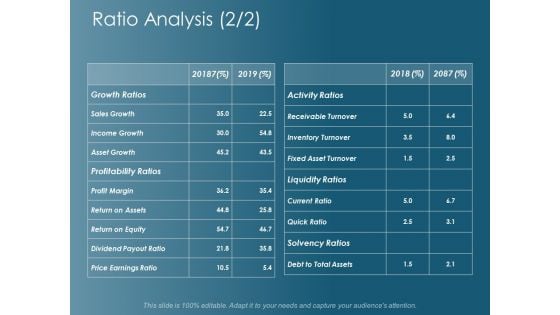
Ratio Analysis Growth Ratios Ppt Powerpoint Presentation Gallery Graphics Download
This is a ratio analysis growth ratios ppt powerpoint presentation gallery graphics download. This is a two stage process. The stages in this process are ratio analysis, sales growth, growth ratios, asset growth, profitability ratios.
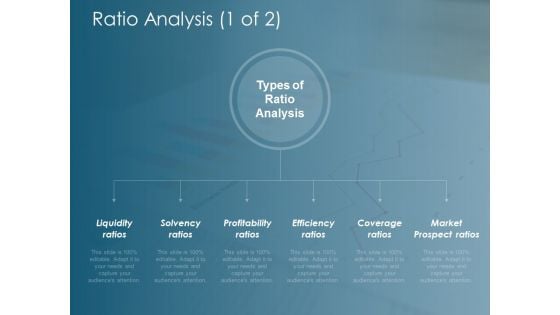
Ratio Analysis Solvency Ratios Ppt Powerpoint Presentation Professional Rules
This is a ratio analysis solvency ratios ppt powerpoint presentation professional rules. This is a six stage process. The stages in this process are ratio analysis, liquidity ratios, solvency ratios, profitability ratios, efficiency ratios.
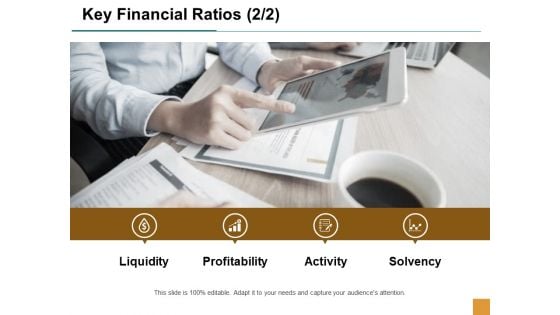
Key Financial Ratios Activity Ppt Powerpoint Presentation Ideas Example Introduction
This is a key financial ratios activity ppt powerpoint presentation ideas example introduction. This is a four stage process. The stages in this process are liquidity, profitability, activity, solvency, business.
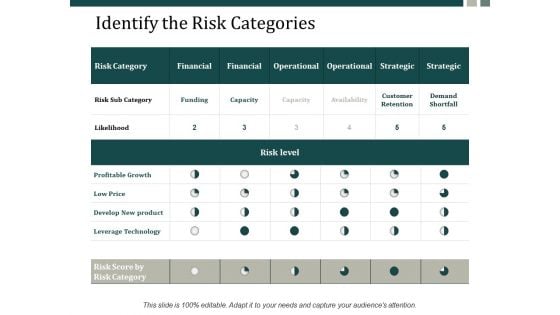
Identify The Risk Categories Ppt Powerpoint Presentation Infographics Structure Ppt Powerpoint Presentation Gallery Summary
This is a identify the risk categories ppt powerpoint presentation infographics structure ppt powerpoint presentation gallery summary. This is a six stage process. The stages in this process are financial, operational, strategic, capacity, profitable growth.
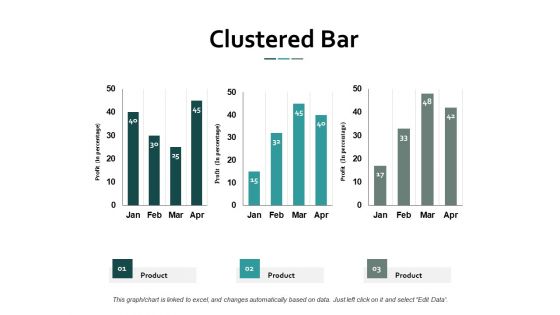
Clustered Bar Finance Ppt Powerpoint Presentation Ideas Themes
This is a clustered bar finance ppt powerpoint presentation ideas themes. This is a three stage process. The stages in this process are clustered bar, product, in percentage, years, profit.
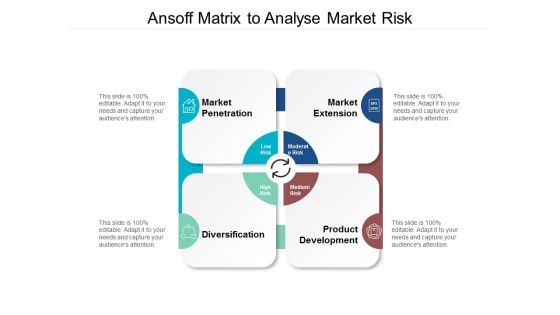
Ansoff Matrix To Analyse Market Risk Ppt Powerpoint Presentation Shapes
This is a ansoff matrix to analyse market risk ppt powerpoint presentation shapes. This is a four stage process. The stages in this process are market growth, market opportunity, market profitability.

Business Diversification Plan Product And Market Development Ppt Powerpoint Presentation Gallery Example Topics
This is a business diversification plan product and market development ppt powerpoint presentation gallery example topics. This is a four stage process. The stages in this process are market growth, market opportunity, market profitability.
Business Progress Upward Arrow Graph Vector Icon Ppt Powerpoint Presentation Model Images
This is a business progress upward arrow graph vector icon ppt powerpoint presentation model images. This is a four stage process. The stages in this process are market growth, market opportunity, market profitability.
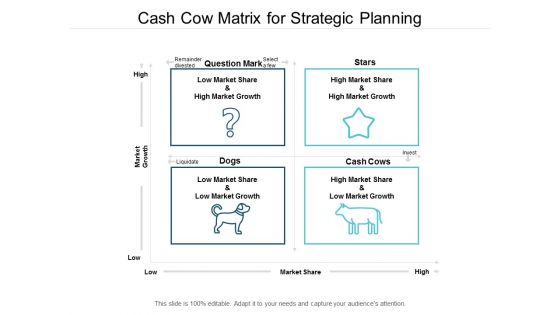
Cash Cow Matrix For Strategic Planning Ppt Powerpoint Presentation File Picture
This is a cash cow matrix for strategic planning ppt powerpoint presentation file picture. This is a four stage process. The stages in this process are market growth, market opportunity, market profitability.
Dollar Raise Money Investment Vector Icon Ppt Powerpoint Presentation Inspiration Outline
This is a dollar raise money investment vector icon ppt powerpoint presentation inspiration outline. This is a four stage process. The stages in this process are market growth, market opportunity, market profitability.
Market Penetration Strategy Development And Diversification Ppt Powerpoint Presentation Outline Icons
This is a market penetration strategy development and diversification ppt powerpoint presentation outline icons. This is a four stage process. The stages in this process are market growth, market opportunity, market profitability.
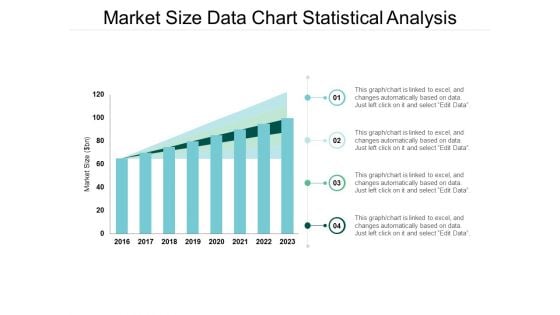
Market Size Data Chart Statistical Analysis Ppt Powerpoint Presentation Model Format
This is a market size data chart statistical analysis ppt powerpoint presentation model format. The topics discussed in this diagram are market growth, market opportunity, market profitability. This is a completely editable PowerPoint presentation, and is available for immediate download.
Market Statistical Analysis Vector Icon Ppt Powerpoint Presentation File Design Inspiration
This is a market statistical analysis vector icon ppt powerpoint presentation file design inspiration. The topics discussed in this diagram are market growth, market opportunity, market profitability. This is a completely editable PowerPoint presentation, and is available for immediate download.
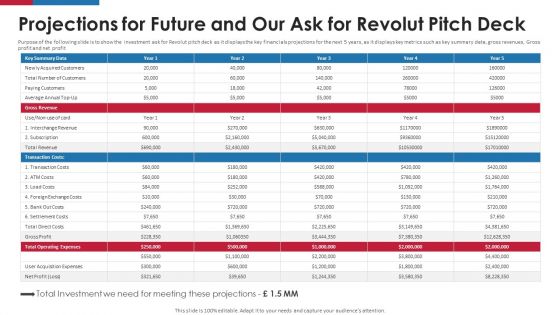
Revolut Capital Funding Projections For Future And Our Ask For Revolut Pitch Deck Ppt Pictures PDF
Purpose of the following slide is to show the investment ask for Revolut pitch deck as it displays the key financials projections for the next 5 years, as it displays key metrics such as key summary data, gross revenues, Gross profit and net profit. Purpose of the following slide is to show the investment ask for Revolut pitch deck as it displays the key financials projections for the next 5 years, as it displays key metrics such as key summary data, gross revenues, Gross profit and net profit. Deliver and pitch your topic in the best possible manner with this Revolut Capital Funding Projections For Future And Our Ask For Revolut Pitch Deck Ppt Pictures PDF. Use them to share invaluable insights on Key Summary Data, Gross Revenue, Transaction Costs and impress your audience. This template can be altered and modified as per your expectations. So, grab it now.
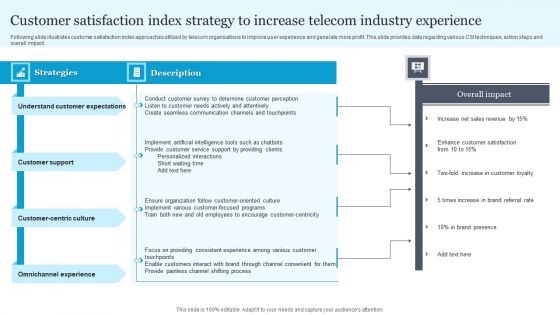
Customer Satisfaction Index Strategy To Increase Telecom Industry Experience Template PDF
Following slide illustrates customer satisfaction index approaches utilized by telecom organizations to improve user experience and generate more profit. This slide provides data regarding various CSI techniques, action steps and overall impact.
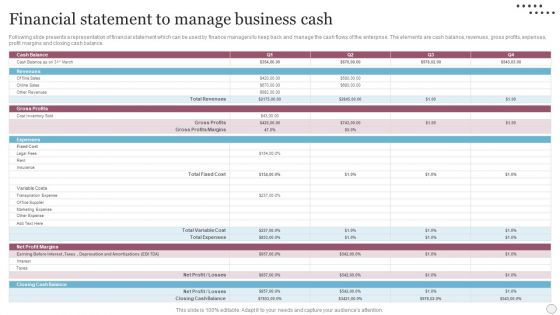
Financial Statement To Manage Business Cash Demonstration PDF
Following slide presents a representation of financial statement which can be used by finance managers to keep track and manage the cash flows of the enterprise. The elements are cash balance, revenues, gross profits, expenses, profit margins and closing cash balance. Following slide presents a representation of financial statement which can be used by finance managers to keep track and manage the cash flows of the enterprise. The elements are cash balance, revenues, gross profits, expenses, profit margins and closing cash balance. Pitch your topic with ease and precision using this Financial Statement To Manage Business Cash Demonstration PDF. This layout presents information on Financial statement to manage business cash. It is also available for immediate download and adjustment. So, changes can be made in the color, design, graphics or any other component to create a unique layout.
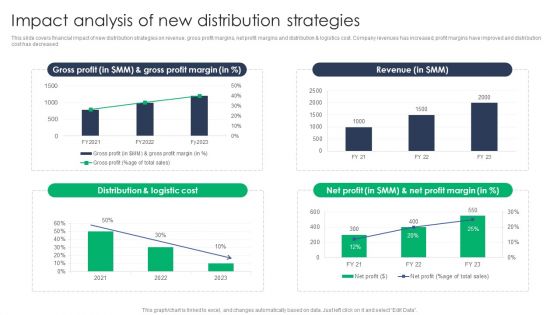
Criterion For Choosing Distribution Channel For Efficient Sales Administration Impact Analysis Elements PDF
This slide covers financial impact of new distribution strategies on revenue, gross profit margins, net profit margins and distribution and logistics cost. Company revenues has increased, profit margins have improved and distribution cost has decreased. This slide showcases the expected growth of company from new distribution channels. The growth is highlighted in terms of revenue numbers, net profit, customer base, products sold etc. Make sure to capture your audiences attention in your business displays with our gratis customizable Criterion For Choosing Distribution Channel For Efficient Sales Administration Impact Analysis Elements PDF. These are great for business strategies, office conferences, capital raising or task suggestions. If you desire to acquire more customers for your tech business and ensure they stay satisfied, create your own sales presentation with these plain slides.

Statistics Highlighting Business Key Information Comprehensive Guide Mockup Pdf
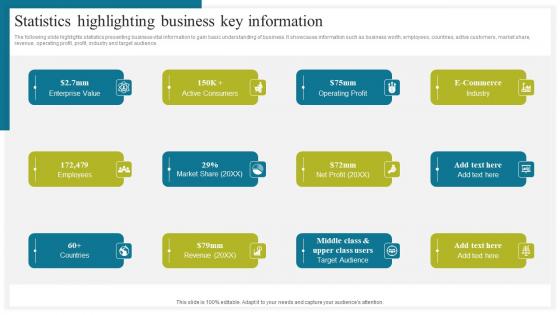
The following slide highlights statistics presenting business vital information to gain basic understanding of business. It showcases information such as business worth, employees, countries, active customers, market share, revenue, operating profit, profit, industry and target audience. Make sure to capture your audiences attention in your business displays with our gratis customizable Statistics Highlighting Business Key Information Comprehensive Guide Mockup Pdf These are great for business strategies, office conferences, capital raising or task suggestions. If you desire to acquire more customers for your tech business and ensure they stay satisfied, create your own sales presentation with these plain slides. The following slide highlights statistics presenting business vital information to gain basic understanding of business. It showcases information such as business worth, employees, countries, active customers, market share, revenue, operating profit, profit, industry and target audience.
Statistics Highlighting Business Key How To Conduct Competitive Assessment Designs Pdf
The following slide highlights statistics presenting business vital information to gain basic understanding of business. It showcases information such as business worth, employees, countries, active customers, market share, revenue, operating profit, profit, industry and target audience. Make sure to capture your audiences attention in your business displays with our gratis customizable Statistics Highlighting Business Key How To Conduct Competitive Assessment Designs Pdf. These are great for business strategies, office conferences, capital raising or task suggestions. If you desire to acquire more customers for your tech business and ensure they stay satisfied, create your own sales presentation with these plain slides. The following slide highlights statistics presenting business vital information to gain basic understanding of business. It showcases information such as business worth, employees, countries, active customers, market share, revenue, operating profit, profit, industry and target audience.
Strategic Brand Management Year Over Year Business Performance Brochure Pdf
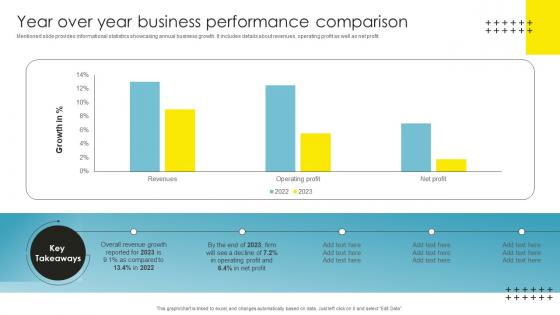
Mentioned slide provides informational statistics showcasing annual business growth. It includes details about revenues, operating profit as well as net profit. Slidegeeks is here to make your presentations a breeze with Strategic Brand Management Year Over Year Business Performance Brochure Pdf With our easy to use and customizable templates, you can focus on delivering your ideas rather than worrying about formatting. With a variety of designs to choose from, you are sure to find one that suits your needs. And with animations and unique photos, illustrations, and fonts, you can make your presentation pop. So whether you are giving a sales pitch or presenting to the board, make sure to check out Slidegeeks first. Mentioned slide provides informational statistics showcasing annual business growth. It includes details about revenues, operating profit as well as net profit.
Enhancing Global Presence Dashboard For Tracking Post Expansion Formats Pdf
This slide covers the dashboard for analyzing fast food business sales by region. It includes KPIs such as sales, sales target, target achievement, gross profit, gross profit margin, sales by channels, sales growth, etc.If your project calls for a presentation, then Slidegeeks is your go-to partner because we have professionally designed, easy-to-edit templates that are perfect for any presentation. After downloading, you can easily edit Enhancing Global Presence Dashboard For Tracking Post Expansion Formats Pdf and make the changes accordingly. You can rearrange slides or fill them with different images. Check out all the handy templates This slide covers the dashboard for analyzing fast food business sales by region. It includes KPIs such as sales, sales target, target achievement, gross profit, gross profit margin, sales by channels, sales growth, etc.


 Continue with Email

 Home
Home


