Visual Analytics
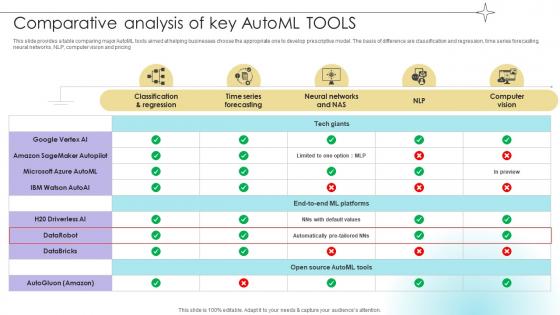
Comparative Analysis Of Key Automl Tools Data Analytics SS V
This slide provides a table comparing major AutoML tools aimed at helping businesses choose the appropriate one to develop prescriptive model. The basis of difference are classification and regression, time series forecasting, neural networks, NLP, computer vision and pricing.The Comparative Analysis Of Key Automl Tools Data Analytics SS V is a compilation of the most recent design trends as a series of slides. It is suitable for any subject or industry presentation, containing attractive visuals and photo spots for businesses to clearly express their messages. This template contains a variety of slides for the user to input data, such as structures to contrast two elements, bullet points, and slides for written information. Slidegeeks is prepared to create an impression. This slide provides a table comparing major AutoML tools aimed at helping businesses choose the appropriate one to develop prescriptive model. The basis of difference are classification and regression, time series forecasting, neural networks, NLP, computer vision and pricing.

Table Of Prescriptive Model Deployment Timeline Data Analytics SS V
This slide provides a deployment table of prescriptive model aimed at highlighting movement of models through various phases. The basis of deployment are stage, start and end date, manager name with resources utilized.The Table Of Prescriptive Model Deployment Timeline Data Analytics SS V is a compilation of the most recent design trends as a series of slides. It is suitable for any subject or industry presentation, containing attractive visuals and photo spots for businesses to clearly express their messages. This template contains a variety of slides for the user to input data, such as structures to contrast two elements, bullet points, and slides for written information. Slidegeeks is prepared to create an impression. This slide provides a deployment table of prescriptive model aimed at highlighting movement of models through various phases. The basis of deployment are stage, start and end date, manager name with resources utilized.
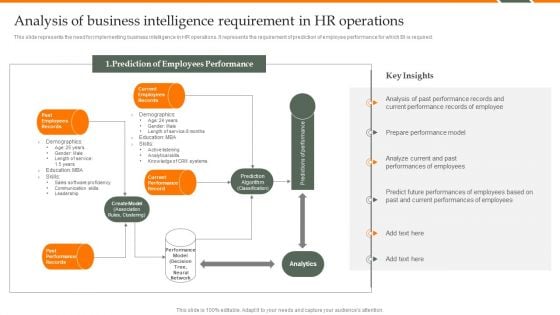
Human Resource Analytics Analysis Of Business Intelligence Requirement Template PDF
This slide represents the need for implementing business intelligence in HR operations. It represents the requirement of prediction of employee performance for which BI is required. Do you know about Slidesgeeks Human Resource Analytics Analysis Of Business Intelligence Requirement Template PDF These are perfect for delivering any kind od presentation. Using it, create PowerPoint presentations that communicate your ideas and engage audiences. Save time and effort by using our pre-designed presentation templates that are perfect for a wide range of topic. Our vast selection of designs covers a range of styles, from creative to business, and are all highly customizable and easy to edit. Download as a PowerPoint template or use them as Google Slides themes.
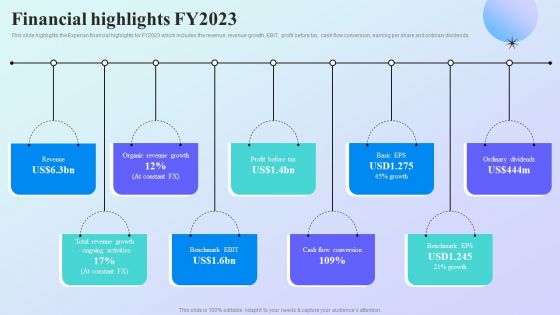
Information Analytics Company Outline Financial Highlights FY2023 Summary PDF
This slide highlights the Experian financial highlights for FY2023 which includes the revenue, revenue growth, EBIT, profit before tax, cash flow conversion, earning per share and ordinary dividends. Welcome to our selection of the Information Analytics Company Outline Financial Highlights FY2023 Summary PDF. These are designed to help you showcase your creativity and bring your sphere to life. Planning and Innovation are essential for any business that is just starting out. This collection contains the designs that you need for your everyday presentations. All of our PowerPoints are 100 percent editable, so you can customize them to suit your needs. This multi purpose template can be used in various situations. Grab these presentation templates today.
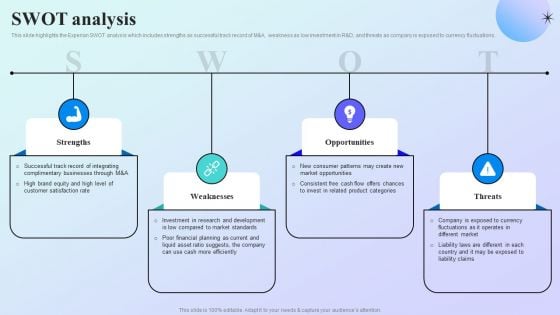
Information Analytics Company Outline SWOT Analysis Demonstration PDF
This slide highlights the Experian SWOT analysis which includes strengths as successful track record of M and A, weakness as low investment in R and D, and threats as company is exposed to currency fluctuations. Retrieve professionally designed Information Analytics Company Outline SWOT Analysis Demonstration PDF to effectively convey your message and captivate your listeners. Save time by selecting pre made slideshows that are appropriate for various topics, from business to educational purposes. These themes come in many different styles, from creative to corporate, and all of them are easily adjustable and can be edited quickly. Access them as PowerPoint templates or as Google Slides themes. You do not have to go on a hunt for the perfect presentation because Slidegeeks got you covered from everywhere.
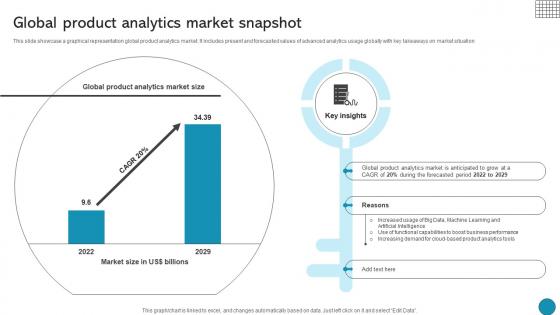
Global Product Analytics Market Snapshot Driving Business Success Integrating Product
This slide showcase a graphical representation global product analytics market. It includes present and forecasted values of advanced analytics usage globally with key takeaways on market situationThis modern and well-arranged Global Product Analytics Market Snapshot Driving Business Success Integrating Product provides lots of creative possibilities. It is very simple to customize and edit with the Powerpoint Software. Just drag and drop your pictures into the shapes. All facets of this template can be edited with Powerpoint, no extra software is necessary. Add your own material, put your images in the places assigned for them, adjust the colors, and then you can show your slides to the world, with an animated slide included. This slide showcase a graphical representation global product analytics market. It includes present and forecasted values of advanced analytics usage globally with key takeaways on market situation
Icon Showing Developing Statistical Capabilities Analytics Ppt Model Show PDF
Pitch your topic with ease and precision using this Icon Showing Developing Statistical Capabilities Analytics Ppt Model Show PDF. This layout presents information on Icon Showing, Developing Statistical, Capabilities Analytics. It is also available for immediate download and adjustment. So, changes can be made in the color, design, graphics or any other component to create a unique layout. Our Icon Showing Developing Statistical Capabilities Analytics Ppt Model Show PDF are topically designed to provide an attractive backdrop to any subject. Use them to look like a presentation pro.
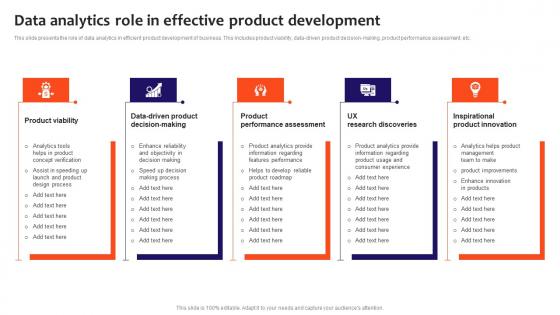
Data Analytics Role In Effective Product Development Slides Pdf
This slide presents the role of data analytics in efficient product development of business. This includes product viability, data driven product decision making, product performance assessment, etc. Pitch your topic with ease and precision using this Data Analytics Role In Effective Product Development Slides Pdf. This layout presents information on Product Viability, Product Performance, Inspirational Product Innovation. It is also available for immediate download and adjustment. So, changes can be made in the color, design, graphics or any other component to create a unique layout. This slide presents the role of data analytics in efficient product development of business. This includes product viability, data driven product decision making, product performance assessment, etc.
Social Media Analytics Icon For New Product Development Portrait Pdf
Pitch your topic with ease and precision using this Social Media Analytics Icon For New Product Development Portrait Pdf. This layout presents information on Social Media Analytics Icon, New Product Development. It is also available for immediate download and adjustment. So, changes can be made in the color, design, graphics or any other component to create a unique layout. Our Social Media Analytics Icon For New Product Development Portrait Pdf are topically designed to provide an attractive backdrop to any subject. Use them to look like a presentation pro.
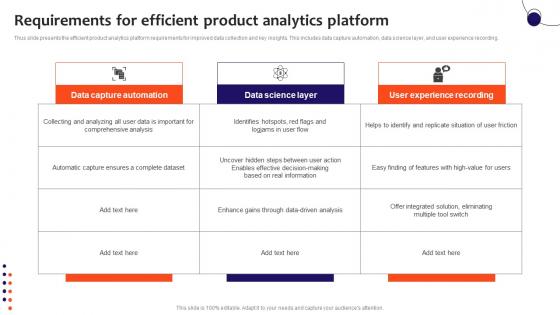
Requirements For Efficient Product Analytics Platform Guidelines Pdf
Thus slide presents the efficient product analytics platform requirements for improved data collection and key insights. This includes data capture automation, data science layer, and user experience recording. Pitch your topic with ease and precision using this Requirements For Efficient Product Analytics Platform Guidelines Pdf. This layout presents information on Comprehensive Analysis, Data Driven Analysis, Information. It is also available for immediate download and adjustment. So, changes can be made in the color, design, graphics or any other component to create a unique layout. Thus slide presents the efficient product analytics platform requirements for improved data collection and key insights. This includes data capture automation, data science layer, and user experience recording.
Icon For Big Data Analytics In Digital Marketing Introduction Pdf
Pitch your topic with ease and precision using this Icon For Big Data Analytics In Digital Marketing Introduction Pdf. This layout presents information on Big Data, Analytics, Digital Marketing. It is also available for immediate download and adjustment. So, changes can be made in the color, design, graphics or any other component to create a unique layout. Our Icon For Big Data Analytics In Digital Marketing Introduction Pdf are topically designed to provide an attractive backdrop to any subject. Use them to look like a presentation pro.
Internet Of Things And Edge Analytics Icon Themes Pdf
Pitch your topic with ease and precision using this Internet Of Things And Edge Analytics Icon Themes Pdf This layout presents information on Internet Things, Edge Analytics Icon It is also available for immediate download and adjustment. So, changes can be made in the color, design, graphics or any other component to create a unique layout. Our Internet Of Things And Edge Analytics Icon Themes Pdf are topically designed to provide an attractive backdrop to any subject. Use them to look like a presentation pro.
Real Time Edge Data Analytics Icon Ideas Pdf
Pitch your topic with ease and precision using this Real Time Edge Data Analytics Icon Ideas Pdf This layout presents information on Real Time Edge, Data Analytics Icon It is also available for immediate download and adjustment. So, changes can be made in the color, design, graphics or any other component to create a unique layout. Our Real Time Edge Data Analytics Icon Ideas Pdf are topically designed to provide an attractive backdrop to any subject. Use them to look like a presentation pro.
Advanced Data Analytics In Cloud Computing Icon Summary Pdf
Pitch your topic with ease and precision using this Advanced Data Analytics In Cloud Computing Icon Summary Pdf. This layout presents information on Advanced Data Analytics, Cloud Computing Icon. It is also available for immediate download and adjustment. So, changes can be made in the color, design, graphics or any other component to create a unique layout. Our Advanced Data Analytics In Cloud Computing Icon Summary Pdf are topically designed to provide an attractive backdrop to any subject. Use them to look like a presentation pro.

Analytics Report Client In Powerpoint And Google Slides Cpb
Presenting our innovatively-designed set of slides titled Analytics Report Client In Powerpoint And Google Slides Cpb. This completely editable PowerPoint graphic exhibits Analytics Report Client that will help you convey the message impactfully. It can be accessed with Google Slides and is available in both standard screen and widescreen aspect ratios. Apart from this, you can download this well-structured PowerPoint template design in different formats like PDF, JPG, and PNG. So, click the download button now to gain full access to this PPT design. Our Analytics Report Client In Powerpoint And Google Slides Cpb are topically designed to provide an attractive backdrop to any subject. Use them to look like a presentation pro.
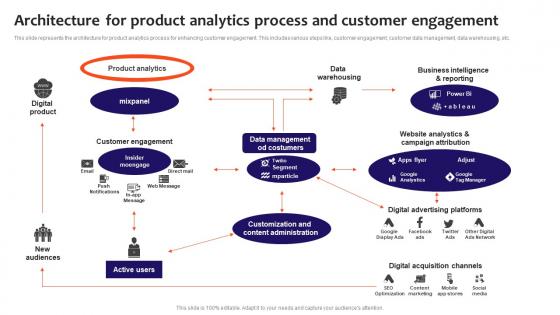
Architecture For Product Analytics Process And Customer Engagement Elements Pdf
This slide represents the architecture for product analytics process for enhancing customer engagement. This includes various steps like, customer engagement, customer data management, data warehousing, etc. Pitch your topic with ease and precision using this Architecture For Product Analytics Process And Customer Engagement Elements Pdf. This layout presents information on Customer Engagement, Product Analytics, Data Management. It is also available for immediate download and adjustment. So, changes can be made in the color, design, graphics or any other component to create a unique layout. This slide represents the architecture for product analytics process for enhancing customer engagement. This includes various steps like, customer engagement, customer data management, data warehousing, etc.
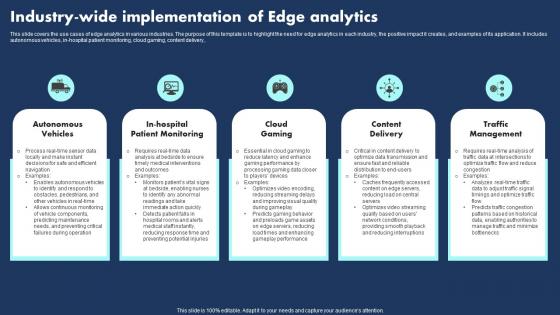
Industry Wide Implementation Of Edge Analytics Background Pdf
This slide covers the use cases of edge analytics in various industries. The purpose of this template is to highlight the need for edge analytics in each industry, the positive impact it creates, and examples of its application. It includes autonomous vehicles, in hospital patient monitoring, cloud gaming, content delivery,.Pitch your topic with ease and precision using this Industry Wide Implementation Of Edge Analytics Background Pdf This layout presents information on Autonomous Vehicles, Cloud Gaming, Content Delivery It is also available for immediate download and adjustment. So, changes can be made in the color, design, graphics or any other component to create a unique layout. This slide covers the use cases of edge analytics in various industries. The purpose of this template is to highlight the need for edge analytics in each industry, the positive impact it creates, and examples of its application. It includes autonomous vehicles, in hospital patient monitoring, cloud gaming, content delivery,.
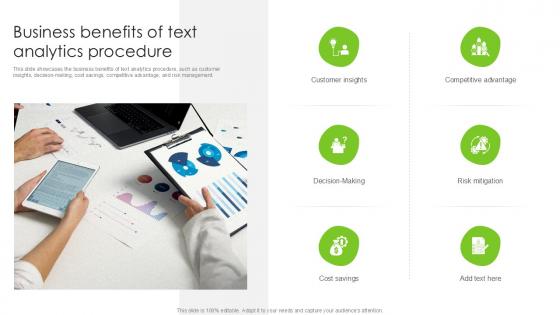
Business Benefits Of Text Analytics Procedure PPT Presentation SS
This slide showcases the business benefits of text analytics procedure, such as customer insights, decision-making, cost savings, competitive advantage, and risk management. If you are looking for a format to display your unique thoughts, then the professionally designed Business Benefits Of Text Analytics Procedure PPT Presentation SS is the one for you. You can use it as a Google Slides template or a PowerPoint template. Incorporate impressive visuals, symbols, images, and other charts. Modify or reorganize the text boxes as you desire. Experiment with shade schemes and font pairings. Alter, share or cooperate with other people on your work. Download Business Benefits Of Text Analytics Procedure PPT Presentation SS and find out how to give a successful presentation. Present a perfect display to your team and make your presentation unforgettable. This slide showcases the business benefits of text analytics procedure, such as customer insights, decision-making, cost savings, competitive advantage, and risk management.
KPI Dashboard Tracking Major Promotional Analytics Future Trends Rules Pdf
This slide covers the dashboard for analysing paid search metrics such as ad cost, clicks, impressions, click through rate, cost per conversion, conversion rate, cost per click, etc. The KPI Dashboard Tracking Major Promotional Analytics Future Trends Rules Pdf is a compilation of the most recent design trends as a series of slides. It is suitable for any subject or industry presentation, containing attractive visuals and photo spots for businesses to clearly express their messages. This template contains a variety of slides for the user to input data, such as structures to contrast two elements, bullet points, and slides for written information. Slidegeeks is prepared to create an impression. This slide covers the dashboard for analysing paid search metrics such as ad cost, clicks, impressions, click through rate, cost per conversion, conversion rate, cost per click, etc.
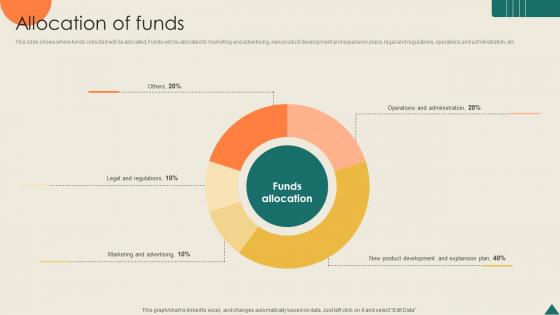
Allocation Of Funds Financial Analytics Platform Investor Elevator Pitch Deck
This slide shows where funds collected will be allocated. Funds will be allocated to marketing and advertising, new product development and expansion plans, legal and regulations, operations and administration, etc. The Allocation Of Funds Financial Analytics Platform Investor Elevator Pitch Deck is a compilation of the most recent design trends as a series of slides. It is suitable for any subject or industry presentation, containing attractive visuals and photo spots for businesses to clearly express their messages. This template contains a variety of slides for the user to input data, such as structures to contrast two elements, bullet points, and slides for written information. Slidegeeks is prepared to create an impression. This slide shows where funds collected will be allocated. Funds will be allocated to marketing and advertising, new product development and expansion plans, legal and regulations, operations and administration, etc.

Benefits Of Leveraging Decision Tree Analysis Data Analytics SS V
This slide outlines key advantages of leveraging decision tree analysis aimed at identifying correct solutions to any problem. It covers the benefits such as depicts suitable project, easy classification, assistance for multiple tools, etc.Coming up with a presentation necessitates that the majority of the effort goes into the content and the message you intend to convey. The visuals of a PowerPoint presentation can only be effective if it supplements and supports the story that is being told. Keeping this in mind our experts created Benefits Of Leveraging Decision Tree Analysis Data Analytics SS V to reduce the time that goes into designing the presentation. This way, you can concentrate on the message while our designers take care of providing you with the right template for the situation. This slide outlines key advantages of leveraging decision tree analysis aimed at identifying correct solutions to any problem. It covers the benefits such as depicts suitable project, easy classification, assistance for multiple tools, etc.
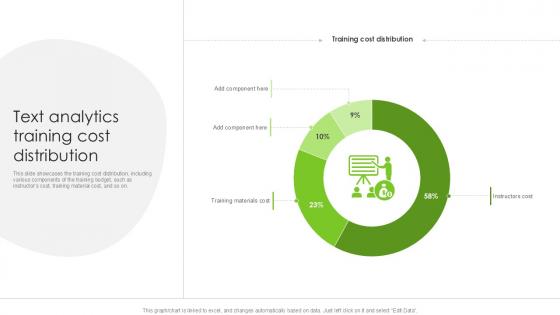
Text Analytics Training Cost Distribution PPT Sample SS
This slide showcases the training cost distribution, including various components of the training budget, such as instructors cost, training material cost, and so on. The Text Analytics Training Cost Distribution PPT Sample SS is a compilation of the most recent design trends as a series of slides. It is suitable for any subject or industry presentation, containing attractive visuals and photo spots for businesses to clearly express their messages. This template contains a variety of slides for the user to input data, such as structures to contrast two elements, bullet points, and slides for written information. Slidegeeks is prepared to create an impression. This slide showcases the training cost distribution, including various components of the training budget, such as instructors cost, training material cost, and so on.

Product Analytics Implementation Action Plan In Organization Download Pdf
This slide represents steps for implementing seamless product analysis in an organization for gaining valuable insights. This includes steps like select relevant platform, make stakeholders team, set KPIs, And using analytics stack. Pitch your topic with ease and precision using this Product Analytics Implementation Action Plan In Organization Download Pdf. This layout presents information on Product Analytics, Relevant Platform, Develop Response Strategy. It is also available for immediate download and adjustment. So, changes can be made in the color, design, graphics or any other component to create a unique layout. This slide represents steps for implementing seamless product analysis in an organization for gaining valuable insights. This includes steps like select relevant platform, make stakeholders team, set KPIs, And using analytics stack.
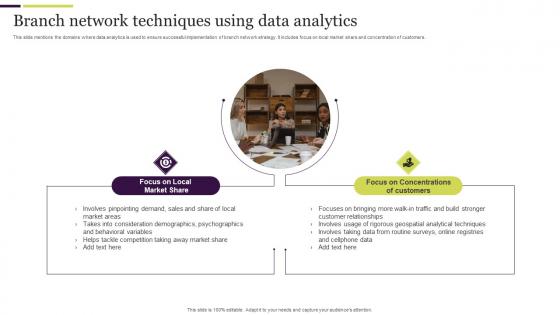
Branch Network Techniques Using Data Analytics Microsoft Pdf
This slide mentions the domains where data analytics is used to ensure successful implementation of branch network strategy. It includes focus on local market share and concentration of customers. Pitch your topic with ease and precision using this Branch Network Techniques Using Data Analytics Microsoft Pdf. This layout presents information on Concentrations Of Customers, Branch Network Techniques, Data Analytics. It is also available for immediate download and adjustment. So, changes can be made in the color, design, graphics or any other component to create a unique layout. This slide mentions the domains where data analytics is used to ensure successful implementation of branch network strategy. It includes focus on local market share and concentration of customers.
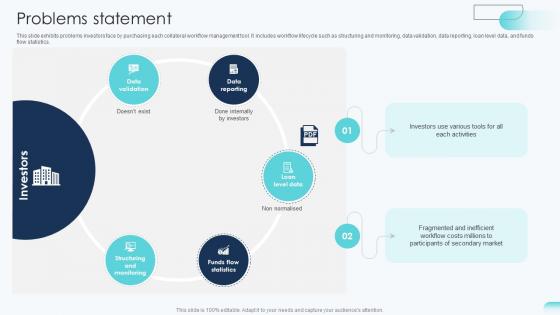
Problems Statement Big Data Analytics Investor Funding Elevator Pitch Deck
This slide exhibits problems investors face by purchasing each collateral workflow management tool. It includes workflow lifecycle such as structuring and monitoring, data validation, data reporting, loan level data, and funds flow statistics. Formulating a presentation can take up a lot of effort and time, so the content and message should always be the primary focus. The visuals of the PowerPoint can enhance the presenters message, so our Problems Statement Big Data Analytics Investor Funding Elevator Pitch Deck was created to help save time. Instead of worrying about the design, the presenter can concentrate on the message while our designers work on creating the ideal templates for whatever situation is needed. Slidegeeks has experts for everything from amazing designs to valuable content, we have put everything into Problems Statement Big Data Analytics Investor Funding Elevator Pitch Deck. This slide exhibits problems investors face by purchasing each collateral workflow management tool. It includes workflow lifecycle such as structuring and monitoring, data validation, data reporting, loan level data, and funds flow statistics.
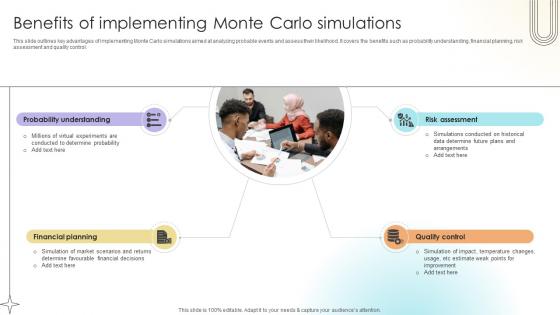
Benefits Of Implementing Monte Carlo Simulations Data Analytics SS V
This slide outlines key advantages of implementing Monte Carlo simulations aimed at analyzing probable events and assess their likelihood. It covers the benefits such as probability understanding, financial planning, risk assessment and quality control. Formulating a presentation can take up a lot of effort and time, so the content and message should always be the primary focus. The visuals of the PowerPoint can enhance the presenters message, so our Benefits Of Implementing Monte Carlo Simulations Data Analytics SS V was created to help save time. Instead of worrying about the design, the presenter can concentrate on the message while our designers work on creating the ideal templates for whatever situation is needed. Slidegeeks has experts for everything from amazing designs to valuable content, we have put everything into Benefits Of Implementing Monte Carlo Simulations Data Analytics SS V. This slide outlines key advantages of implementing Monte Carlo simulations aimed at analyzing probable events and assess their likelihood. It covers the benefits such as probability understanding, financial planning, risk assessment and quality control.
Augmented Technologies Data And Analytics Management Icon Template Pdf
Pitch your topic with ease and precision using this Augmented Technologies Data And Analytics Management Icon Template Pdf. This layout presents information on Augmented Technologies Data, Analytics Management Icon. It is also available for immediate download and adjustment. So, changes can be made in the color, design, graphics or any other component to create a unique layout. Our Augmented Technologies Data And Analytics Management Icon Template Pdf are topically designed to provide an attractive backdrop to any subject. Use them to look like a presentation pro.
Analytics Custom In Powerpoint And Google Slides Cpb
Presenting our innovatively designed set of slides titled Analytics Custom In Powerpoint And Google Slides Cpb. This completely editable PowerPoint graphic exhibits Analytics Custom that will help you convey the message impactfully. It can be accessed with Google Slides and is available in both standard screen and widescreen aspect ratios. Apart from this, you can download this well structured PowerPoint template design in different formats like PDF, JPG, and PNG. So, click the download button now to gain full access to this PPT design. Our Analytics Custom In Powerpoint And Google Slides Cpb are topically designed to provide an attractive backdrop to any subject. Use them to look like a presentation pro.

Benefits And Positive Impacts Of Edge Analytics Infographics Pdf
This slide covers the benefits of edge analytics and positive impacts on businesses. The purpose of this template is to showcase the advantages of edge analytics in terms of reduced latency, improved security, and improved compliance. It includes operational efficiency, reduced data breaches, and enhanced decision making.Pitch your topic with ease and precision using this Benefits And Positive Impacts Of Edge Analytics Infographics Pdf This layout presents information on Reduced Latency, Improved Security, Increased Scalability It is also available for immediate download and adjustment. So, changes can be made in the color, design, graphics or any other component to create a unique layout. This slide covers the benefits of edge analytics and positive impacts on businesses. The purpose of this template is to showcase the advantages of edge analytics in terms of reduced latency, improved security, and improved compliance. It includes operational efficiency, reduced data breaches, and enhanced decision making.
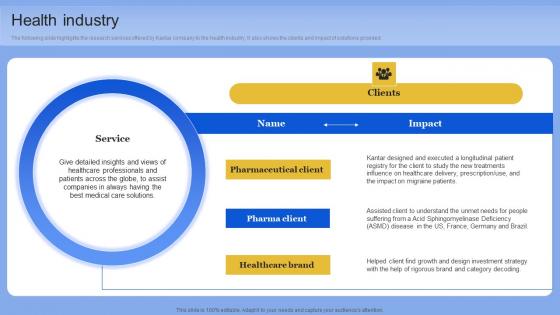
Health Industry Data Analytics Company Outline Professional PDF
The following slide highlights the research services offered by Kantar company to the health industry. It also shows the clients and impact of solutions provided. Coming up with a presentation necessitates that the majority of the effort goes into the content and the message you intend to convey. The visuals of a PowerPoint presentation can only be effective if it supplements and supports the story that is being told. Keeping this in mind our experts created Health Industry Data Analytics Company Outline Professional PDF to reduce the time that goes into designing the presentation. This way, you can concentrate on the message while our designers take care of providing you with the right template for the situation. The following slide highlights the research services offered by Kantar company to the health industry. It also shows the clients and impact of solutions provided
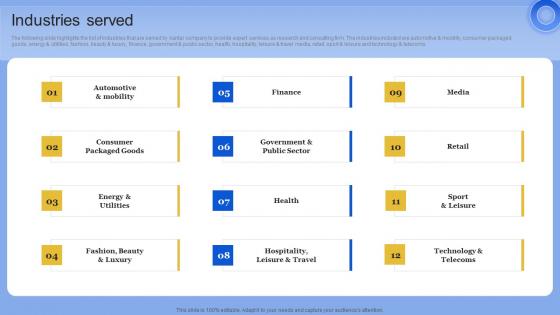
Industries Served Data Analytics Company Outline Inspiration PDF
The following slide highlights the research services offered by Kantar company to the media industry. It also shows the clients and impact of solutions provided. The best PPT templates are a great way to save time, energy, and resources. Slidegeeks have 100 percent editable powerpoint slides making them incredibly versatile. With these quality presentation templates, you can create a captivating and memorable presentation by combining visually appealing slides and effectively communicating your message. Download Industries Served Data Analytics Company Outline Inspiration PDF from Slidegeeks and deliver a wonderful presentation. The following slide highlights the research services offered by Kantar company to the media industry. It also shows the clients and impact of solutions provided
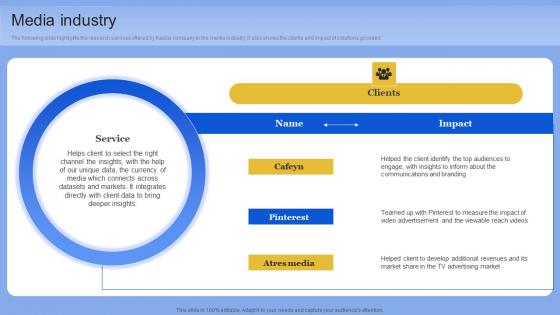
Media Industry Data Analytics Company Outline Structure PDF
The following slide highlights the research services offered by Kantar company to the media industry. It also shows the clients and impact of solutions provided. The Media Industry Data Analytics Company Outline Structure PDF is a compilation of the most recent design trends as a series of slides. It is suitable for any subject or industry presentation, containing attractive visuals and photo spots for businesses to clearly express their messages. This template contains a variety of slides for the user to input data, such as structures to contrast two elements, bullet points, and slides for written information. Slidegeeks is prepared to create an impression. The following slide highlights the research services offered by Kantar company to the media industry. It also shows the clients and impact of solutions provided
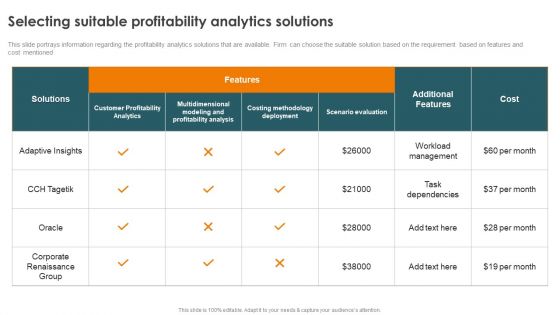
Profitability Modelling Framework Selecting Suitable Profitability Analytics Solutions Infographics PDF
This slide portrays information regarding the profitability analytics solutions that are available. Firm can choose the suitable solution based on the requirement based on features and cost mentioned. The best PPT templates are a great way to save time, energy, and resources. Slidegeeks have 100 percent editable powerpoint slides making them incredibly versatile. With these quality presentation templates, you can create a captivating and memorable presentation by combining visually appealing slides and effectively communicating your message. Download Profitability Modelling Framework Selecting Suitable Profitability Analytics Solutions Infographics PDF from Slidegeeks and deliver a wonderful presentation.
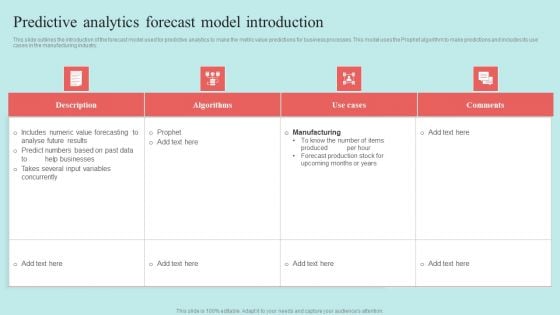
Predictive Data Model Predictive Analytics Forecast Model Introduction Themes PDF
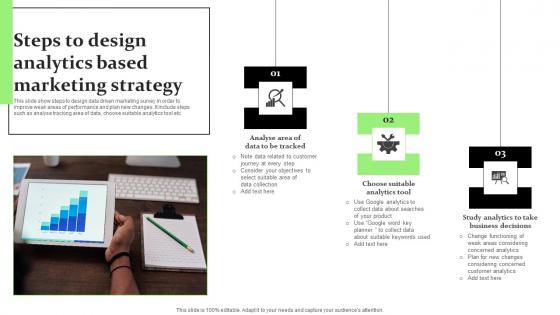
Steps To Design Analytics Based Marketing Strategy Diagrams Pdf
This slide show steps to design data driven marketing survey in order to improve weak areas of performance and plan new changes. It include steps such as analyse tracking area of data, choose suitable analytics tool etc.Pitch your topic with ease and precision using this Steps To Design Analytics Based Marketing Strategy Diagrams Pdf This layout presents information on Data Tracked, Analytics Tool, Business Decisions It is also available for immediate download and adjustment. So, changes can be made in the color, design, graphics or any other component to create a unique layout. This slide show steps to design data driven marketing survey in order to improve weak areas of performance and plan new changes. It include steps such as analyse tracking area of data, choose suitable analytics tool etc.
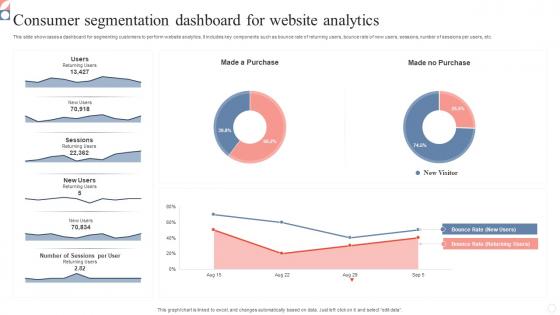
Consumer Segmentation Dashboard For Website Analytics Infographics Pdf
This slide showcases a dashboard for segmenting customers to perform website analytics. It includes key components such as bounce rate of returning users, bounce rate of new users, sessions, number of sessions per users, etc. Pitch your topic with ease and precision using this Consumer Segmentation Dashboard For Website Analytics Infographics Pdf. This layout presents information on Consumer Segmentation Dashboard, Website Analytics, Segmenting Customers. It is also available for immediate download and adjustment. So, changes can be made in the color, design, graphics or any other component to create a unique layout. This slide showcases a dashboard for segmenting customers to perform website analytics. It includes key components such as bounce rate of returning users, bounce rate of new users, sessions, number of sessions per users, etc.
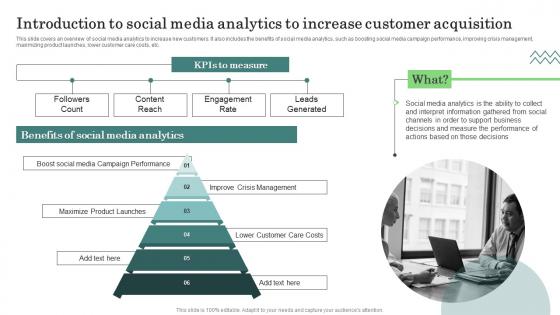
Introduction Social Media Major Promotional Analytics Future Trends Rules Pdf
This slide covers an overview of social media analytics to increase new customers. It also includes the benefits of social media analytics, such as boosting social media campaign performance, improving crisis management, maximizing product launches, lower customer care costs, etc. This modern and well arranged Introduction Social Media Major Promotional Analytics Future Trends Rules Pdf provides lots of creative possibilities. It is very simple to customize and edit with the Powerpoint Software. Just drag and drop your pictures into the shapes. All facets of this template can be edited with Powerpoint, no extra software is necessary. Add your own material, put your images in the places assigned for them, adjust the colors, and then you can show your slides to the world, with an animated slide included. This slide covers an overview of social media analytics to increase new customers. It also includes the benefits of social media analytics, such as boosting social media campaign performance, improving crisis management, maximizing product launches, lower customer care costs, etc.
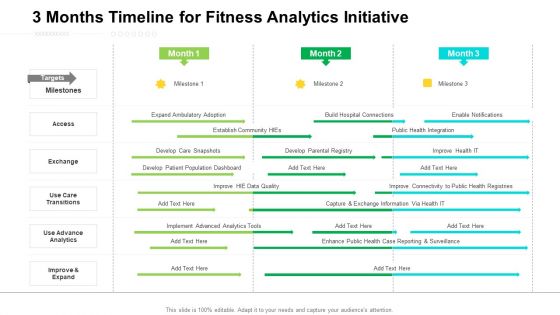
3 Months Timeline For Fitness Analytics Initiative Guidelines
Presenting our jaw dropping 3 months timeline for fitness analytics initiative guidelines. You can alternate the color, font size, font type, and shapes of this PPT layout according to your strategic process. This PPT presentation is compatible with Google Slides and is available in both standard screen and widescreen aspect ratios. You can also download this well researched PowerPoint template design in different formats like PDF, JPG, and PNG. So utilize this visually appealing design by clicking the download button given below.
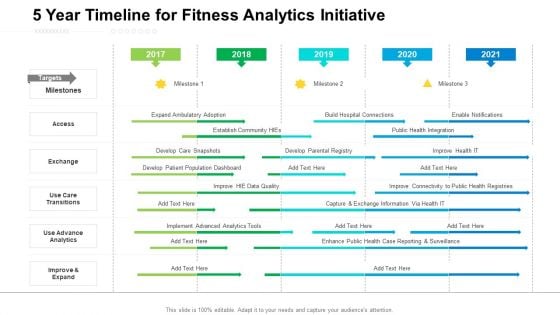
5 Year Timeline For Fitness Analytics Initiative Ideas
Presenting our jaw dropping 5 year timeline for fitness analytics initiative ideas. You can alternate the color, font size, font type, and shapes of this PPT layout according to your strategic process. This PPT presentation is compatible with Google Slides and is available in both standard screen and widescreen aspect ratios. You can also download this well researched PowerPoint template design in different formats like PDF, JPG, and PNG. So utilize this visually appealing design by clicking the download button given below.
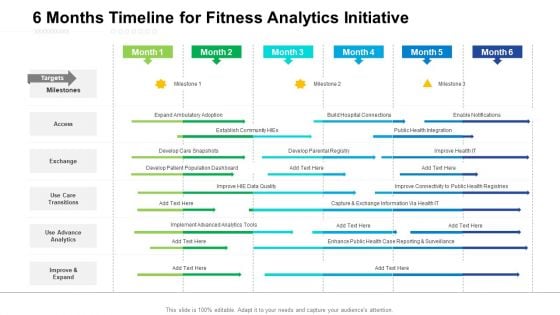
6 Months Timeline For Fitness Analytics Initiative Mockup
Presenting our jaw dropping 6 months timeline for fitness analytics initiative mockup. You can alternate the color, font size, font type, and shapes of this PPT layout according to your strategic process. This PPT presentation is compatible with Google Slides and is available in both standard screen and widescreen aspect ratios. You can also download this well researched PowerPoint template design in different formats like PDF, JPG, and PNG. So utilize this visually appealing design by clicking the download button given below.
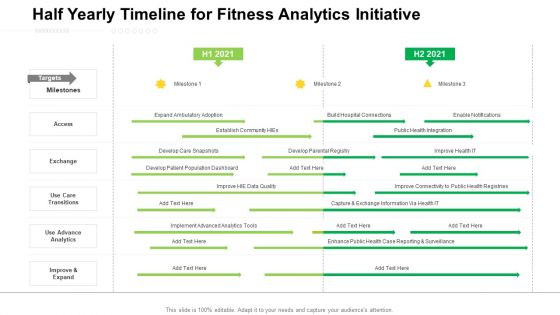
Half Yearly Timeline For Fitness Analytics Initiative Inspiration
Presenting our jaw dropping half yearly timeline for fitness analytics initiative inspiration. You can alternate the color, font size, font type, and shapes of this PPT layout according to your strategic process. This PPT presentation is compatible with Google Slides and is available in both standard screen and widescreen aspect ratios. You can also download this well researched PowerPoint template design in different formats like PDF, JPG, and PNG. So utilize this visually appealing design by clicking the download button given below.
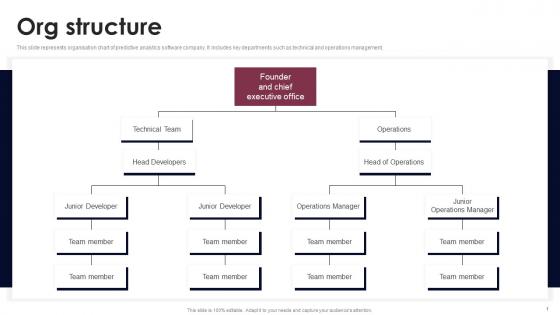
Org Structure Smart Grid Analytics Investor Fund Raising Rules PDF
This slide represents organisation chart of predictive analytics software company. It includes key departments such as technical and operations management. Are you in need of a template that can accommodate all of your creative concepts This one is crafted professionally and can be altered to fit any style. Use it with Google Slides or PowerPoint. Include striking photographs, symbols, depictions, and other visuals. Fill, move around, or remove text boxes as desired. Test out color palettes and font mixtures. Edit and save your work, or work with colleagues. Download Org Structure Smart Grid Analytics Investor Fund Raising Rules PDF and observe how to make your presentation outstanding. Give an impeccable presentation to your group and make your presentation unforgettable. This slide represents organisation chart of predictive analytics software company. It includes key departments such as technical and operations management.

Challenges And Solutions Associated With Text Analytics PPT Template SS
This slide outlines the challenges and solutions associated with text analytics, such as noisy, incomplete, inconsistent, complex data, data integration, etc. Are you in need of a template that can accommodate all of your creative concepts This one is crafted professionally and can be altered to fit any style. Use it with Google Slides or PowerPoint. Include striking photographs, symbols, depictions, and other visuals. Fill, move around, or remove text boxes as desired. Test out color palettes and font mixtures. Edit and save your work, or work with colleagues. Download Challenges And Solutions Associated With Text Analytics PPT Template SS and observe how to make your presentation outstanding. Give an impeccable presentation to your group and make your presentation unforgettable. This slide outlines the challenges and solutions associated with text analytics, such as noisy, incomplete, inconsistent, complex data, data integration, etc.

Budget For Text Analytics Integration In Business PPT Powerpoint SS
This slide outlines the budget allocation for integrating text analytics in an organization, covering expense categories, estimated and actual budget. If your project calls for a presentation, then Slidegeeks is your go-to partner because we have professionally designed, easy-to-edit templates that are perfect for any presentation. After downloading, you can easily edit Budget For Text Analytics Integration In Business PPT Powerpoint SS and make the changes accordingly. You can rearrange slides or fill them with different images. Check out all the handy templates This slide outlines the budget allocation for integrating text analytics in an organization, covering expense categories, estimated and actual budget.
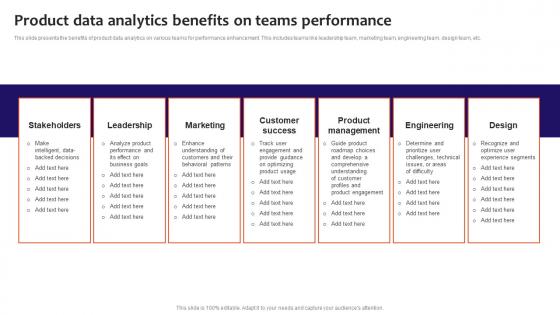
Product Data Analytics Benefits On Teams Performance Mockup Pdf
This slide presents the benefits of product data analytics on various teams for performance enhancement. This includes teams like leadership team, marketing team, engineering team, design team, etc. Pitch your topic with ease and precision using this Product Data Analytics Benefits On Teams Performance Mockup Pdf. This layout presents information on Leadership, Marketing, Customer Success. It is also available for immediate download and adjustment. So, changes can be made in the color, design, graphics or any other component to create a unique layout. This slide presents the benefits of product data analytics on various teams for performance enhancement. This includes teams like leadership team, marketing team, engineering team, design team, etc.
Icon Showing Data Insights At Edge Analytics Demonstration Pdf
Pitch your topic with ease and precision using this Icon Showing Data Insights At Edge Analytics Demonstration Pdf This layout presents information on Icon Showing, Data Insights, Edge Analytics It is also available for immediate download and adjustment. So, changes can be made in the color, design, graphics or any other component to create a unique layout. Our Icon Showing Data Insights At Edge Analytics Demonstration Pdf are topically designed to provide an attractive backdrop to any subject. Use them to look like a presentation pro.
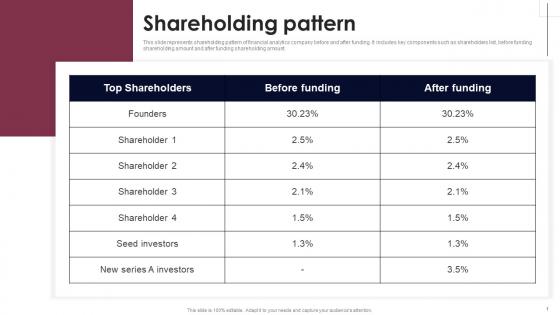
Shareholding Pattern Smart Grid Analytics Investor Fund Raising Structure PDF
This slide represents shareholding pattern of financial analytics company before and after funding. It includes key components such as shareholders list, before funding shareholding amount and after funding shareholding amount. This modern and well-arranged Shareholding Pattern Smart Grid Analytics Investor Fund Raising Structure PDF provides lots of creative possibilities. It is very simple to customize and edit with the Powerpoint Software. Just drag and drop your pictures into the shapes. All facets of this template can be edited with Powerpoint, no extra software is necessary. Add your own material, put your images in the places assigned for them, adjust the colors, and then you can show your slides to the world, with an animated slide included. This slide represents shareholding pattern of financial analytics company before and after funding. It includes key components such as shareholders list, before funding shareholding amount and after funding shareholding amount.
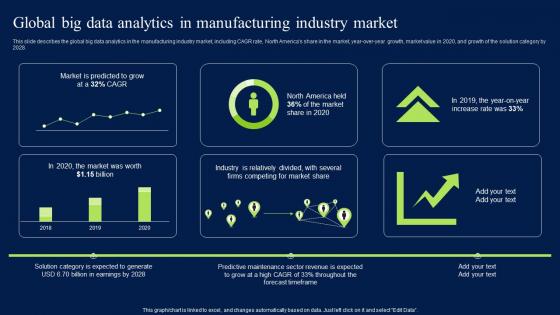
Global Big Data Analytics In Manufacturing Industry Market Graphics PDF
This slide describes the global big data analytics in the manufacturing industry market, including CAGR rate, North Americas share in the market, year-over-year growth, market value in 2020, and growth of the solution category by 2028. Find a pre-designed and impeccable Global Big Data Analytics In Manufacturing Industry Market Graphics PDF. The templates can ace your presentation without additional effort. You can download these easy-to-edit presentation templates to make your presentation stand out from others. So, what are you waiting for Download the template from Slidegeeks today and give a unique touch to your presentation. This slide describes the global big data analytics in the manufacturing industry market, including CAGR rate, North Americas share in the market, year-over-year growth, market value in 2020, and growth of the solution category by 2028.
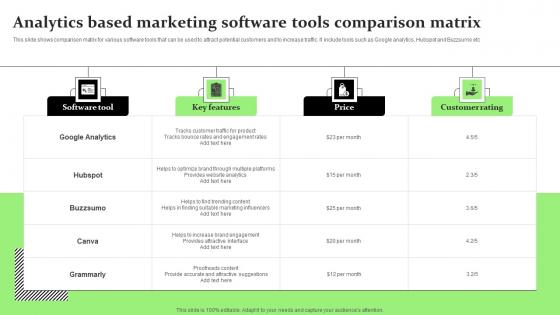
Analytics Based Marketing Software Tools Comparison Matrix Download Pdf
This slide shows comparison matrix for various software tools that can be used to attract potential customers and to increase traffic. It include tools such as Google analytics, Hubspot and Buzzsumo etcPitch your topic with ease and precision using this Analytics Based Marketing Software Tools Comparison Matrix Download Pdf This layout presents information on Attractive Suggestions, Proofreads Content, Attractive Interface It is also available for immediate download and adjustment. So, changes can be made in the color, design, graphics or any other component to create a unique layout. This slide shows comparison matrix for various software tools that can be used to attract potential customers and to increase traffic. It include tools such as Google analytics, Hubspot and Buzzsumo etc
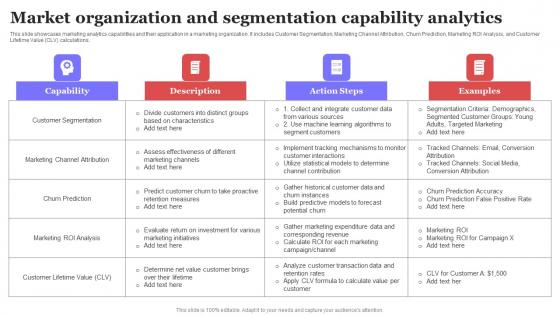
Market Organization And Segmentation Capability Analytics Ppt Example PDF
This slide showcases marketing analytics capabilities and their application in a marketing organization. It includes Customer Segmentation, Marketing Channel Attribution, Churn Prediction, Marketing ROI Analysis, and Customer Lifetime Value CLV calculations. Pitch your topic with ease and precision using this Market Organization And Segmentation Capability Analytics Ppt Example PDF. This layout presents information on Capability, Action Steps, Examples. It is also available for immediate download and adjustment. So, changes can be made in the color, design, graphics or any other component to create a unique layout. This slide showcases marketing analytics capabilities and their application in a marketing organization. It includes Customer Segmentation, Marketing Channel Attribution, Churn Prediction, Marketing ROI Analysis, and Customer Lifetime Value CLV calculations.
Security Analytics Use Cases In Powerpoint And Google Slides Cpb
Introducing our well designed Security Analytics Use Cases In Powerpoint And Google Slides Cpb. This PowerPoint design presents information on topics like Security Analytics Use Cases. As it is predesigned it helps boost your confidence level. It also makes you a better presenter because of its high quality content and graphics. This PPT layout can be downloaded and used in different formats like PDF, PNG, and JPG. Not only this, it is available in both Standard Screen and Widescreen aspect ratios for your convenience. Therefore, click on the download button now to persuade and impress your audience. Our Security Analytics Use Cases In Powerpoint And Google Slides Cpb are topically designed to provide an attractive backdrop to any subject. Use them to look like a presentation pro.
Web Analytics Project Ideas In Powerpoint And Google Slides Cpb
Introducing our well designed Web Analytics Project Ideas In Powerpoint And Google Slides Cpb This PowerPoint design presents information on topics like Web Analytics Project Ideas As it is predesigned it helps boost your confidence level. It also makes you a better presenter because of its high quality content and graphics. This PPT layout can be downloaded and used in different formats like PDF, PNG, and JPG. Not only this, it is available in both Standard Screen and Widescreen aspect ratios for your convenience. Therefore, click on the download button now to persuade and impress your audience. Our Web Analytics Project Ideas In Powerpoint And Google Slides Cpb are topically designed to provide an attractive backdrop to any subject. Use them to look like a presentation pro.

Data Scientist Predictive Analytics In Powerpoint And Google Slides Cpb
Presenting our innovatively designed set of slides titled Data Scientist Predictive Analytics In Powerpoint And Google Slides Cpb. This completely editable PowerPoint graphic exhibits Data Scientist Predictive Analytics that will help you convey the message impactfully. It can be accessed with Google Slides and is available in both standard screen and widescreen aspect ratios. Apart from this, you can download this well structured PowerPoint template design in different formats like PDF, JPG, and PNG. So, click the download button now to gain full access to this PPT design. Our Data Scientist Predictive Analytics In Powerpoint And Google Slides Cpb are topically designed to provide an attractive backdrop to any subject. Use them to look like a presentation pro.
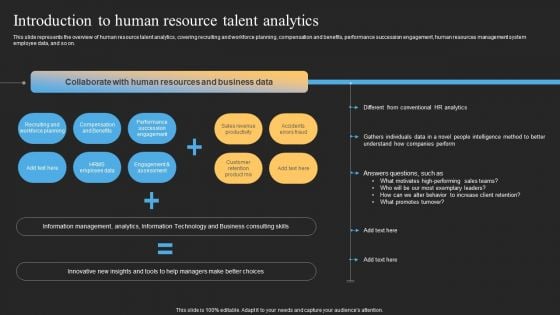
Datafy Introduction To Human Resource Talent Analytics Clipart PDF
This slide represents the overview of human resource talent analytics, covering recruiting and workforce planning, compensation and benefits, performance succession engagement, human resources management system employee data, and so on. Formulating a presentation can take up a lot of effort and time, so the content and message should always be the primary focus. The visuals of the PowerPoint can enhance the presenters message, so our Datafy Introduction To Human Resource Talent Analytics Clipart PDF was created to help save time. Instead of worrying about the design, the presenter can concentrate on the message while our designers work on creating the ideal templates for whatever situation is needed. Slidegeeks has experts for everything from amazing designs to valuable content, we have put everything into Datafy Introduction To Human Resource Talent Analytics Clipart PDF.
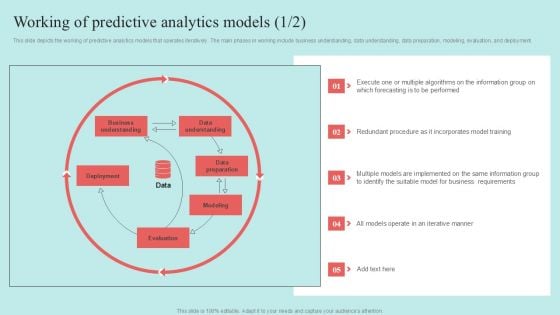
Predictive Data Model Working Of Predictive Analytics Models Pictures PDF
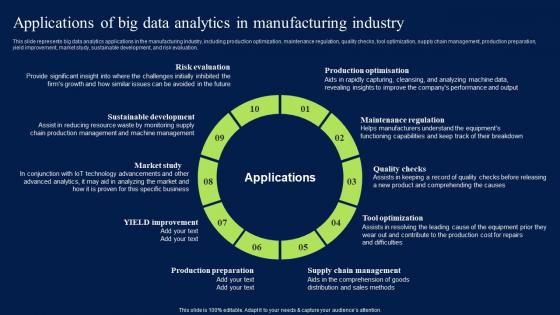
Applications Of Big Data Analytics In Manufacturing Industry Microsoft PDF
This slide represents big data analytics applications in the manufacturing industry, including production optimization, maintenance regulation, quality checks, tool optimization, supply chain management, production preparation, yield improvement, market study, sustainable development, and risk evaluation. This modern and well-arranged Applications Of Big Data Analytics In Manufacturing Industry Microsoft PDF provides lots of creative possibilities. It is very simple to customize and edit with the Powerpoint Software. Just drag and drop your pictures into the shapes. All facets of this template can be edited with Powerpoint, no extra software is necessary. Add your own material, put your images in the places assigned for them, adjust the colors, and then you can show your slides to the world, with an animated slide included. This slide represents big data analytics applications in the manufacturing industry, including production optimization, maintenance regulation, quality checks, tool optimization, supply chain management, production preparation, yield improvement, market study, sustainable development, and risk evaluation.
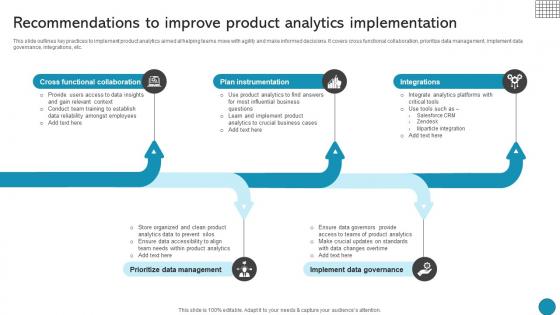
Recommendations To Improve Product Analytics Driving Business Success Integrating Product
This slide outlines key practices to implement product analytics aimed at helping teams move with agility and make informed decisions. It covers cross functional collaboration, prioritize data management, implement data governance, integrations, etc. If your project calls for a presentation, then Slidegeeks is your go-to partner because we have professionally designed, easy-to-edit templates that are perfect for any presentation. After downloading, you can easily edit Recommendations To Improve Product Analytics Driving Business Success Integrating Product and make the changes accordingly. You can rearrange slides or fill them with different images. Check out all the handy templates This slide outlines key practices to implement product analytics aimed at helping teams move with agility and make informed decisions. It covers cross functional collaboration, prioritize data management, implement data governance, integrations, etc.
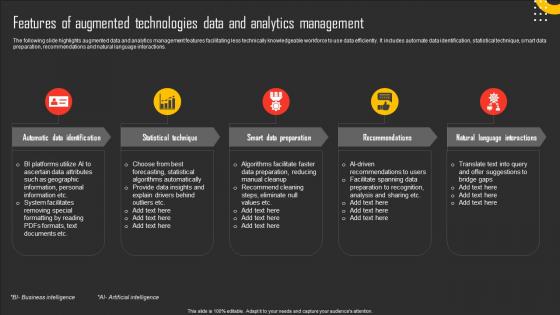
Features Of Augmented Technologies Data And Analytics Management Introduction Pdf
The following slide highlights augmented data and analytics management features facilitating less technically knowledgeable workforce to use data efficiently. It includes automate data identification, statistical technique, smart data preparation, recommendations and natural language interactions. Pitch your topic with ease and precision using this Features Of Augmented Technologies Data And Analytics Management Introduction Pdf. This layout presents information on Statistical Technique, Smart Data Preparation, Recommendations. It is also available for immediate download and adjustment. So, changes can be made in the color, design, graphics or any other component to create a unique layout. The following slide highlights augmented data and analytics management features facilitating less technically knowledgeable workforce to use data efficiently. It includes automate data identification, statistical technique, smart data preparation, recommendations and natural language interactions.
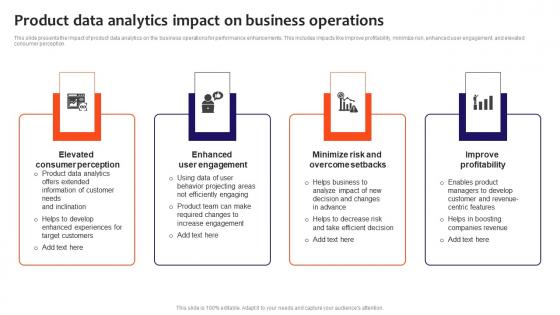
Product Data Analytics Impact On Business Operations Elements Pdf
This slide presents the impact of product data analytics on the business operations for performance enhancements. This includes impacts like improve profitability, minimize risk, enhanced user engagement, and elevated consumer perception. Pitch your topic with ease and precision using this Product Data Analytics Impact On Business Operations Elements Pdf. This layout presents information on Elevated Consumer Perception, Enhanced User Engagement, Improve Profitability. It is also available for immediate download and adjustment. So, changes can be made in the color, design, graphics or any other component to create a unique layout. This slide presents the impact of product data analytics on the business operations for performance enhancements. This includes impacts like improve profitability, minimize risk, enhanced user engagement, and elevated consumer perception.
Open Web Analytics Heatmap In Powerpoint And Google Slides Cpb
Introducing our well designed Open Web Analytics Heatmap In Powerpoint And Google Slides Cpb This PowerPoint design presents information on topics like Open Web Analytics Heatmap As it is predesigned it helps boost your confidence level. It also makes you a better presenter because of its high quality content and graphics. This PPT layout can be downloaded and used in different formats like PDF, PNG, and JPG. Not only this, it is available in both Standard Screen and Widescreen aspect ratios for your convenience. Therefore, click on the download button now to persuade and impress your audience. Our Open Web Analytics Heatmap In Powerpoint And Google Slides Cpb are topically designed to provide an attractive backdrop to any subject. Use them to look like a presentation pro.


 Continue with Email

 Home
Home


